Old Bitcoin Whales Moving Coins: Will This Help Push BTC Above $74,000?

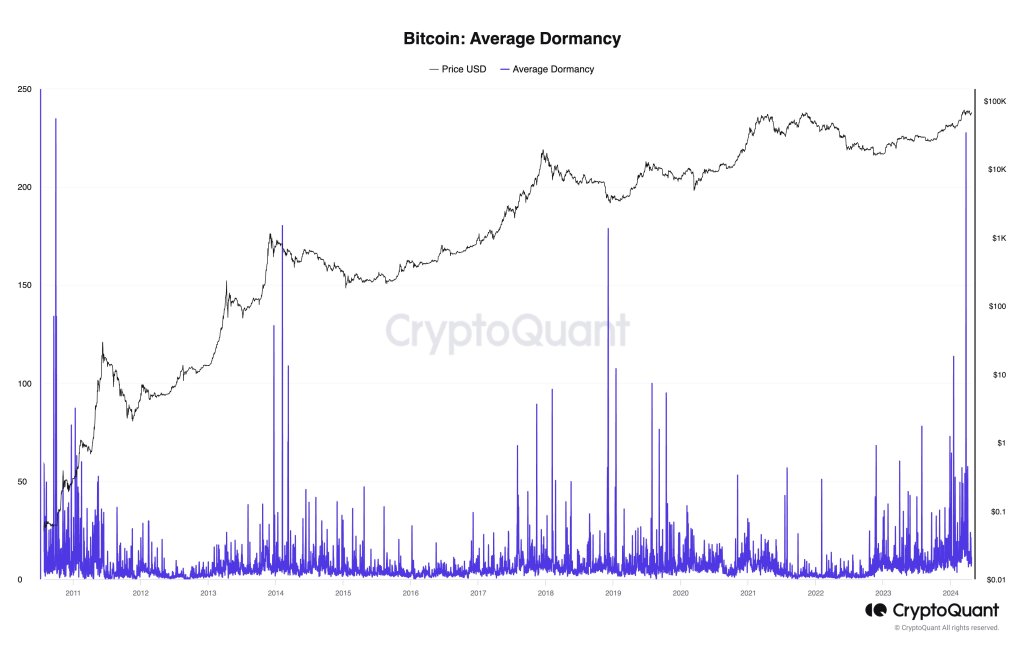
While Bitcoin struggles to extend gains, on-chain data shared by Ki Young Ju, the founder of CryptoQuant, on X shows increased movement of old coins. As the Bitcoin Average Dormancy chart shows, this trend recently hit a 13-year high. 

More Old Whales Moving Coins

The Bitcoin Average Dormancy shows the average number of days each BTC has been dormant. On-chain data indicates that coins held for 3 to 5 years have changed hands and moved to new owners. 

BTC dormancy chart | Source: CryptoQuant

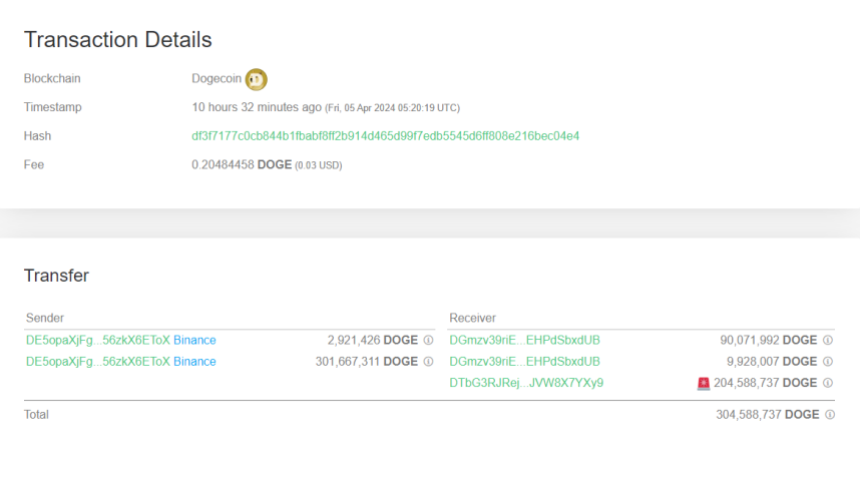
While there was movement, interestingly, data shows that they were not transferred to exchanges. Instead, it is highly likely that they were traded over the counter (OTC).

Usually, any transfer to centralized exchanges like Binance or Coinbase could suggest the intention of selling. The more coins hit these exchanges, especially from whales, the higher the chance of price dumping. However, if trades are made via OTC, the impact on spot rates is negligible, which is a positive for bulls.

Further analysis of these transfers using the Spent Output Profit Ratio (SOPR) indicator suggests that whales moving them made decent profits. Historically, whenever whales dump and register profits, prices tend to dip.

Will Bitcoin Prices Retest All-Time Highs

However, in a post on X, one analyst says prices will likely increase because of the impact of spot Bitcoin exchange-traded funds (ETFs). These derivatives are like a buffer against price drops, considering the pace of inflows in the past weeks.

Spot ETFs allow institutions to gain regulated exposure to BTC. Coupled with decreasing outflows from GBTC, the odds of prices rising remain elevated. 

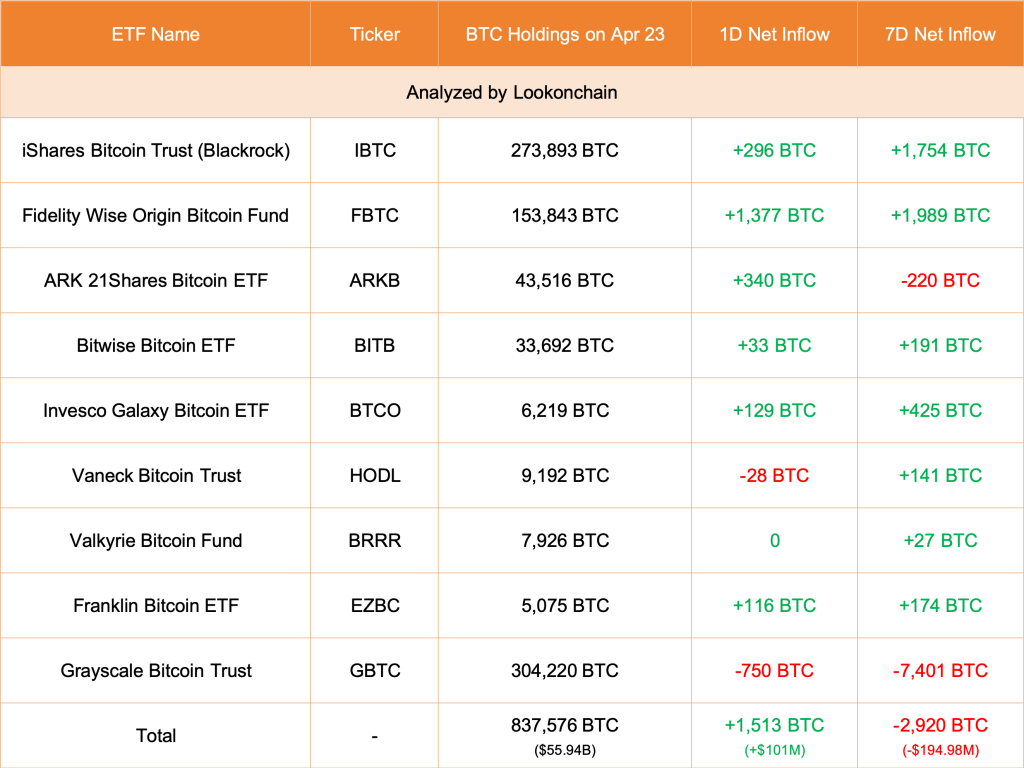
According to Lookonchain data, GBTC unloaded 750 BTC on April 23. However, Fidelity and other eight spot ETF issuers bought 1,513 BTC on behalf of their clients. Spot Bitcoin ETF issuers sell shares representing BTC holdings. These coins can be purchased from secondary markets like Binance, via OTC platforms, or directly from miners. 

Spot Bitcoin ETF flow data | Source: Lookonchain

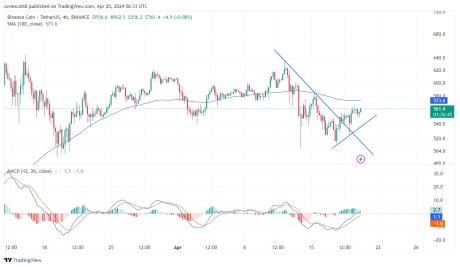
BTC prices remain muted and capped below $68,000, representing April 13 highs.

To define the uptrend, there must be a high volume expansion above this liquidation line, reversing recent losses. 

Bitcoin price trending downward on the daily chart | Source: BTCUSDT on Binance, TradingView

Even so, looking at the BTCUSDT candlestick arrangement in the daily chart, bulls must break above all-time highs for a clear trend continuation. Ideally, the uptick above $73,800 and the current range should be with expanding volumes, confirming the presence of buyers.

BNB Resilience: Holding Firm At $560 – What’s Next?

The price of BNB hasn’t fallen below its previous low, and it’s showing some strong signs of heading up. After a spell of moving downward, the Binance Smart Chain’s native token is aiming for an upward bounce back towards its earlier high.

Technical Indicators Point Toward Sustained Uptrend For BNB

To figure out where the BNB price might be headed next, several indicators can be used to examine the chart:

BNB

4-Hour MACD: A technical look at the MACD indicator from the 4-hour timeframe, the MACD histograms are trending above the zero line, and both the MACD line and the Signal line have crossed and are heading towards the MACD zero line, indicating a bullish trend. This can be seen in the above image.

RSI 4-hour Timeframe: The formation of the Relative Strength Index (RSI) in the below image also suggests an upward movement as the RSI signal line is seen trending above the 50% level. This indicates that buyers are still very active in the market therefore overpowering the strength of sellers.

4-hour alligator: A look at the alligator indicator from the 4-hour time frame shows that BNB is trading above the alligator lines as the alligator lip and teeth have both successfully crossed above the alligator jaw, suggesting that the price might be starting a new rally.

BNB

At the time of writing, the price of BNB was up by 1.35% and was trading around $561 in the last 24 hours. BNB price is showing bullish signs and also forming a base above the $508.1 support level. Also, the price is trading above the bearish trend line and below the 100 Simple Moving Average (SMA) on the 4-hour chart.

Final Thoughts

From the previous downward movement, the price of BNB has managed to create one major resistance level of $635 and one major support level of $508. Currently, BNB is moving toward this resistance level and if it breaks above this level, the price might go even further to create a new high. 

On the other hand, if the price fails to break above this major resistance, it will reverse and start a downward movement toward its previous support and if it manages to break below this support level, the price might move further downward thereby starting a new downward trend.

BNB

Dogecoin Whale Takes $52.3 Million In DOGE Off Binance, Sign Of Buying?

On-chain data shows a Dogecoin whale made a large withdrawal from Binance today, which may be bullish for the memecoin’s price.

A Large Amount Of Dogecoin Has Left The Binance Platform In The Past Day

According to data from the cryptocurrency transaction tracker service Whale Alert, a large transfer has been spotted on the Dogecoin blockchain during the past day.

In this move, the network has processed the movement of 304,588,737 DOGE, worth around $52.3 million when the transaction was executed. Given the large scale of the transfer, it’s likely that a whale entity was involved.

The whales are influential on the network due to the sheer number of tokens they carry in their wallets. As such, their moves can be worth keeping an eye on since they may cause noticeable fluctuations in the market.

How the market would be affected by the moves from these humongous entities depends on what they intend to do with those moves. Naturally, it’s impossible to say what an investor plans to do confidently.

The type of addresses involved in the transaction, however, can sometimes at least provide a hint about what the whale may have wanted to achieve with the move.

Below are the details of the latest Dogecoin whale transaction, which reveals its relevant addresses.

Dogecoin Whale Outflow

As is visible, this Dogecoin transaction was executed from a wallet connected to the cryptocurrency exchange Binance. The destination of the move appears to have been a couple of unknown addresses.

An unknown address refers to a wallet not affiliated with any centralized entity like an exchange (the sender in this transfer is a “known” wallet as it’s attached to a central entity in Binance). Generally, such addresses are the investors’ personal, self-custodial wallets.

Transfers where coins move in the direction of exchanges to self-custodial entities are known as “exchange outflows.” Usually, investors make such moves when they plan to hold onto their coins long-term, as it’s safer to do so outside of these platforms, where the platforms control the wallets.

Exchange outflows can also sometimes be an indication that fresh buying is going on, as some investors like to immediately withdraw their purchases of these platforms.

Given the relatively massive scale of the Dogecoin exchange outflow in the current case, it can naturally be bullish news for investors if the whale is indeed accumulating here.

However, the scenario also exists where the whale has withdrawn to sell through the peer-to-peer (P2P) mode. In this case, the effect on the asset could be bearish instead.

DOGE Price

At the time of writing, Dogecoin is floating around $0.176, down 16% over the past week.

Dogecoin Price Chart