The Bitcoin correlation with the macro markets reached new highs in 2022. This saw the price of the digital asset, and the entire crypto market by extension, follow the movement of the stock and equities market very closely. There were forecasts that the cryptocurrency would begin to decouple from the macro market as time went on but data shows that the correlation still remains very high even now.
Following The Macro Market
One of the most prominent ways that the macro market and the bitcoin correlation have shone through has been during important events like the CPI data releases. The last CPI data release came back with higher rates than expected and the crypto market had responded almost immediately. Looking at bitcoin alone, it would’ve been normal to deduce that the market was reacting independently, but it had, in fact, followed the movement of the macro market.
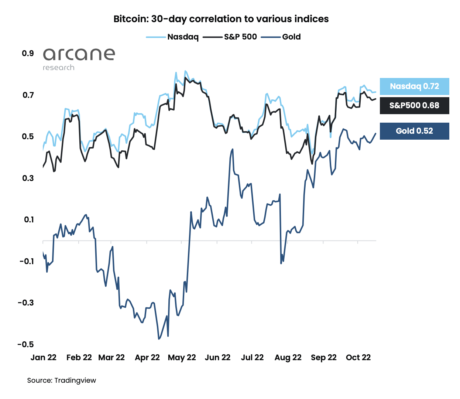
Presently, the correlation between bitcoin and the macro market is sitting near multi-year highs, and so is the bitcoin correlation to the gold market. This has seen the cryptocurrency move in tandem with the broader financial markets despite the decentralized nature of the digital asset.
BTC correlation to macro markets wax stronger | Source: Arcane Research
Data shows that the correlation between the equities market and bitcoin had been steady at around 0.7 for the last month, making a similarly recorded trend between April and June 2022. If history is to repeat itself, then there might be some reprieve as the correlation could decline just like it did back then.
Behind The Bitcoin-Stock Market Correlation
For the longest time, bitcoin and the crypto market had been able to grow without much implications from the stock market movements. However, this would begin to change during the lockdown period of 2020, and companies getting into the digital asset
BTC falls to low $19,000s | Source: BTCUSD on TradingView.com
Over the last two years, companies have bought tens of thousands of BTC to add to their balance sheets, with MicroStrategy alone holding more than 130,000 BTC. Given this, the performance of these companies in the stock market had begun to spill over into bitcoin. The stimulus payments also gave investors some ‘free’ money to put into the markets, which led to the inevitable pump of both markets at the same time, and the crossover of companies into crypto only help to push the correlation further.
For the short term at least, what this means is that keeping an eye on the macro markets is important for bitcoin investors. The downward correction last week was a result of the macro markets adjusting to price in the expected Nov. 2nd FOMC hike. If the FOMC goes the way of the CPI data release, then investors should brace for another decline in price.
Featured image from Forbes, charts from Arcane Research and TradingView.com
Follow Best Owie on Twitter for market insights, updates, and the occasional funny tweet…


