Bitcoin Volatility Induces $700 Million Carnage In Crypto Futures

Data shows the cryptocurrency futures market has seen liquidations amounting to $700 million in the past day as Bitcoin has gone through its volatility.

Bitcoin Has Seen Intense Price Action In Past 24 Hours

The past day has been a bit of a rollercoaster for Bitcoin, with the asset registering sharp price action in both directions but ultimately going up as the bulls win out.

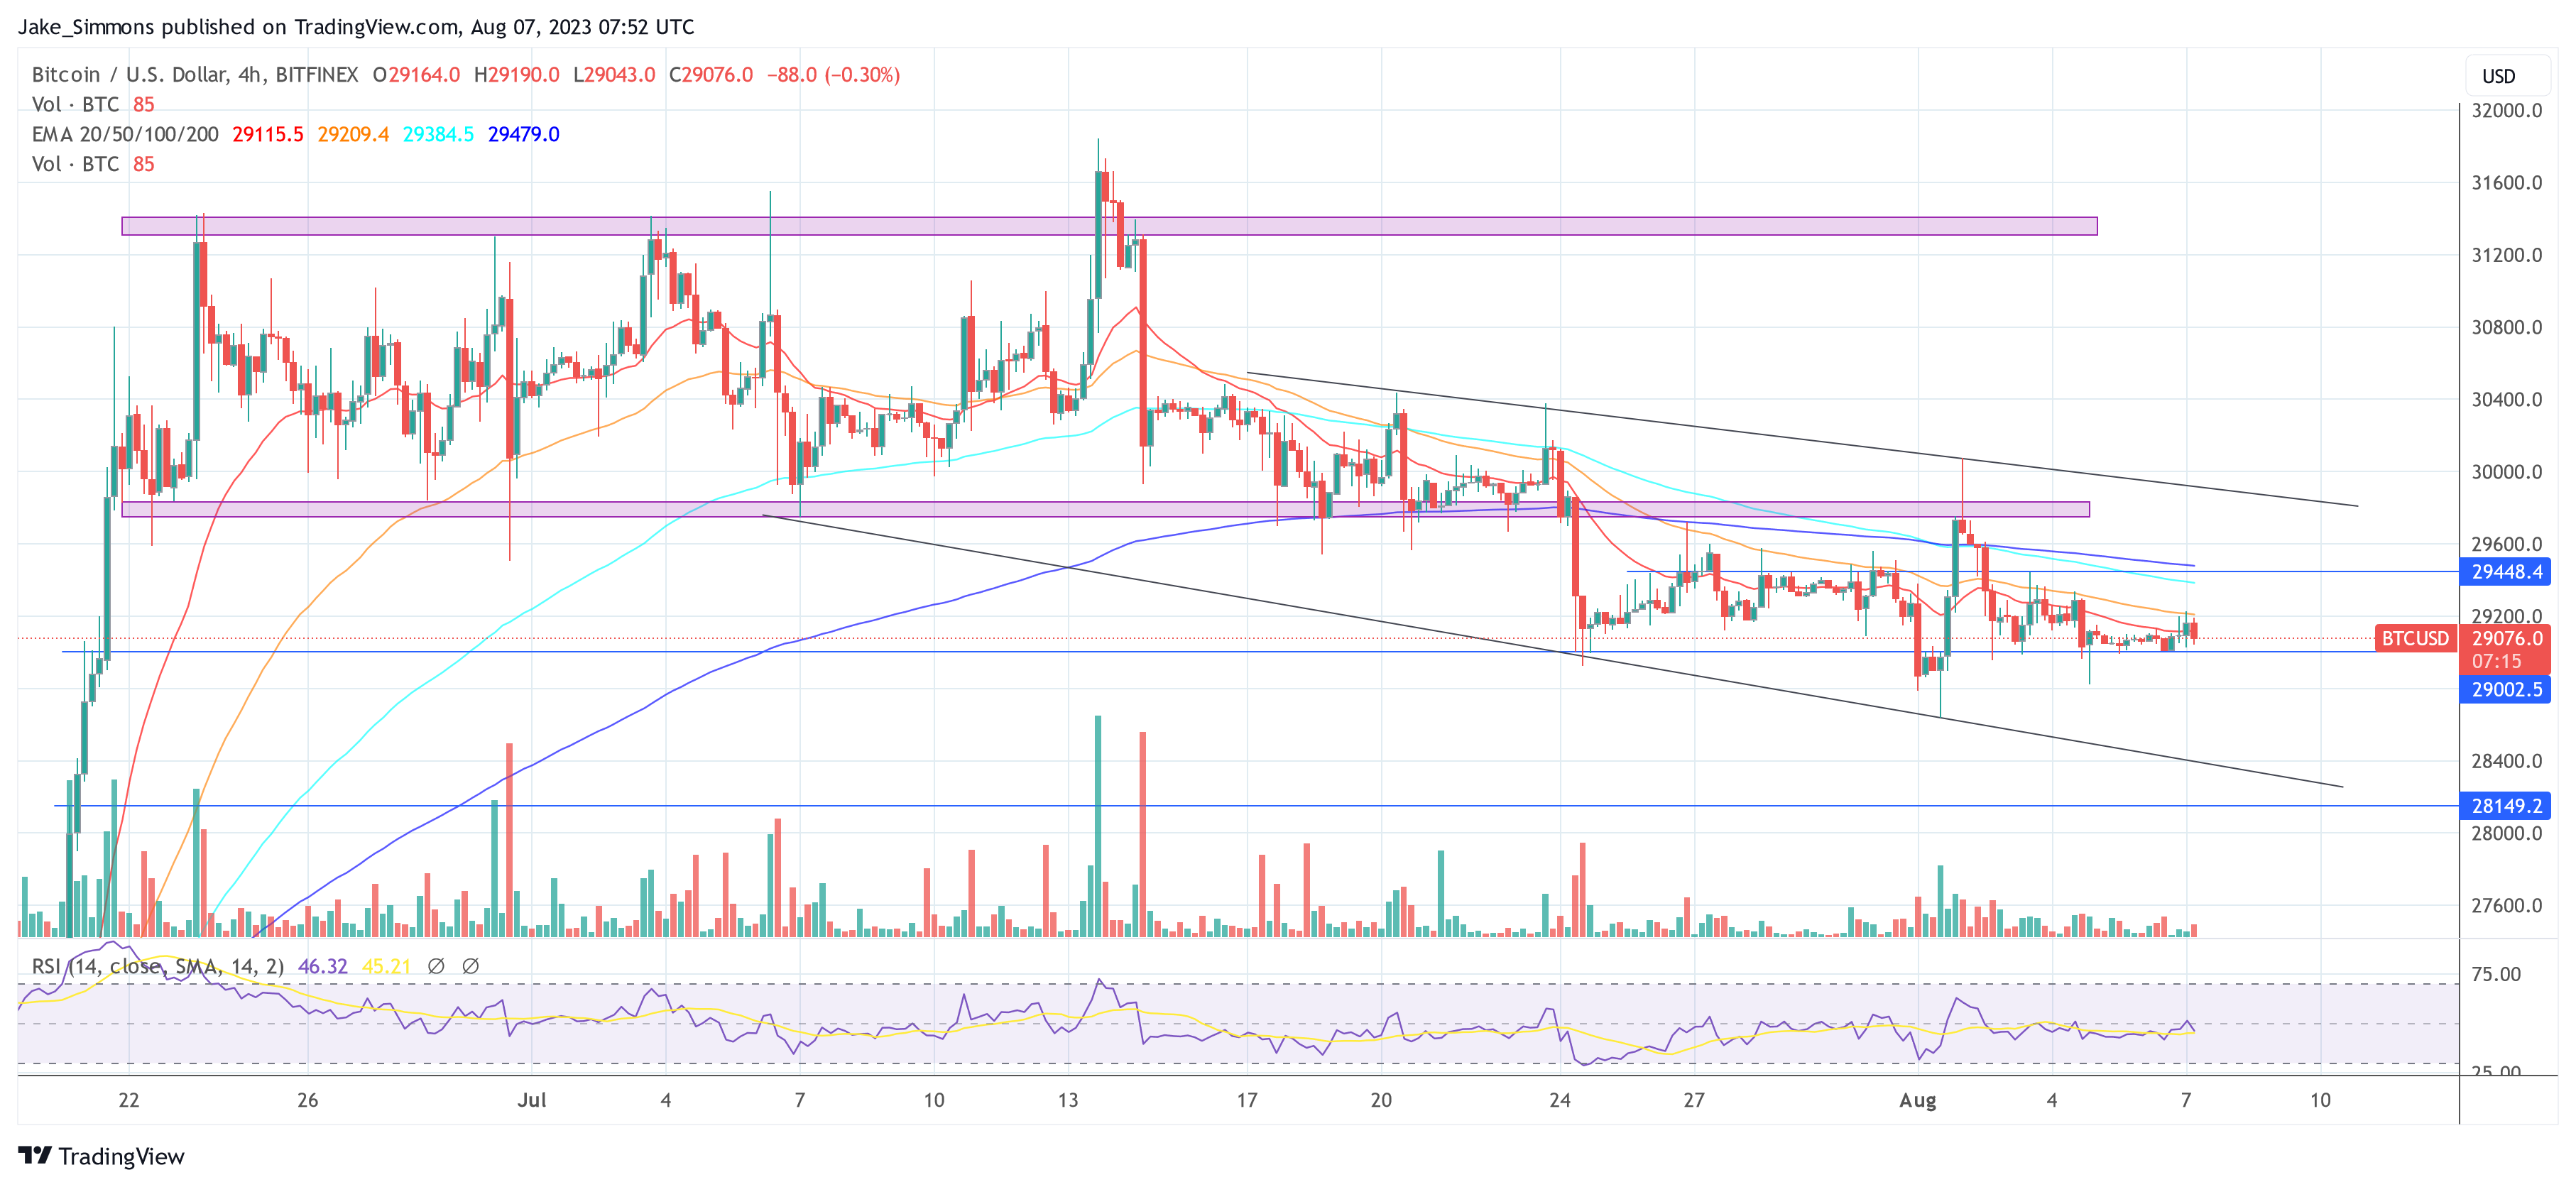
The chart below shows what the price action for the cryptocurrency has looked like recently.

Bitcoin Price Chart

From the graph, it’s visible that Bitcoin initially witnessed some sharp bullish momentum, in which the coin not only broke above the $60,000 level, but went up to touch the $64,000 mark.

This high, which is the peak for the year so far, only lasted briefly, however, as BTC crashed down spectacularly to under the $59,000 mark. The asset has since recovered to higher levels, now floating around $62,700.

The rest of the cryptocurrency sector has also gone through its volatility, with prices fluctuating across the coins. As is usually the case with such sharp price action, the futures market has suffered many liquidations.

Crypto Futures Market Has Gone Through A Squeeze In The Past Day

According to data from CoinGlass, the cryptocurrency futures market has witnessed the liquidation of contracts worth more than $700 million in the last 24 hours.

The table below displays the relevant information about the liquidations.

Bitcoin & Crypto Liquidations

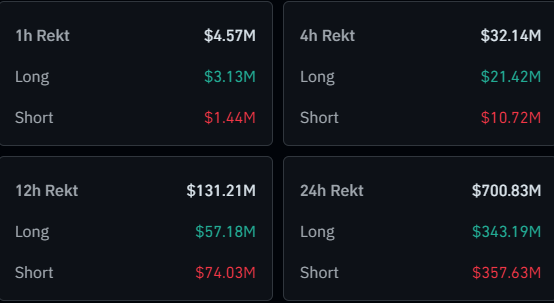
It would appear that only $131 million of the liquidations came within twelve hours, suggesting that most of the flush was situated inside the preceding half-day period. This makes sense, as Bitcoin was most volatile inside this window.

It also seems that the long-to-short ratio in this liquidation event has been quite balanced, even though the price has increased in the past day. This would suggest that some aggressive longing occurred as Bitcoin approached $64,000, and the subsequent pullback wiped these top buyers.

The table below shows how the distribution has looked for the various symbols.

Bitcoin & Other Cryptos

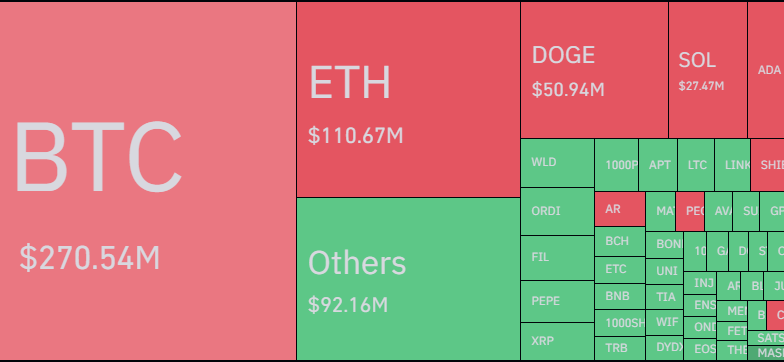
As is generally the case, Bitcoin futures contracts have again been responsible for the largest portion of the total market liquidations, contributing around $270 million.

What’s different this time, however, is that this share, although the largest, isn’t even half the total liquidations. This could come down to the fact that speculators may now be playing around with altcoin positions after gaining confidence from the BTC price surge.

Dogecoin, the best performer among the top coins with its 34% jump, has occupied the largest share among the alts, with almost $51 million in liquidations.

Will Bitcoin Volatility Continue? These Metrics Say Yes

Bitcoin has observed some sharp price action today, and if data of these metrics is to go by, the asset may not be done being volatile just yet.

Bitcoin’s Open Interest And Leverage Ratio Have Remained High

As explained by an analyst in a CryptoQuant post, some metrics are forming a pattern that can lead to more volatility in the cryptocurrency’s price. These indicators are the open interest and the estimated leverage ratio.

The “open interest” refers to the total amount of Bitcoin futures contracts that are open on all derivative exchanges. An increase in this metric suggests that the investors are opening more positions on the futures market right now, while a decrease implies some of them are closing their positions, or are getting liquidated.

The other metric of interest here, the “estimated leverage ratio,” keeps track of the ratio between the open interest and the derivative exchange reserve (that is, the total amount of Bitcoin sitting in the wallets of these derivative platforms).

What this metric tells us is the amount of leverage that futures users are opting for on average. High leverage can significantly increase the risk of a large number of contracts being liquidated, so whenever this metric has a high value, the market can become more probable to show high volatility due to violent liquidation events.

Now, here is a chart that shows the trend in these two Bitcoin indicators over the past few days:

Bitcoin Open Interest & Leverage Ratio

As displayed in the above graph, the Bitcoin open interest and estimated leverage ratio had both been at relatively high values right before the plunge that the asset saw in the past 24 hours.

In this sharp price plummet, the futures market naturally observed a high amount of liquidations, leading to the open interest registering some decrease. The metric, however, didn’t actually see that much of a cool down despite these liquidations, and it has now already reached back to the same levels it was at before the volatility.

This would suggest that the futures market users have opened new positions since the mass liquidation event. While the open interest had gone down in this event, albeit briefly, the leverage ratio actually hadn’t budged even that much.

Rather, the indicator has only been going up, implying that the users opening up the new futures contracts are only opting for higher and higher amounts of leverage.

Because of the open interest rebounding and the leverage ratio only trending higher, it would appear like a reasonable possibility that the Bitcoin price would observe more volatility in the near future.

Such volatility can take the coin in either direction, but generally, the side of the market with the less amount of contracts is the more probable one.

In the chart, the data for the “funding rates” is attached, which basically tells us whether the longs or the shorts are dominant in the futures market currently.

The funding rates had been positive in the latest futures market overheat, as well as in the one seen earlier in the month, but following today’s long liquidations, the metric has turned negative. This may suggest that a liquidation event involving the shorts is more likely to happen next.

BTC Price

At the time of writing, Bitcoin is trading around $28,500, down 3% in the last week.

Bitcoin Price Chart

Behind The Quiet: Low Bitcoin Volatility Masks Underlying Market Dynamics

In the world of Bitcoin, silence is not always golden. The recent weeks have seen Bitcoin’s price volatility drop to historical lows, with the BTC price trading mostly between $29,000 and $30,000. However, beneath this placid surface, a number of intriguing market dynamics are at play.

“Realized volatility for Bitcoin has collapsed to historical lows. Across 1-month to 1yr timeframes, this is the quietest we have seen the corn since after March 2020. Historically, such low volatility aligns with the post-bear-market hangover periods (re-accumulation phase),” stated Checkmate, lead on-chain analyst at Glassnode.

Bitcoin volatility

The chart shared by Checkmate shows that annualized realized volatility resembles the post-bear era for Bitcoin from March 2020 when volatility was at 47%. Currently, 1-year volatility sits at 49.1%, 3-month volatility at 35.5%, and 1-month volatility at 22.9%.

Quit Before The Storm For Bitcoin

However, the low volatility is not the only story. Checkmate also highlighted a new all-time high for Bitcoin’s long-term holder supply, now at 14.59M BTC, which accounts for 75% of the circulating supply. This shows that an increasingly high number of Bitcoin investors are convinced of a future rally, leading to a supply shortage, while high risk traders are washed out of the market due to lacking volatility.

Simultaneously, there’s a surge in institutional positioning; volume and open interest of the CME Bitcoin futures have reached a 20-month high in July. Despite the Bitcoin spot markets recording low volumes, the CME futures saw the highest volume since January 2022, with $55.8 billion in July.

Volume and OI of CME Bitcoin futures

The CTFC data reveals a fascinating slugfest between two investor groups. Asset managers are $1.2 billion net long, while hedge funds are net short by -$980 million. This standoff suggests an imminent breakout in Bitcoin’s price, potentially leaving one of these groups with burnt fingers.

On-chain analyst Ali Martinez provided further insight: “Even as Bitcoin dropped from $32,000 to $29,000, the number of new BTC addresses steadily rose! This bullish divergence between price and network growth hints at a stable long-term BTC uptrend. Buy the dip!”

Indeed, the current low volatility phase is not without precedent or predictive power. Renowned analyst @CryptoCon provides a compelling perspective on this, stating that such periods of sideways price action are not only normal but potentially bullish.

“Bitcoin sideways price action at this point in the cycle is completely normal! The 2 Week Mass Index crosses into the golden pocket at the most stagnant cycle points, just before massive bullish moves. Data everywhere points to the same conclusion: Low volatility is bullish,” CryptoCon tweeted.

Bitcoin golden pocket

Chris Burniske, partner at Placeholder VC, also shared his perspective on the current market dynamics. “Currently, tourists are inactive while residents are accumulating swiftly, owning 74.8% of all supply. That’s consistent with an early-stage bull market. Thirty percent of BTC has left for cold storage since 2020, leaving exchanges with 2.26 million. Bitcoin seems fairly valued relative to the number of active entities on the network.”

Burniske’s simplified price/cycle model projects Bitcoin to reach near $39,000 by the fourth quarter of 2023 and $92,000 (base scenario) by Q4 2025 with entities above 600,000.

In conclusion, the current low volatility phase of Bitcoin may seem uneventful on the surface, but the underlying market dynamics suggest a different story. The tug-of-war between asset managers and hedge funds, the steady rise in new BTC addresses, and the swift accumulation by long-term holders all hint at a brewing storm.

At press time, the Bitcoin price was at $29,076.

Bitcoin price

Bitcoin Sell-Side Risk Ratio Nears All-Time Lows, Big Move Soon?

On-chain data shows the Bitcoin sell-side risk ratio has approached all-time lows recently, a sign that a big move could be coming for the coin.

Bitcoin Sell-Side Risk Ratio Has Observed A Plunge Recently

As pointed out by the lead on-chain analyst at Glassnode in a Tweet, BTC sellers may have become exhausted recently. The “sell-side risk ratio” is an indicator that measures the ratio between the sum of all profits and losses being realized in the Bitcoin market and the realized cap.

The “realized cap” here refers to the capitalization model for Bitcoin that calculates a sort of “true” value for the cryptocurrency by assuming that each coin in the supply is not worth the same as the current spot price, but the price at which it was last moved.

As the profits and losses being harvested in the market are nothing but a measure of the selling pressure in the market, this indicator tells us how the selling pressure (or the sell-side risk) looks like relative to the value of the cryptocurrency (the realized cap).

When the value of this indicator is high, it means the investors are participating in a high amount of profit/loss realization right now. Such a market is usually high risk, as the price tends to be more volatile during periods with these values.

On the other hand, low values imply the holders are reluctant to sell currently. These conditions generally occur when the market has calmed down and accumulation tends to take place in such periods.

Now, here is a chart that shows the trend in the Bitcoin sell-side risk ratio over the history of the cryptocurrency:

Bitcoin Sell-Side Risk Ratio

As shown in the above graph, the Bitcoin sell-side risk ratio has seen a sharp plunge recently, a sign that there is little profit or loss realization going in the market right now.

The indicator is now below the “low value realization” line that the analytics firm has defined (colored in red in the chart). Historically, whenever the metric has plunged into this zone, the market has built up towards a sizeable move in the price.

Since such low values of the indicator imply the lack of sellers in the market, the common expectation may be that this can be a bullish sign. However, as is visible from the graph, this hasn’t necessarily been the case.

Both bullish and bearish price action has occurred following the formation of this pattern. Just back in March of this year, the indicator had shown this trend, but the cryptocurrency had followed up with a sharp correction.

Breaks into the high value realization zone (that is, the condition where there is a large amount of selling going on), though, have generally always been bearish for Bitcoin.

As the indicator has once again dipped into the low value realization area, it’s possible that a large move in the price may follow soon. Although it’s uncertain which direction exactly this volatility might go.

BTC Price

At the time of writing, Bitcoin is trading around $26,100, down 2% in the last week.

Bitcoin Price Chart

Bitcoin Volatility Shrinks To Historical Levels, Violent Move Incoming?

Data shows that Bitcoin volatility is currently at historically low levels, something that has led to violent price moves in the past.

Bitcoin 7-Day Range Has Compressed To Just 3.4% Recently

According to data from the on-chain analytics firm Glassnsode, the current 7-day price range is comparable to levels seen back in January of this year. The “7-day price range” of Bitcoin here refers to the percentage difference between the highest and the lowest points that the asset’s value has observed during the last seven days.

This metric can provide hints about the recent volatility that the cryptocurrency has experienced. When the indicator has a low value, it means the price action during the last week has been quite stale. Naturally, this suggests that the volatility of the asset is low right now.

On the other hand, high values of the 7-day price range imply the coin has seen a high degree of fluctuation within the past seven days, and hence, the volatility has been high.

Now, here is a chart that shows the trend in the Bitcoin 7-day price range (as well as the 7-day high and low) over the last few years:

Bitcoin 7-day Volatility

As shown in the above graph, the Bitcoin 7-day price range had naturally succumbed to quite low values during the bear market lows that had followed the FTX crash, as the BTC price had been stuck in a sideways movement.

These low values of the indicator continued into the new year as the coin refused to show any significant movement. Soon after, however, the metric’s value had seen an explosion as the rally had begun to take place.

In the next few months, the 7-day price range of the cryptocurrency had assumed relatively high values, but recently, the indicator has observed another plummet.

The reason behind this new plunge has naturally been the narrow consolidation range that the asset has followed in the past week between the $27,400 and $26,500 levels.

Because of this low volatility, the 7-day price range of Bitcoin has collapsed to only 3.4%. In the chart, Glassnode has also highlighted the previous instances where the cryptocurrency had seen this metric drop so low.

It looks like the indicator dipped to similar levels way back in July 2020, and the aforementioned lows from the start of the year had also observed the indicator attain such values.

An interesting thing to note about both these periods of low volatility is that the price had gone on to see rapid price action not too long after they occurred, and the former low was followed by the 2021 bull run, while the ongoing rally succeeded the latter one.

If the current compressed 7-day Bitcoin price range will follow a similar pattern, then some wild price action may be coming for the cryptocurrency in the near future.

BTC Price

At the time of writing, Bitcoin is trading around $26,800, down 2% in the last week.

Bitcoin Price Chart

Bitcoin Currently More Stable Than Gold, DXY, Nasdaq, Here’s What Could Happen Next

Data shows Bitcoin has been more stable than gold, DXY, Nasdaq, and S&P 500 recently, here’s what history says could follow next.

Bitcoin 5-Day Volatility Has Fallen Below That Of Gold, DXY, Nasdaq, And S&P 500

According to the latest weekly report from Arcane Research, BTC has been more stable than these assets for a record duration already this year. The “volatility” is an indicator that measures the deviation of daily returns from the average for Bitcoin.

When the value of this metric is high, it means the crypto has been registering a higher amount of returns compared to the mean, suggesting that the coin has involved a higher trading risk recently. On the other hand, low values imply there haven’t been any significant fluctuations in the price in recent days, showing that the market has been stale.

Now, here is a chart that shows the trend in the 30-day volatility for Bitcoin over the course of its entire history:

Bitcoin Volatility

As shown in the above graph, the Bitcoin 30-day volatility is at very low levels currently as the price has been trading mostly sideways in recent weeks. The current values of the indicator are the lowest since 2020, but they are still higher than some of the lows during previous bear markets.

One consequence of this recent flat movement has been that BTC has become more stable than assets like gold, DXY, Nasdaq, and S&P 500. To compare these assets’ volatilities against each other, the report has made use of the 5-day volatility (and not the 30-day or 7-day one).

The below table highlights the periods in BTC’s lifetime when the crypto’s 5-day volatility has been simultaneously lower than all these traditional assets.

Bitcoin More Stable Than Stocks

As the table displays, there have only ever been a handful of instances where the Bitcoin 5-day volatility has been lower than that of gold, DXY, Nasdaq, and S&P 500 at the same time. The report labels such occurrences as “relative volatility compression” periods.

It seems like, before the latest streak, the highest duration of this trend was just 2 consecutive days. This means that the current relative volatility compression period is already the longest ever in the coin’s history.

Another interesting fact in the table is the total returns in Bitcoin that were observed in the 30-day period following the first date of the volatility compression in each of these instances. Besides one occurrence (September 29, 2022), all other volatility compression periods were succeeded by the price becoming highly volatile and registering large returns.

It now remains to be seen whether a similar pattern will follow this time as well, with Bitcoin experiencing a wild next 30 days after this seriously flat price action.

BTC Price

At the time of writing, Bitcoin is trading around $17,400, up 3% in the last week.

Bitcoin Price Chart

Bearish Indicator: Bitcoin Volatility Hits All-Time Low

Bitcoin volatility has been on a decline since the start of December. This has been a culmination of both low interest from investors, as well as the declining prices of digital assets in the market. It has not led bitcoin to record its lowest volatility level on record yet.

Bitcoin At All-Time Low Volatility

Will Clemente shared a chart on Sunday that showed that bitcoin volatility had fallen to an all-time low. The chart itself is interesting in the fact that it shows just how the bitcoin volatility had been moving over the last few months.

There were multiple spikes in volatility from the start to the middle of the year 2022. However, toward the end, volatility dives off a cliff and continues this downtrend at this time. Keep in mind that the volatility of an asset is basically how much the price in dollars moved up and down in a given period. The larger the movement in price, the higher the volatility of a coin.

Given that the price of bitcoin has been more or less steady over the last few months, it tracks that the volatility would be lower. Then in December, the price of bitcoin had mainly revolved around the $16,000 level, causing volatility to decline.

Bitcoin has barely moved price-wise in the last 7 days, up only 0.56% in this one-week period. It is the lowest that volatility has ever been, and while it would normally paint a bullish picture for the digital asset, it has invigorated the bears.

Bitcoin price chart from TradingView.com

Not A Good Time For BTC

Now, more often than not, when volatility falls to such low levels, it has been right before a bull market where prices had recovered sharply. However, the timing of these have also mattered greatly because it is what determines whether low volatility is bearish or bullish. 

One of the times when low volatility had been very bearish was back in 2018. Like now, the market had just come out of an explosive bull rally that saw bitcoin hit new all-time highs. But with such low momentum, it had caused the price to crash a further 50%.

Given the similarities of both situations, it is likely that this will go as it did in 2018 compared to when volatility hit a low in 2020. The bitcoin bottom is likely not in too, which lends credence to this bearish case, although the decline may not be as high as 50%. This chart posted by Twitter user @DrahoslavP puts in perspective just how volatility has affected the price of the digital asset.

Nevertheless, it is not all bad news for bitcoin. In fact, looking over the long term, it is important for this to happen. Right after the low volatility and eventual decline in 2018, bitcoin marked the bottom of the bear market. This had given way to the recovery that would set the pace for the next bull market.

In other words, if a decline follows the current volatility trend, then it may present the best opportunity for investors to get into the digital asset. For BTC bottom chasers, this could be the holy grail of bottom indicators.

Bitcoin NVT Golden Cross Still In “Overbought” Region, Volatility To Follow?

Data shows the Bitcoin NVT Golden Cross is still in the “overbought” region, a sign that there may be more volatility to come for the cryptocurrency.

Bitcoin NVT Golden Cross Continues To Be At A High Value

As pointed out by an analyst in a CryptoQuant post, the BTC long-term holders have been moving their coins recently. The “NVT ratio” is an indicator that measures the ratio between the Bitcoin market cap and the transaction volume on the chain (both in USD). What this metric tells us is whether the value of the cryptocurrency (the market cap) is comparable to the ability to transact coins or not (the volume).

When the value of the metric is high, it means BTC is overvalued right now as transaction volumes are low compared to the market cap. On the other hand, low values imply the crypto may be undervalued currently.

The “NVT Golden Cross” is an indicator that compares the long-term (30-day MA) and the short-term (10-day MA) trends of the NVT ratio to identify tops and bottoms in the metric. Now, here is a chart that shows the trend in the NVT Golden Cross over the last couple of years:

Bitcoin NVT Golden Cross

As you can see in the above graph, the quant has marked the “overbought” and “oversold” regions in the Bitcoin NVT Golden Cross. Whenever this metric has a value of more than 2.2, it means the crypto might be overpriced right now. The coin has usually observed a bearish effect when the indicator has been in this region, as the chart displays.

The “underpriced” condition occurs in the zone where the BTC NVT Golden Cross has values less than -1.6. In the image, there is also the chart for the “supply adjusted dormancy,” an indicator that tells us whether long-term holders are selling or not currently.

It seems like the LTHs have been possibly participating in a large degree of selling recently. This metric has an influence on the NVT Golden Cross, which has also risen in the last few weeks. The indicator is now in the overbought region, which suggests Bitcoin may soon be seeing some bearish volatility.

BTC Price

At the time of writing, Bitcoin’s price floats around $17k, down 2% in the last week. Over the past month, the digital asset has gained 1% in value. The chart below shows the trend in the price of the coin over the last five days.

Bitcoin Price Chart

Bitcoin 7-Day Volatility Comes Alive As FTX Collapse Shakes Market

Data shows the Bitcoin 7-day volatility has come alive during the last week as the collapse of crypto exchange FTX has shaken up the market.

Bitcoin 7-Day Volatility Has Spiked To Values Above 7%

According to the latest weekly report from Arcane Research, the current 7-day volatility levels are the second highest seen in this year.

The “volatility” is an indicator that keeps track of the average daily returns in the price of Bitcoin over a specific period of time.

While this timespan can be of any length, the “7-day” and “30-day” versions of the metric are the most natural.

A notable feature of the volatility indicator is that it only measures returns using the closing prices on each day. This implies that any intraday market movements aren’t accounted for by the metric, so as long as the price returns to the norm by the end of the day.

When the volatility has a high value, it means the price of the crypto has fluctuated a lot recently. On the other hand, low values suggest the BTC market has been displaying stale activity.

Now, here is a chart that shows the trend in the Bitcoin 7-day and 30-day volatilities over the past year:

Bitcoin Volatility

Looks like the values of the metrics have spiked up in recent days | Source: Arcane Research’s Ahead of the Curve – November 15

As you can see in the above graph, both the 7-day and 30-day versions of the Bitcoin volatility have observed a sharp increase recently.

Before this rise, the indicator had very low values for a month or so, with the 7-day version especially reaching historical lows of 1%.

The collapse of FTX and the resulting market crash is behind the crypto’s sudden turn to volatile nature during the last week.

The 7-day volatility has surged above the 7% mark, reaching levels only behind the yearly high of June, when 3AC went bankrupt.

Historically, Bitcoin has become calmer following big spikes in the volatility like the one being observed right now.

However, the report notes that the current market environment is filled with contagion-related uncertainty and abnormal positioning in derivatives, so the market will likely continue to be volatile in the coming days.

BTC Price

At the time of writing, Bitcoin’s price floats around $16.7k, down 5% in the last week. Over the past month, the crypto has lost 12% in value.

The below chart shows the trend in BTC’s price over the last five days.

Bitcoin Price Chart

The value of the crypto seems to still be consolidating around $16.7k | Source: BTCUSD on TradingView
Featured image from Jievani Weerasinghe on Unsplash.com, charts from TradingView.com, Arcane Research

Amid Macro Uncertainty, Bitcoin Stabilizes. Incredible October Stats Inside

The world is upside down. Is bitcoin stable now? Or is everything else extremely volatile all of a sudden? As the planet descends into chaos, bitcoin remains in a weird limbo that’s uncharacteristic of the asset and doesn’t seem to end. That’s both what it feels like and what the stats say. In the latest ARK Invest’s The Bitcoin Monthly report, they put it like this, “bitcoin finds itself in a tug of war between oversold on-chain conditions and a chaotic macro environment.”

What about the numbers, though? The stats support the thesis, “for the third month in a row, bitcoin continues to trade between support at its investor cost basis ($18,814) and resistance at its 200- week moving average ($23,460).” Three months in that range seems like too much. Something’s got to give. However, that’s what everyone’s been thinking for the last few months and we’re still here. 

The Dollar Milkshake Theory

Bitcoin has been less-volatile than usual, sure, but the main factor here is that the whole world is falling to pieces. Every company is in the red, especially techy ones, and all of the world’s currencies except the dollar fell off a cliff. Are we seeing “the dollar milkshake theory” playing out in front of our own eyes? It sure feels that way. Global central banks have been printing bills like there’s no tomorrow, and that extra liquidity is there for the stronger currency to take.

According to professional investor Darren Winter, the “dollar milkshake theory views central bank liquidity as the milkshake and when Fed’s policy transitions from easing to tightening they are exchanging a metaphoric syringe for a big straw sucking liquidity from global markets.” If that’s what we’re seeing, what happens next? Back to The Bitcoin Monthly, ARK says:

“As macro uncertainty and USD strength have increased, foreign currency pairs have been impacted negatively while bitcoin has been relatively stable. Bitcoin’s 30-day realized volatility is nearly equivalent to that of the GBP and EUR for the first time since October 2016”

BTCUSD price chart for 11/07/2022 - TradingView

BTC price chart for 11/07/2022 on Bitstamp | Source: BTC/USD on TradingView.com

Bitcoin Vs. Other Assets In October

The macro-environment has been so bad lately, that there’s the perception that bitcoin has been doing better than stocks. The facts are that, for the first time since 2020, “bitcoin’s 30-day volatility is on par with the Nasdaq’s and the S&P 500’s.” And, we know past performance doesn’t guarantee future results, but “the last time bitcoin’s volatility declined and equaled the rising volatility of equitiy indices was in late 2018 and early 2019, preceding bullish moves in the BTC price.”

However, let’s not kid ourselves, bitcoin has not been doing good. The thing is, not much is prospering out there. Especially in the tech sector. “The price drawdowns from alltime high in Meta (-75.87%) and Netflix (-76.38) have exceeded that of bitcoin’s (-74.46%). To a lesser extent, Amazon also suggests a correction proportional to that of BTC’s “usual” volatility (-48.05%).”

According to The Bitcoin Monthly, the situation “suggests the severity of the macroeconomic environment and bitcoin’s resilience against it.”

The only constant is change, however. Bitcoin’s stability suggests a violent breakout, either up or down. The entire world can’t remain the red forever, something or someone has got to rise above the crowd and show everyone how it’s done. We’ve been waiting for a resolution for what feels like ages, and we’ll probably have to wait some more. There will be a movement, though. When we least expect it, probably.

Featured Image: Bitcoin 3D logo from The Bitcoin Monthly | Charts by TradingView

Bitcoin Rally Fails To Budge 30-Day Volatility As It Stays At 2-Year Lows

Data shows the latest Bitcoin rally has failed to make the 30-day volatility budge, as the metric has remained at 2-year lows.

Bitcoin 30-Day Volatility Currently Has A Value Of Just 1.7%

As per the latest report released by Arcane Research, BTC’s price stabilizing around $20.5k has resulted in the daily volatility remaining low.

The “daily volatility” is an indicator that measures the percentage changes in the daily closing price of Bitcoin averaged over a specific period of time.

While this timespan can be of any length, the 7-day and 30-day volatilities are the most common and useful version of the metric.

When the daily volatility has a high value, it means the crypto’s price has been observing large fluctuations recently.

On the other hand, low values of the indicator suggest that the market has been stale during recent days.

Now, here is a chart that shows the trend in the Bitcoin weekly and monthly volatilities over the past year:

Bitcoin Daily Volatility

The value of the two metrics seems to have been pretty low in recent weeks | Source: Arcane Research’s Ahead of the Curve – Nov 1, 2022

As you can see in the above graph, the 7-day Bitcoin volatility has been at a low level for a while now, and the 30-day version of the metric has also plunged down recently.

The 7-day volatility has actually slightly gone up in the last week as a result of the rally, reaching a value of 2.2%. This is, however, still notably lower than the 3.1% yearly average of the indicator.

After the monthly volatility’s recent decline, the metric has hit around 1.7%, a low level not seen since two years ago. The reason for such low values of this indicator is the endless consolidation that the crypto observed around the $19k level.

While there has been some burst of activity recently, it hasn’t been enough to make a dent on this timescale.

Another contributing factor is that since the initial chaotic increase, Bitcoin has once again fallen back to sideways movement, this time around the $20.5k level. This is why the 7-day volatility, though higher than before, is still historically low.

BTC Price

At the time of writing, Bitcoin’s price floats around $20.4k, down 1% in the last week. Over the past month, the crypto has gained 6% in value.

The below chart shows the trend in the price of the coin over the last five days.

Bitcoin Price Chart

Looks like the value of the crypto has so far held above the $20k mark | Source: BTCUSD on TradingView
Featured image from Jievani Weerasinghe on Unsplash.com, charts from TradingView.com, Arcane Research

Fed Could Hike Interest Rates By 75 BPS, Here’s What It Means For Bitcoin

The FOMC meeting is currently looming above the financial markets, including bitcoin, given that it is just a few days away. Previous interest rate hike trends and the fact that inflation remains a prominent threat have led to a negative outlook for the FOMC meeting. It is expected that another Fed interest rate hike is on the horizon, which will no doubt have a profound effect on the crypto market.

FOMC Meeting Draws Near

The next FOMC meeting will take place on November 1-2 according to the official schedule. It happens around once every one to two months and is important as this is where the Fed decides what to do in regard to the economy and keeping it healthy.

Unlike the previous years, 2022 has been a very hard year, not just for the United States economy, but for economies all around the world. Inflation rates have been reaching levels not seen in decades and the Fed has had to tighten up its policy in response to this.

Interest rate hikes have been the norm for the last couple of months, in most cases, coming in higher in most cases than expected. This time around, Wu Blockchain has said that the expected interest rate hike is 75 BPS, with an 81% probability of this happening. If it does play out this way, then this would be the fourth consecutive interest rate hike of 75 bps by the Fed, which could have negative consequences for assets in the crypto space such as Bitcoin.

How Will Bitcoin Respond?

The past performances of bitcoin in relation to interest rate hikes by the Fed can often be a guide for what to expect in the future. If the current prediction for another 75 bps turns out to be right, then it will be an extremely volatile week for bitcoin and the crypto market.

Bitcoin price chart from TradingView.com

BTC continues to trend upward | Source: BTCUSD on TradingView.com

Back in September when the Fed had last increased interest rates, the price of bitcoin had responded quite negatively. In fact, it would prove to be the most volatile reaction to the FOMC meeting given that BTC’s price had dropped more than 5% in one minute. This was going off a three consecutive interest rate hike.

Another interest rate hike this week is expected to lead to even larger volatility in the market. This will also coincide with the profit-taking that is currently ongoing due to bitcoin’s recovery above $20,000. It could be the last straw that drags the digital asset back below $20,000 once more.

However, the interest rate hikes are not expected to continue indefinitely. It is likely that 2023 is going to see a reversal in this trend, which would present a growth opportunity for risk assets such as biotin. 

Featured image from Coinews, chart from TradingView.com

Follow Best Owie on Twitter for market insights, updates, and the occasional funny tweet…

Bitcoin Volatility Falls To Lowest Since Post-COVID Rebound

Data shows the daily Bitcoin volatility has declined further this week, reaching very low levels not observed in around two years.

Bitcoin 30-Day Volatility Has Come Down To Just 1.9% In Recent Days

As per the latest weekly report from Arcane Research, the 7-day volatility made a low below the 1% mark earlier in the week.

The “daily volatility” is an indicator that measures how the per day returns of Bitcoin have differed from the average during a specific period.

While this period can be of any length, two versions of the metric are particularly natural, the 7-day volatility and the 30-day volatility.

Now, here is a chart that shows the trend in these daily Bitcoin volatilities, as well as the daily returns in the price of the crypto, over the past year.

Looks like the values of the two metrics have been quite low in recent days | Source: Arcane Research’s The Weekly Update 41, 2022

As you can see in the above graph, the Bitcoin volatility has been trending down during the last few weeks as the price of the coin has been stuck in consolidation.

The 7-day version of the indicator breached below the 1% level just recently, before forming a low there and rebounding back to the current 1.1% level.

This bottom was the lowest level that the metric has seen since the July of 2020, around when the rebound following the COVID crash took place.

The 30-day Bitcoin volatility is also at a historically low level at the moment as the indicator’s value is just 1.9% right now.

The report notes that while these volatility values suggest a completely stale price recently, it has also been true that the crypto has seen some intraday activity, which the indicator doesn’t account for as it only takes the daily closing prices.

The price of Bitcoin fluctuated by almost 9% in 12 hours on Thursday as the US CPI release went live. But this price change was almost entirely gone by the time the daily close happened.

Historically, periods of very low volatility such as now have been succeeded by those of violent price movement. It now remains to be seen whether BTC observes a similar trend this time as well or not.

BTC Price

At the time of writing, Bitcoin’s price floats around $19.1k, up 4% in the last week. Over the past month, the crypto has lost 2% in value.

The below chart shows the trend in the BTC price over the last five days.

The value of the crypto seems to have continued to consolidate during the last few days | Source: BTCUSD on TradingView
Featured image from Dmitry Demidko on Unsplash.com, charts from TradingView.com, Arcane Research

Bitcoin Volatility Index Suggests Large Price Move Arriving Soon

Historical data of the Bitcoin volatility index hints that the price of the crypto may observe a big move in the near future.

Bitcoin Volatility Index Has Recently Been Below A Value Of 25

As pointed out by an economist on Twitter, the volatility index has declined into a zone that has historically been followed by an explosive move in BTC.

The “volatility index” in question is the BitMEX .BVOL index, and according to the exchange, the metric’s value “is the rolling 30 day annualized volatility of the daily 11:30 UTC to 12:00 UTC Time Weighted Average Price (TWAP) of Bitcoin / USD.”

Here, the Time Weighted Average Price is calculated using measurements made at 1 minute intervals for a period of half-an-hour.

What this index tells us is how much has the recent BTC price deviated from the average, or more simply, how volatile it has been recently.

High values of the metric suggest the crypto has shown some sharp moves recently, while low ones imply a stale market.

Now, below is a chart that shows how the Bitcoin volatility index’s value has changed during the last few years:

The value of the metric seems to have been quite low in recent days | Source: Alex Krüger on Twitter

As you can see in the graph, the analyst has marked relevant points of trend between the Bitcoin volatility index and the price of the crypto.

It looks like whenever the indicator has dipped below a value of 25, and then subsequently bottomed below the level, the BTC price has seen some significant moves that have made the metric’s value shoot right up.

There have been three instances of this trend during the last few years, two of which involved the price making a bullish move, while the third one a crash.

From the chart, it’s apparent that the Bitcoin volatility index has once again dropped down into this historical zone as the current BVOL value stands at around 24.59.

If the same trend as during the previous instances follows now as well, then the crypto might be heading towards another big move in the near future.

BTC Price

At the time of writing, Bitcoin’s price floats around $19.4k, up 1% in the last seven days. Over the past month, the crypto has lost 9% in value.

The below chart shows the trend in the price of the coin over the last five days.

Looks like the value of the crypto has mostly been moving sideways during the last few days | Source: BTCUSD on TradingView
Featured image from Kanchanara on Unsplash.com, charts from TradingView.com

Bitcoin Leverage Ratio Hits New ATH, Market In For A Rough Ride?

On-chain data shows the Bitcoin leverage ratio has surged up to a new all-time high, suggesting the market could be heading towards high volatility.

Bitcoin All Exchanges Estimated Leverage Ratio Sets New ATH

As pointed out by a CryptoQuant post, the funding rate has remained neutral while the leverage has increased in the market.

The “all exchanges estimated leverage ratio” is an indicator that measures the ratio between the Bitcoin open interest and the derivative exchange reserve.

What this metric tells us is the average amount of leverage currently being used by investors in the BTC futures market.

When the value of this indicator is high, it means users are taking a lot of leverage right now. Historically, such values have led to higher volatility in the price of the crypto.

On the other hand, the value of the metric being low suggests investors aren’t taking high risk at the moment, as they haven’t used much leverage.

Now, here is a chart that shows the trend in the Bitcoin leverage ratio over the last few years:

Looks like the value of the metric has been rising up during the last few months | Source: CryptoQuant

As you can see in the above graph, the Bitcoin estimated leverage ratio has shot up recently and has attained a new ATH. This means that investors are taking a high amount of leverage on average.

The reason overleveraged markets have usually turned highly volatile in the past lies in the fact that such conditions lead to mass liquidations becoming more probable.

Any sudden swings in the price during periods of high leverage can lead to a lot of contracts getting liquidated at once. But it doesn’t end there; these liquidations further amplify the price move that created them, and hence cause even more liquidations.

Liquidations cascading together in such a way is called a “squeeze.” Such events can involve either longs or shorts.

The Bitcoin funding rates (the periodic fee exchanged between long and short traders) can give us an idea about which direction a possible squeeze may go in.

CryptoQuant notes that this metric has a neutral value currently, implying the market is equally divided between shorts and longs. As such, it’s hard to say anything about the direction a possible squeeze in the near future might lean towards.

The Bitcoin volatility has in fact been very low in recent weeks, but with such high accumulation of leverage, it may be a matter of time before a volatile price takes over.

BTC Price

At the time of writing, Bitcoin’s price floats around $19.6k, up 2% in the past week.

The BTC value continues to trend sideways | Source: BTCUSD on TradingView
Featured image from Kanchanara on Unsplash.com, charts from TradingView.com, CryptoQuant.com

Calm Before The Storm? Bitcoin Volatility At Historically Low Levels

Data shows the Bitcoin 7-day volatility has plunged down recently to pretty low values. Here’s what has historically happened following instances of such a trend.

Bitcoin 7-Day Volatility Has Declined To Just 1.6% In The Past Week

According to the latest weekly report from Arcane Research, the recent sideways trend in the BTC price has lead to the volatility dropping down to very low values.

The “volatility” is an indicator that measures how the daily returns of Bitcoin have deviated from the average during a specific period.

Here is a chart that shows the trend in the 7-day and 30-day versions of the metric for BTC over the last year:

The 7-day value of the indicator seems to have gone down in recent days | Source: Arcane Research’s The Weekly Update – Week 39, 2022

As you can see in the above graph, the 7-day Bitcoin volatility has plummeted down over the past week or so.

The metric’s value is now only 1.6%, a very low level that has only been seen a few times during the last twelve months. The 30-day volatility, though, has still stayed up recently at about 3.4%.

The reason behind such low weekly values of the indicator is the sideways consolidation between the $19k and $20k levels that the crypto’s price has been stuck in lately.

Such low 7-day volatility values have usually been succeeded by significant surges in the metric, as noted by the report.

This happens because leverage easily builds up during these periods. High leverage markets are highly volatile since any sudden price moves can liquidate large amounts, which further amplifies the price change.

Since low volatility periods obviously don’t have any significant price spikes, leverage can go unflushed and thus pile up.

As the Bitcoin 7-day volatility has been very low recently, this kind of buildup is again expected to take place in the market. And indeed, the BTC-denominated perpetual futures open interest has shot up and is sitting at an all-time high right now, supporting the idea of the market being overleveraged:

Looks like the value of the metric has been climbing up recently | Source: Arcane Research’s The Weekly Update – Week 39, 2022
BTC Price

At the time of writing, Bitcoin’s price floats around $20.1k, up 3% in the last week. Over the past month, the crypto has gained 1% in value.

The below chart shows the trend in the price of the coin over the last five days.

The value of the crypto has been moving sideways since the surge a couple of days back | Source: BTCUSD on TradingView
Featured image from Kanchanara on Unsplash.com, charts from TradingView.com, Arcane Research

Prepare For Volatility: Data Suggests Bitcoin Gets Chaotic During FOMC Meetings

Bitcoin and other cryptocurrencies in the market have had an interesting week-and-a-half. From the CPI report to the completion of the Ethereum Merge, it has been a rollercoaster of volatile activity across the market. Even with this, the market is still not done with its big events. The FOMC meeting is held on Wednesday, which, like in the past, promises unpredictable movements for the crypto markets.

Expect Volatility For Bitcoin

The FOMC meeting has always triggered volatility across not just the crypto markets but various financial markets. Bitcoin’s reaction to the FOMC meeting has also gotten more prominent with the increased correlation with the stock and macro markets. Given this, any FOMC meeting is expected to have a significant impact on the crypto market. 

This is no different from the FOMC meeting that is happening on Tuesday. Previously, the FOMC meeting hours have been very volatile in the space as the market awaits the results of the meeting. As such, it is expected that Wednesday will see a lot of volatility, especially during meeting hours. More specifically, volatility is expected to hit its peak between 17:00-21:00 UTC as had been observed during previous meetings.

Volatility expected during FOMC meeting | Source: Arcane Research

Naturally, bitcoin’s price will respond to the equity indexes during this time and will tend to move in tandem with it. So while investors keep an eye on the crypto market, it will be prudent to also keep an eye on the macro markets during this time as well.

High Swings In Crypto

The reaction of bitcoin and other cryptocurrencies can vary during this time but the wild swings are to be expected. This time around, the volatility is also expected to be very high because there is uncertainty across the markets regarding if there will be further rate hikes or not.

It actually gives an idea of the importance of the FOMC meeting to different financial markets and now the crypto market, as it becomes a larger contender. Presently, there are reports of an expected rate hike of 100bps. The market has reacted to this by pricing a 20% chance of such a hike.

BTC remains below $20,000 | Source: BTCUSD on TradingView.com

Interestingly, the volatility from the FOMC meeting does not seem to last beyond the end of the meeting. In some cases, it has lasted a few hours more, but by the next day, the volatility usually settles and normalizes.

So, in the end, the volatility from this meeting does not command much relevance over a longer period of time. It often acts as a clue for traders regarding how trades should be constructed during this time. If rate hikes continue though, bitcoin’s price may break below $18,000 for the second time this year.

Featured image from Yahoo Money, charts from Arcane Research and TradingView.com

Follow Best Owie on Twitter for market insights, updates, and the occasional funny tweet…

Bitcoin Open Interest Climbs Up, Price To Break Sideways Trend Soon?

On-chain data shows the Bitcoin open interest has been slowly growing recently, something that could lead to more volatility in the price of the crypto.

Bitcoin Open Interest Goes Up While Funding Rates Approach A Neutral Value

As pointed out by an analyst in a CryptoQuant post, the BTC open interest has gained around $500 million over the last few days.

The “open interest” is an indicator that measures the total amount of BTCUSD positions currently open on all derivatives exchanges. The metric takes into account for both short and long positions.

When the value of this indicator goes up, it means investors are opening up more positions on exchanges right now. Since this usually leads to a higher amount of leverage in the market, this kind of trend can make the price of Bitcoin more volatile.

On the other hand, the decline in the metric implies positions are closing up or liquidating on exchanges at the moment. Lower leverage usually leads to a more stable value of the crypto, and so such a trend can result in lesser volatility for BTC.

Now, here is a chart that shows the trend in the Bitcoin open interest over the last few days:

The value of the metric seems to have climbed up in recent days | Source: CryptoQuant

As you can see in the above graph, the Bitcoin open interest has observed an uplift during the past couple of days.

This increase amounted to around $500 million and took the indicator’s value from $8.15 billion to $8.66 billion.

The chart also includes data for the “funding rates,” a metric that tells us about the distribution of BTC positions between longs and shorts.

This indicator has most recently had a slightly negative value, which means the market is slightly leaning towards a short-dominant environment right now.

In times of high open interest (and hence high leverage), the market becomes more prone to seeing largescale liquidation events. Such liquidations are the reason behind the increased volatility of the market during such periods.

BTC has been mostly moving sideways during the last few days, but since the open interest has jumped up now, it’s possible the crypto could see fresh movement soon.

The funding rates can hint at which direction this new price volatility may favor, but since the metric’s value is almost neutral currently, it’s hard to say anything.

At the time of writing, Bitcoin’s price floats around $19.7k, down 1% in the past week.

BTC has continued to consolidate sideways during the past week or so | Source: BTCUSD on TradingView
Featured image from Kanchanara on Unsplash.com, charts from TradingView.com, CryptoQuant.com

Bitcoin Derivatives Reserve Surges Up, More Volatility Soon?

On-chain data shows the Bitcoin derivatives exchange reserve has surged up recently, a sign that the crypto may face more volatility in the near future.

Bitcoin Derivatives Exchange Reserve Observes Uplift Over Last Two Days

As pointed out by an analyst in a CryptoQuant post, conditions seem to be brewing up in the BTC market that could lead to higher volatility in the price.

The “derivatives exchange reserve” is an indicator that measures the total amount of Bitcoin currently sitting in the wallets of all derivatives exchanges.

When the value of this metric goes up, it means investors are depositing their coins into these exchanges right now. Since BTC going up on derivatives generally leads to an increase in leverage, such a trend can result in higher volatility in the price of the crypto.

On the other hand, the value of the indicator registering a decline implies coins are exiting derivatives exchanges as holders are withdrawing them. This kind of trend may precede a more calmer BTC price.

Now, here is a chart that shows the trend in the Bitcoin derivatives exchange reserve over the past few weeks:

The value of the metric seems to have climbed up in recent days | Source: CryptoQuant

As you can see in the above graph, the Bitcoin derivatives exchange reserve has seen some upwards momentum during the last couple of days. This shows that leverage in the market is now going up.

The chart also includes data for the mean value of the BTC transaction fees (in USD), and it looks like this metric also saw a spike during the past day, suggesting there have been some big moves in the market.

Below is another graph, this time including the trend for the BTC funding rates:

The funding rates have gone up over the past day | Source: CryptoQuant

As is apparent from the chart, the funding rates have jumped into positive values with this increase in the derivatives reserve.

This means that the investors sending coins to these exchanges have opened up long contracts, thus shifting the market balance into a long-dominant environment.

In the past, the combination of positive funding rates along with high derivatives reserve has usually meant high near term volatility for Bitcoin, with the price generally falling down.

BTC Price

At the time of writing, Bitcoin’s price floats around $20k, down 8% in the past week.

Looks like the value of the crypto has been moving sideways during the last few days | Source: BTCUSD on TradingView
Featured image from Yiğit Ali Atasoy on Unsplash.com, charts from TradingView.com, CryptoQuant.com