Bitcoin Trader Selling Pressure Declining, CryptoQuant Head Explains Why

The head of research at the on-chain analytics firm CryptoQuant has explained why selling pressure from Bitcoin traders may be declining.

Bitcoin Short-Term Holder Realized Price Has Risen To $60,000

In a new post on X, CryptoQuant head of research Julio Moreno has discussed why the short-term holder selling pressure may be declining for BTC. The “short-term holders” (STHs) refer to the Bitcoin investors who have been holding onto their coins since less than 155 days ago.

The STHs include the “traders” of the market who make many moves within short periods and don’t tend to HODL their coins. This group can be quite reactive to market movements, easily panic selling whenever a crash or rally takes place.

Generally, investors in profits are more likely to sell their coins, so one way to gauge whether the STHs would be likely to take part in a selloff is through their profit/loss margin.

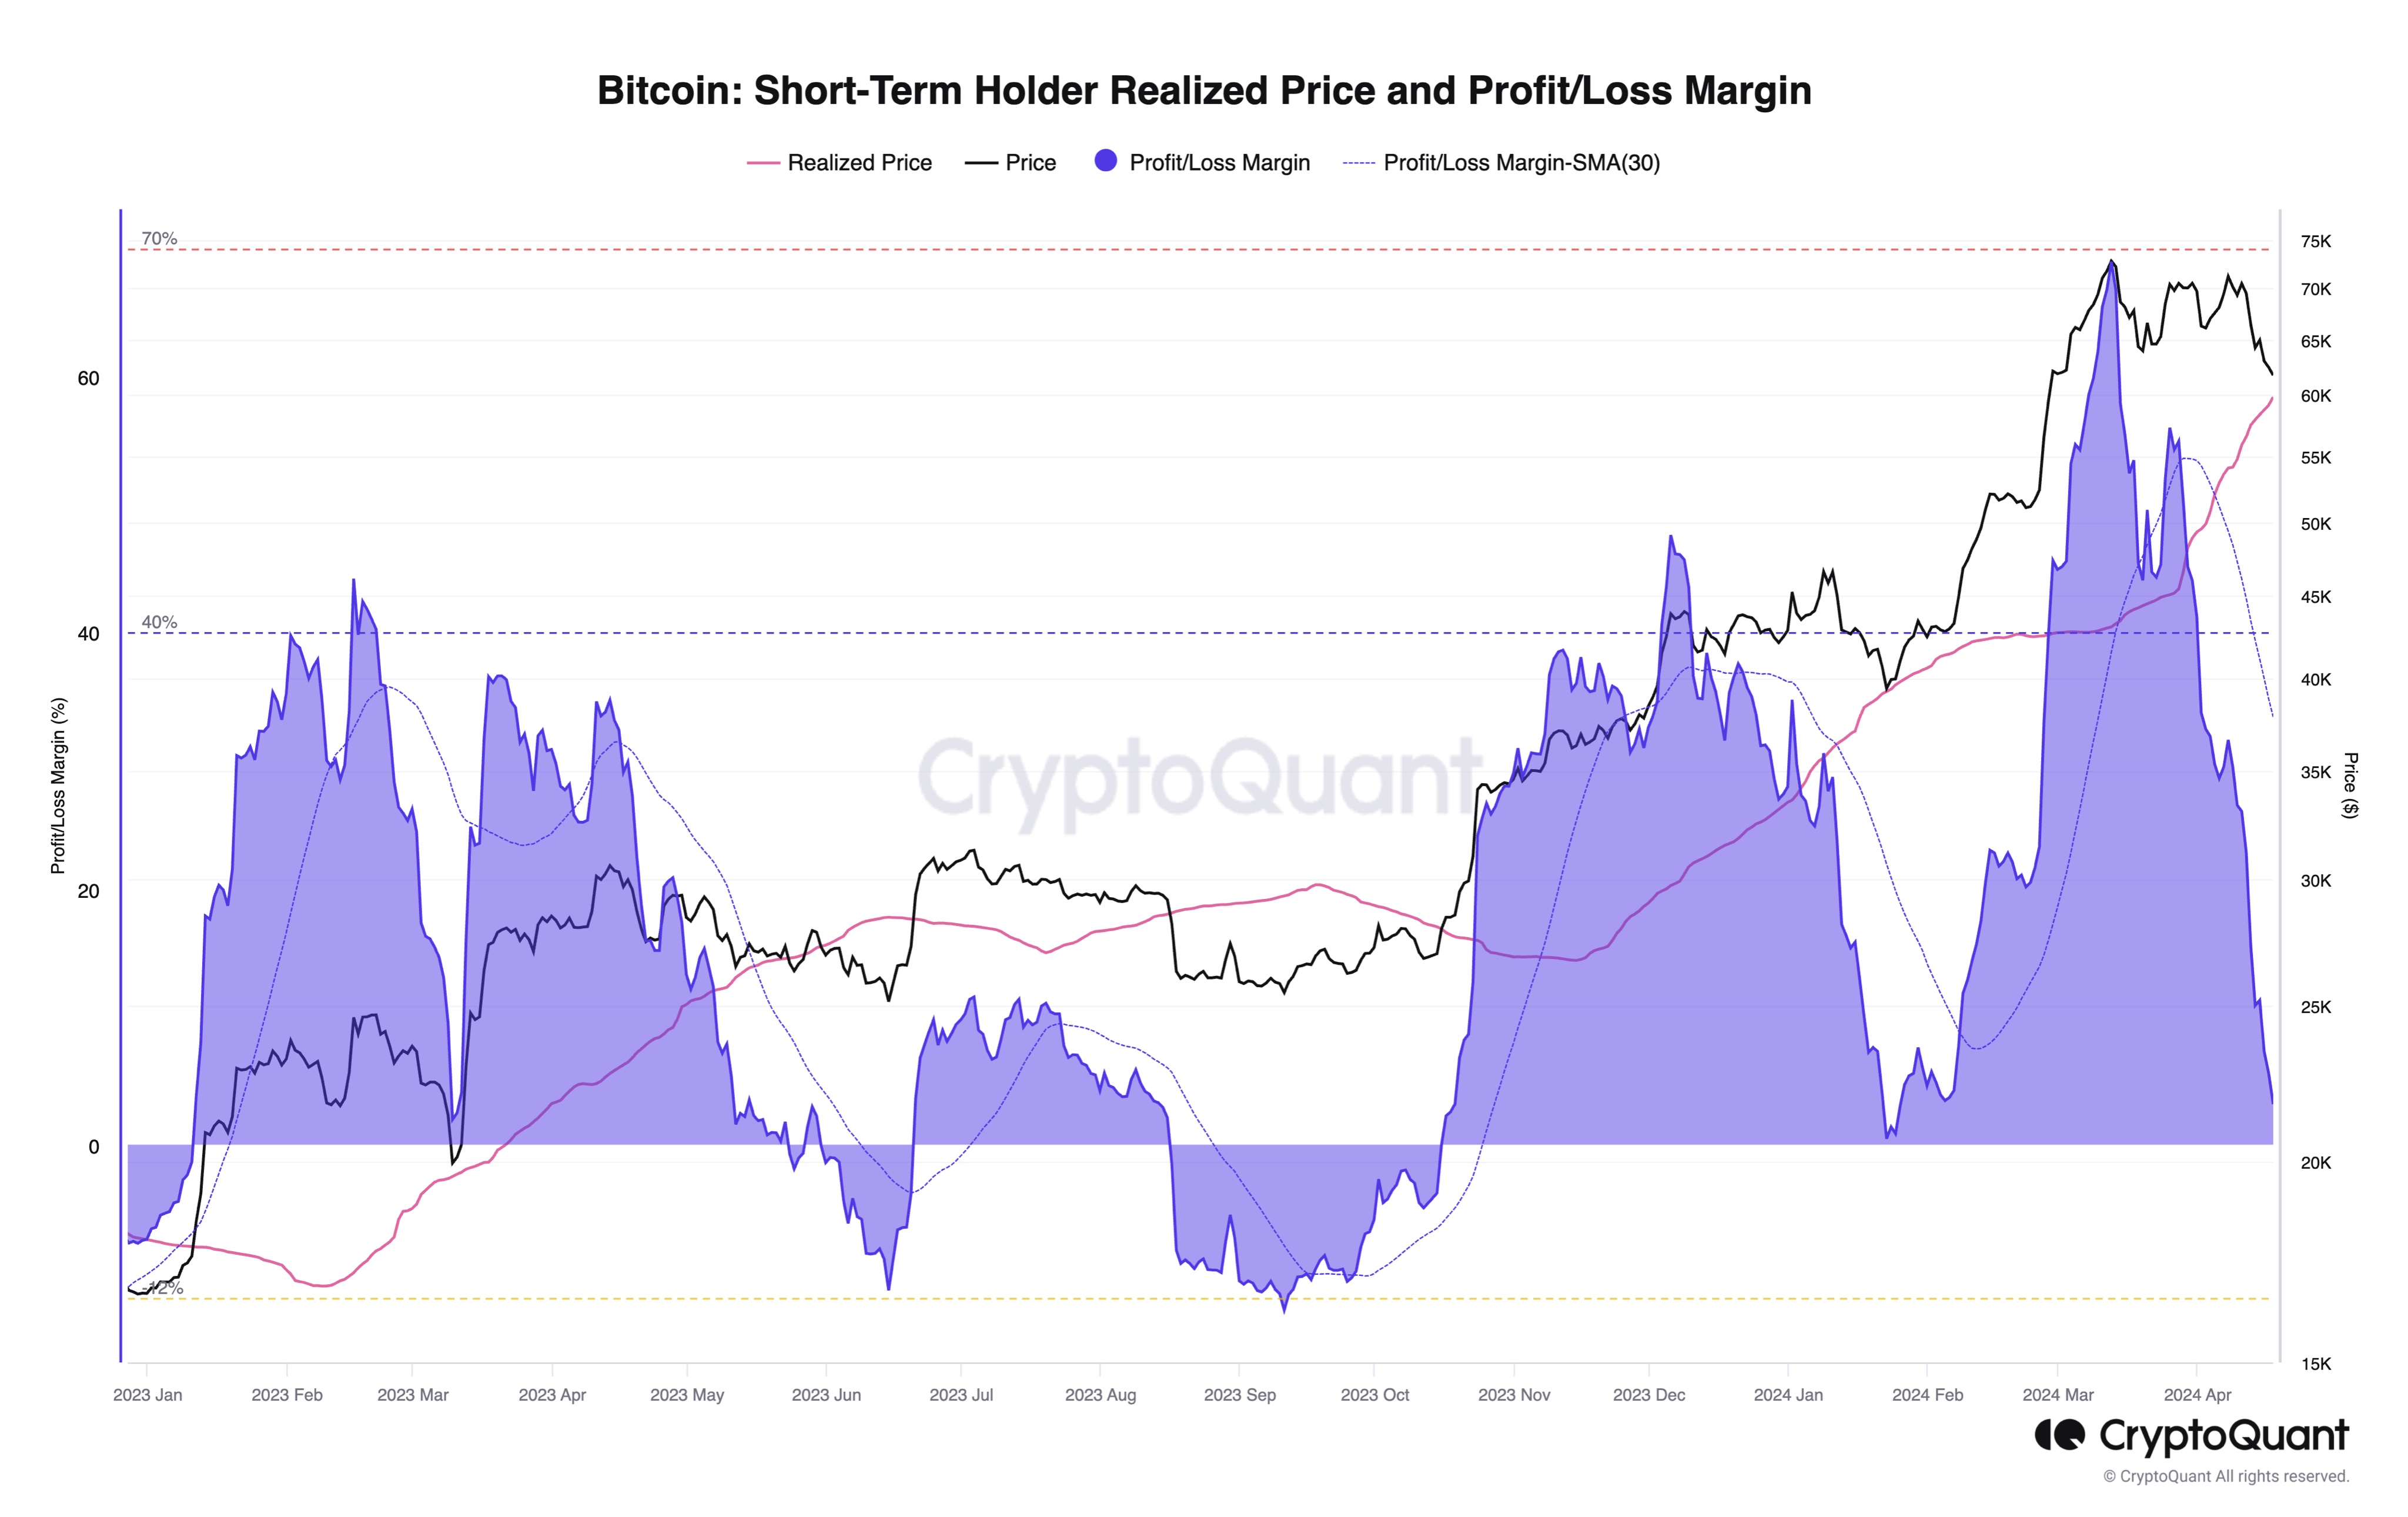
Here, Moreno has cited the profit/loss margin of this cohort based on its realized price.

Bitcoin STH Realized Price

The STH realized price (highlighted in pink) here refers to the average cost basis or acquisition price of the investors part of this cohort calculated using blockchain transaction history.

When the spot value of the cryptocurrency is above this level, it means that these holders as a whole are sitting on some net profits right now. On the other hand, the price being below the metric implies the dominance of losses.

From the above chart, it’s visible that Bitcoin has been above the STH realized price for the last few months, meaning that these traders have been enjoying profits.

This is typical during bull markets as the price keeps pushing up, letting these investors make profits. While STHs tend to stay in the green in these periods, tops do become probable to take place if these profits get extreme.

As is apparent in the graph, the profit/loss margin spiked to significant levels just as BTC set its latest all-time high, which continues to be the top thus far.

Recently, as Bitcoin has consolidated between the $60,000 to $70,000 range, the STH realized price has rapidly risen, now attaining a value of around $60,000. This occurs because as STHs have traded in this range, their acquisition prices have been repriced at these higher levels, thus pushing up the average.

BTC has been quite close to this level recently so that the STHs wouldn’t be holding that much profit now. “Bitcoin selling pressure from traders may be declining as unrealized profit margins are basically zero now,” notes the CryptoQuant head.

BTC Price

Bitcoin has continued to show action contained within its recent range as its price is still trading around $65,200.
Bitcoin Price Chart

Bitcoin Halving: Anticipating Price Impact, Miner Challenges, And Long-Term Outlook

The highly anticipated Bitcoin Halving event is close, bringing with it heightened expectations regarding the long-term impact on the Bitcoin price. 

There are concerns, however, that this quadrennial event may already be priced in, as Bitcoin recently reached an unprecedented all-time high of $73,700 on March 14.

This surge broke the pattern of previous Halvings, where Bitcoin had never surpassed its previous ATH before the event. However, historical data reveals significant price increases in the year following previous Halvings.

Experts Predict Delayed Bitcoin Halving Price Impact

Analysts argue that the compounding impact of reduced issuance takes several months to materialize, suggesting that the Halving itself may not prompt a significant rally before or immediately after the event. 

Deutsche Bank analysts share this sentiment, highlighting that substantial price increases have typically occurred in the run-up to previous Halvings rather than immediately after them.

Another factor to consider is the increased production costs for Bitcoin miners resulting from the Halving. As the mining reward decreases, participating in the mining process becomes less profitable. 

This has historically led to a decline in the hashrate, the total computational power used for Bitcoin mining. JPMorgan analysts predict that production costs could rise to an average of $42,000 after the Halving.

One JPMorgan analyst wrote, “This estimate is also the level we envisage Bitcoin prices drifting towards once Bitcoin-Halving-induced euphoria subsides after April.”

While these factors may influence short-term price movement, historical data reveals that the price of Bitcoin has experienced significant increases in the year following previous Halvings. 

The respective price gains for the three previous halvings were 8,760%, 2,570%, and 594%. However, it’s important to note that each successive halving has a diminishing impact on the new supply of Bitcoin.

Mining Industry Shake-Up

In the mining sector, Halving could lead to significant revenue losses, estimated to be around $10 billion annually. 

According to Fortune, publicly traded miners have taken measures to increase their resilience, diversify their offerings, and optimize their operations. However, mining stocks have faced challenges, with some experiencing significant declines.

While larger miners may undergo a period of adjustment, smaller miners and pools may be pushed offline. This could result in a wider market share for the surviving miners. 

Experts at private asset management firm Bernstein expect the mining industry to consolidate, with “smaller and less efficient players” potentially selling assets to raise capital and shore up their balance sheets. 

The increased market dominance of the surviving miners is expected to be profitable over the long term, especially with the continued structural demand for Bitcoin from ETFs.

Timing The Bitcoin Bull Market Peak

Cryptocurrency analyst Rekt Capital has provided insights into the potential timing of Bitcoin’s bull market peak based on historical Halving cycles and the current acceleration seen in the market. 

According to Rekt Capital, Bitcoin has traditionally reached its peak in the bull market approximately 518-546 days after the Halving event.

However, the current cycle has shown signs of unprecedented acceleration, with Bitcoin surpassing previous all-time highs roughly 260 days ahead of historical norms. Nonetheless, the recent “pre-Halving retrace” has slowed down the cycle by around 30 days and counting.

Taking into account this accelerated perspective, if Bitcoin’s bull market peak is measured from the moment it breaks its old all-time high, it may occur 266-315 days later. As Bitcoin achieved new all-time highs in March, this suggests a potential bull market peak in December 2024 or February 2025, according to Rekt’s analysis.

Both perspectives carry significance throughout the cycle, especially if the acceleration trend persists. However, prolonged retracements or consolidation periods can slow down the cycle, potentially pushing the anticipated bull market peak further into the future.

Bitcoin Halving

At the time of writing, BTC was trading at $64,300, up from the $59,000 mark reached in the early hours of Friday.

Featured image from Shutterstock, chart from TradingView.com 

Bitcoin Accumulation: You Won’t Believe How Much BTC Holders Have Bought Since The Crash

Bitcoin holders have again reaffirmed their faith in the flagship crypto despite its recent price declines. This follows recent data showing that Bitcoin accumulation addresses recorded a new all-time high (ATH) amidst the current market downward trend. 

Accumulation Addresses Record New All-Time High Of Bitcoin Inflows

Data from the on-chain analytics platform CryptoQuant shows that over 27,700 BTC was transferred into accumulation addresses between April 16 and 17. This is a new all-time high (ATH) for these addresses in terms of their daily Bitcoin inflows. 

Before now, the highest amount of BTC sent to these addresses in a day stood at 25,500, recorded on March 23 earlier this year. Interestingly, the March 23 record came just about a month after Bitcoin inflows into accumulation addresses hit an all-time high (ATH) of 25,300 BTC on February 21. 

Accumulation addresses are wallets with no outgoing transactions and have a balance of over 10 BTC. Accounts belonging to centralized exchanges and Bitcoin Miners are excluded from this category. Meanwhile, these addresses must have received two incoming transactions, with the most recent occurring within the last seven years. 

These addresses can be considered the most bullish on Bitcoin, and the growing accumulation trend from these wallets shows how much faith these long-term holders have in the flagship crypto. Furthermore, they are also believed to be positioning themselves ahead of the bull run, as BTC may never drop to these price levels once it comes into full force. 

Meanwhile, CryptoQuant’s CEO, Ki Young Ju, also highlighted the significance of this development, noting that on-chain accumulation has remained “very active” even as the demand for Spot Bitcoin ETFs has stagnated for four weeks. This suggests that Bitcoin bulls could help shore up the demand gap left open by these ETFs. 

BTC Price Shows Strength

Bitcoin dropped below the $60,000 support level following reports about Israel’s retaliatory attack on Iran. However, the flagship crypto showed strength as it quickly rebounded above the $60,000 price mark. This is significant considering how much Bitcoin and the broader crypto market declined rapidly following Iran’s attack against Israel on April 13. 

Furthermore, the quick price recovery also suggests that Bitcoin has established strong support around the $60,000 price range and could be set for a parabolic move to the upside once this period of consolidation is over. Crypto analyst Crypto Rover also recently commented on Bitcoin’s future trajectory, stating that the crypto token will come out with a “banger” soon enough.

At the time of writing, Bitcoin is trading at around $62,000, up in the last 24 hours according to data from CoinMarketCap. 

Bitcoin price chart from Tradingview.com

Crypto Expert Predicts A Narrative Shift Post-Bitcoin Halving

Crypto expert Michaël van de Poppe has provided insights into what to expect when the Bitcoin halving occurs on April 19. As part of his analysis, van de Poppe suggested that the attention might shift from Bitcoin once the event occurs. 

A Narrative Shift To Occur Post-Halving

Van de Poppe mentioned in an X (formerly Twitter) post that narratives will change as the halving event approaches but failed to specify what the new narrative will be when this happens. However, in a previous X post, the crypto expert laid out some of his expectations for the crypto market going forward, which included what he expected the new narrative to be. 

According to Van de Poppe, the narrative will shift to Ethereum (ETH) and projects that are focused on Decentralized Physical Infrastructure Networks (DePIN) and Real World Assets (RWA). These sectors, along with Artificial Intelligence (AI) and meme coins, have been projected to be among the leading narratives in this bull run. 

Meanwhile, the crypto expert, who has so far continued to state that altcoins are greatly undervalued, expects these crypto tokens to bounce “in their Bitcoin pairs” once the hype around the halving is over. Furthermore, Van de Poppe mentioned that altcoins will show bullish strength from this second quarter until the summer after which a correction will come in the third quarter of the year.

Before now, the crypto expert listed ten altcoins he believes could make the most price gains when the altcoin season begins in full force. These tokens include Chainlink (LINK), Celestia (TIA), Arbitrum (ARB), Polkadot (DOT), Cosmos (ATOM), DYDX (DYDX), WooNetwork (WOO), Sei (SEI), Skale Network (SKL), and Covalent (CQT). 

Expectations For Bitcoin

In the short term, Van de Poppe expects Bitcoin to experience a relief bounce to around $70,000. However, he didn’t sound so bullish about the flagship crypto’s long-term trajectory, predicting that Bitcoin will face a period of consolidation that he doesn’t expect to change in the “coming months.”

In another X post, he said, “It’s a waiting game on Bitcoin currently, as momentum is relatively gone.” He added that he expects Bitcoin to continue “the retracement and consolidation,” while altcoins will bounce up in their BTC pairs during this period. 

This predicted consolidation period looks to be the re-accumulation phase in the stages of Bitcoin halving, which crypto analyst Rekt Capital once referred to. Elaborating on what this period is like, Rekt Capital stated back then that many investors get “shaken out in this stage due to boredom, impatience, and disappointment with lack of major results in their BTC investment in the immediate aftermath of the Halving.”

Once this period is over, Bitcoin is expected to make its “parabolic uptrend,” a phase that Rekt Capital noted historically lasts just over a year. In line with this, it is worth noting that most of Bitcoin’s price gains usually come between six months to a year after the Bitcoin halving has occurred. 

Bitcoin price chart from Tradingview.com

Bitcoin Halving Could Catalyzed $100,000 Price Surge: Bitwise CEO

As the cryptocurrency community excitedly awaits the impending Bitcoin halving, Bitwise Chief Executive Officer (CEO) Hunter Horsley has weighed in on its impact on BTC, predicting that the event could potentially propel prices to $100,000 or even higher.

Horsley expressed his optimistic outlook toward the upcoming Bitcoin Halving on the X (formerly Twitter) platform. Every four years, the Halving has historically been linked to greater price increases, and Horsley’s upbeat view indicates that this cycle might be no different from the others.

Upcoming Bitcoin Halving Is Being Underestimated

According to the CEO, the much-anticipated event is presently being significantly underestimated in the crypto space. He claims that the market has never priced in it in the past, and it will not be priced in this time either, expressing his confidence toward the occasion.

Horsley highlighted the historical relevance and transformative implications of these occurrences, drawing comparisons with past Halvings and citing the notable profits that investors achieved in 2020, 2016, and 2012. He stated that following months of debate by investors on whether the previous three halvings were priced in, Bitcoin grew by 5.4x, 2.8x, and 88x, respectively.

Given the past price developments, the Bitwise CEO anticipates this Halving to serve as a catalyst for the $100,000 target for BTC. Horsley’s prediction seems very reasonable since the figure is just about a 47% increase from the digital asset’s current price.

It is worth noting that the opinions of fully deployed current holders are not used to measure the impact of the Halving. Rather, it depends on whether there will be a significant and sustained increase in demand in addition to the daily decrease in the supply of natural sellers. 

In all, the Bitwise CEO foresees a steady growth in demand along with the conditions for a substantial Halving event this year. As investors prepare for the possible impact of this historic occasion on Bitcoin’s price trajectory, this audacious prognosis highlights the possibility of massive price increases not only in BTC but the entire cryptocurrency market.

BTC Move Into No Man’s Land

With the Halving less than 24 hours away, Cold Blooded Shiller, a cryptocurrency analyst, has reported that Bitcoin has entered No Man’s Land. “There are some interesting discussion points on BTC right now, but we have just entered No Man’s Land,” he stated.

According to Shiller, until one of the two green zones highlighted in his chart is contacted, he believes the price action is far more unpredictable. Nonetheless, there are some interesting links here for former price action and Relative Strength Index (RSI).

The analyst claimed the RSI is currently resetting on the Higher Time Frame (HTF), and the last time it occurred was back in January, following a similar breakdown from consolidation seen now.

While Shiller does not think the results will be the same this time, it’s quite reasonable if no recovery happens due to this degree of loss.

Bitcoin

Bitcoin Price Still At Risk of Major Downside Break Below $60K

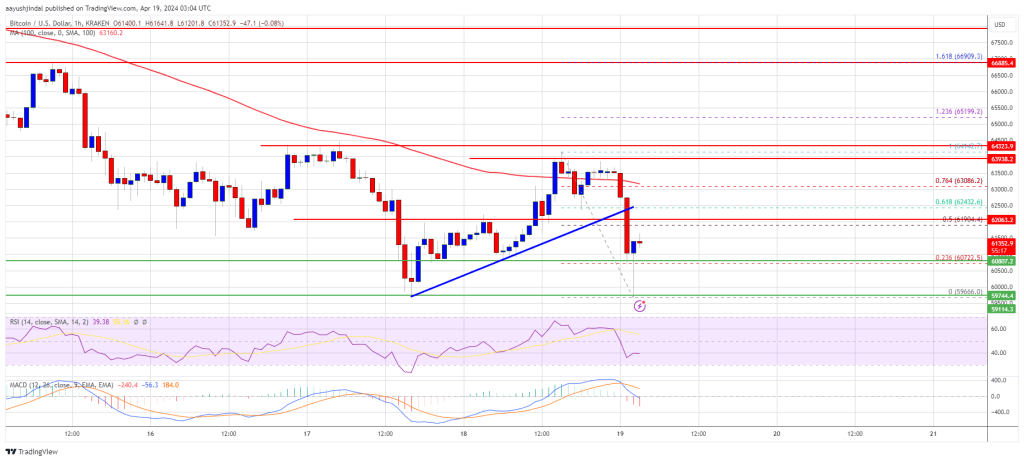
Bitcoin price is showing bearish signs below the $63,000 resistance zone. BTC must stay above the $60,000 support zone to avoid a major decline.

  • Bitcoin is still struggling to start a recovery wave above the $63,000 resistance zone.
  • The price is trading below $62,800 and the 100 hourly Simple moving average.
  • There was a break below a connecting bullish trend line with support at $62,400 on the hourly chart of the BTC/USD pair (data feed from Kraken).
  • The pair could gain bearish momentum if it settles below the $60,000 support zone.

Bitcoin Price Struggle Continues

Bitcoin price started another increase above the $61,500 resistance zone. BTC cleared the $62,500 and $63,000 resistance levels. It even spiked above $64,000 but failed to surpass the key level at $65,000.

A high was formed at $64,142 before there was a sharp decline. There was a break below a connecting bullish trend line with support at $62,400 on the hourly chart of the BTC/USD pair. It dived below the $60,800 level and retested $59,650.

A low was formed near $59,666 and the price is now attempting a fresh recovery wave. The price climbed above the 23.6% Fib retracement level of the recent decline from the $64,142 swing high to the $59,666 low.

Bitcoin price is trading below $62,800 and the 100 hourly Simple moving average. Immediate resistance is near the $62,000 level. It is close to the 50% Fib retracement level of the recent decline from the $64,142 swing high to the $59,666 low.

The first major resistance could be $63,000. The next resistance now sits at $64,200. If there is a clear move above the $64,200 resistance zone, the price could continue to move up. In the stated case, the price could rise toward $65,000.

Bitcoin Price

Source: BTCUSD on TradingView.com

The next major resistance is near the $66,500 zone. Any more gains might send Bitcoin toward the $67,500 resistance zone in the near term.

More Losses In BTC?

If Bitcoin fails to rise above the $62,000 resistance zone, it could start another decline. Immediate support on the downside is near the $60,800 level.

The first major support is $60,000. If there is a close below $60,000, the price could start to drop toward the $59,550 level. Any more losses might send the price toward the $58,500 support zone in the near term.

Technical indicators:

Hourly MACD – The MACD is now gaining pace in the bearish zone.

Hourly RSI (Relative Strength Index) – The RSI for BTC/USD is now below the 50 level.

Major Support Levels – $60,800, followed by $60,000.

Major Resistance Levels – $62,000, $63,000, and $64,200.

Bitcoin Miners Always Sell Into Halvings, Is This Time Any Different?

On-chain data shows Bitcoin miners have always sold as Halvings have occurred. With the next one just around the corner, how are miners behaving this time?

Next Bitcoin Halving Is Less Than Two Days Away Now

In a CryptoQuant Quicktake post, an analyst discussed Bitcoin miners’ behavior in the build-up to the next Halving.

The “Halving” is a periodic event on the Bitcoin network where the cryptocurrency’s block rewards (the compensation miners receive for solving blocks) are permanently slashed in half.

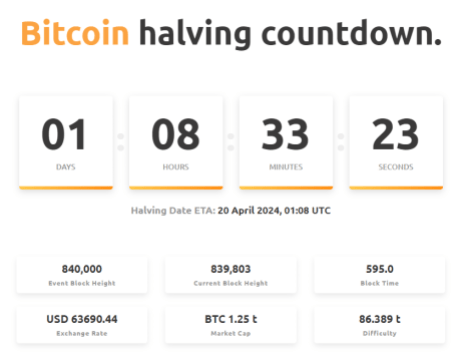
This event occurs approximately every four years, and according to NiceHash’s countdown, the next one will occur in just over 32 hours.

Bitcoin Halving

Bitcoin miners earn revenue from two sources: transaction fees and block rewards. Historically, the former has been quite low on the BTC network, so the miners primarily depend on the latter to pay off their running costs.

Since the block rewards are cut in half during Halvings, these events naturally deal a significant blow to the miner’s revenues. As such, it’s not surprising that the miners have generally shown a reaction to the event in the past cycles.

“One of the common dynamics that occur in every cycle of cutting the issuance of new BTC is the significant selling pressure exerted by miners,” says the quant. One way to gauge the degree of selling pressure coming from these chain validators is via the Miner to Exchange Flow metric.

This indicator tracks the total amount of Bitcoin moving from miner-associated addresses to wallets connected to centralized exchanges. As miners usually deposit Bitcoin to these platforms for selling, this flow can provide hints about their selling behavior.

Now, here is a chart that shows the trend in the 30-day moving average (MA) BTC Miner to Exchange Flow over the last few years:

Bitcoin Miner to Exchange Flow

As displayed in the above graph, the 30-day MA Bitcoin Miner to Exchange Flow had surged to high levels in the 2020 Halving event, implying that this group had potentially been participating in a selloff.

This selling push may have come from the miners planning to exit, given the sharp revenue reduction that was set to occur. The graph, though, clearly shows that no such selling pressure has emerged this time around despite the event being just around the corner.

So, what’s going on here? The analyst suggests that the Bitcoin miners may have already completed the latest round of selling in advance (as the exchange inflows from the cohort did spike in February). If this is true, the quant thinks this could benefit the market in the short term.

BTC Price

Bitcoin has continued to move sideways inside a range recently, as its price is still trading around $63,500.

Bitcoin Price Chart

Goldman Sachs On Bitcoin Halving: ‘It doesn’t Matter If It’s A Buy The Rumor, Sell The News Event’

Analysts at Goldman Sachs, a leading global banking and investment management firm, have offered valuable insights into the anticipated effects of the forthcoming Bitcoin halving, on the price of the cryptocurrency. They emphasize that while the Bitcoin halving is a noteworthy event, other major factors will likely exert greater influence on Bitcoin’s future value. 

Bitcoin Halving To Play Lesser Role In BTC’s Outlook

In a note to clients, Goldman Sach’s analysts have cautioned against reading too much into the past Bitcoin halving cycles and their impact on the cryptocurrency. Based on historical trends, the Bitcoin halving cycles tend to have a favorable effect on the value of Bitcoin, often triggering a bull run

The bank noted that whether the Bitcoin halving scheduled for April 20, becomes a “buy the rumor, sell the news event,” it would hold less significance for the cryptocurrency’s medium-term outlook.

They argue that the future performance of the pioneer cryptocurrency would be more heavily influenced by the supply and demand dynamics within the current market. Additionally, the analysts highlighted that the growing interest and demand for Spot Bitcoin Exchange Traded Funds (ETFs) combined with the self-reflexive nature of the crypto market would be the primary contributing factor to Bitcoin’s price action and future outlook. 

Sharing a similar perspective, analysts at CryptoQuant disclosed earlier in April that the 2024 Bitcoin halving was no longer a primary catalyst for Bitcoin’s bullish surge. They highlighted that factors such as increasing demand from large-scale investors and diminishing supply were now the key drivers of Bitcoin’s upward momentum.  

Analysts Warn Of Macroeconomic Influence On New Halving Cycle

Analysts at Goldman Sachs have predicted that macroeconomic factors such as inflation could have a significant influence on the upcoming Bitcoin halving event. 

“Caution should be taken against extrapolating the past cycles and the impact of halving, given the respective prevailing macro conditions,” Goldman Sachs analysts noted.

Unlike previous halving cycles, the present economic conditions display high inflationary pressures and interest rates, which could cause the 2024 Bitcoin halving cycle to diverge from historical patterns. In other words, the analysts have suggested that for Bitcoin’s historical halving bull runs to occur, macro conditions need to be supportive of investor risk-taking. 

Currently, the United States faces challenges with high inflation, while interest rates stand above 5%. These conditions may exert pressure on Bitcoin’s market dynamics. However, despite the prevailing circumstances, many see the digital currency as a formidable inflation hedge and a beacon of hope against escalating inflationary pressures.

Bitcoin price chart from Tradingview.com

Here’s What Would Happen If The Bitcoin Price Fell Below $58,000

Crypto analyst Crypto Rover has provided insights into what could happen if the Bitcoin price drops below $58,000. The flagship crypto has continued to suffer price declines lately and risks dropping to that price level if it manages to break the crucial $60,000 support level

What A Drop Below $58,000 Would Mean For The Bitcoin Price

Rover mentioned in a video on his YouTube channel that Bitcoin dropping below $58,000 would mean a breakdown for the flagship crypto token. He, however, quickly added that there’s still a lot of liquidity in the market, which he believes Bitcoin can take in and help drive its price back above $60,000 if the drop below $58,000 happens. 

He sounded optimistic about Bitcoin’s quick recovery if it dropped below $58,000. He revealed that he would not close his positions but rather open millions of dollars long positions if the flagship crypto dropped between $57,000 and $60,000.

Meanwhile, Crypto Rover revealed that Bitcoin is still in the middle of a “gigantic and enormous consolidation phase” and that Bitcoin will have a “massive breakout” when this consolidation period ends. For now, he highlighted that Bitcoin’s top side is still trending downwards while Bitcoin’s low side is trending upwards. 

Therefore, Crypto Rover claimed this is causing a “compression” in Bitcoin’s price. However, once this compression ends, Bitcoin will come out with a “banger,” the analyst added. Crypto Rover then alluded to the funding rates, which are currently negative. He noted that historically speaking, negative or low funding rates are always a Bitcoin buying opportunity

The Big Gains Are Yet To Come For BTC

Crypto Rover also noted that the majority of Bitcoin’s gains always come after the Bitcoin halving and not before. As such, despite the crypto token rising to a new all-time high (ATH) before the halving, the analyst asserted that “what we have seen so far is nothing for what we are about to be getting.”

He suggested that the halving event would be the catalyst for Bitcoin’s rise to $100,000, mainly because it would create more scarcity. This would undoubtedly help increase Bitcoin’s value, especially if its demand continues to skyrocket. However, such a price surge might not come immediately, considering that Bitcoin’s price tends to increase 6 to 12 months after the halving. 

Hannah Phung, a lead analyst at on-chain analytics platform SpotOnChain, also recently made that observation, although she admitted that things could be different this time around, as this market cycle looks to be more different and mature than past ones. 

At the time of writing, Bitcoin is trading at around $60.900, down almost 5% in the last 24 hours, according to data from CoinMarketCap.

Bitcoin price chart from Tradingview.com

Bitcoin To $455,000: Expert Echoes Previous Halving Pattern

In the ever-evolving world of cryptocurrency, Marcel Knobloch also known as Collin Brown, a crypto expert has offered an audacious prediction for Bitcoin, foreseeing a significant rally to unprecedented heights post-BTC Halving event scheduled to take happen this month.

Bitcoin Poised For Massive Growth Post-Halving

According to Collin Brown, the fourth mining reward Halving for Bitcoin will take place in the next 48 hours. This event will cut down the current 6.25 BTC per block output to 3.125 BTC per block.

Brown noted that following the last Halving event, Bitcoin witnessed over 700% growth, bringing the crypto asset to its previous all-time high of $69,000 achieved at the peak of the 2021 bull cycle. Given the impact of the previous Halving, the crypto expert has predicted the coin will reach $455,000 should BTC mirror this pattern.

The post read:

In just forty-eight hours, Bitcoin’s fourth mining reward halving will occur. This quadrennial occurrence will slash the per-block emission of BTC to 3.125 BTC from the current 6.25 BTC. After the last halving, Bitcoin prices surged 700%, which would now bring $455,000.

It is worth noting that since the cryptic developer of Bitcoin, Satoshi Nakamoto, introduced the coin about 15 years ago, the Halving has been ingrained in the crypto’s program. This year’s event will happen when block 840,000 is created, which might increase BTC’s value by reducing supply.

Historically, the three previous halvings have caused the price of the digital asset to soar significantly, amassing substantial gains. Data shared by Brown shows that following the first halving event, Bitcoin saw a whopping 9,360% rise, topping out around $1,135 from $12.

However, it took the crypto asset approximately 371 days to reach the aforementioned figure after the Halving. Furthermore, the second halving, which occurred in 2016, drove Bitcoin’s price from $650 to $19,640, indicating an over 2,920% increase.

Meanwhile, the last instance secured a 700% rally, taking prices from $8,626 to the previous peak of $69,045. Primarily, it took BTC more than 500 days in the preceding two cycles to reach new records.

Considering the past trends, Brown’s forecast appears to be reasonable and possible. Should any of these trends reoccur, the crypto expert’s prediction might manifest in the following year.

BTC On The Downside

Collin Brown remains optimistic despite Bitcoin showing signs of weakness to retest its new all-time high of $73,000. Since reaching its new peak in mid-March, the value of BTC has plummeted by over 10%.

Today, the price of Bitcoin fell sharply, reaching a low of about $60,000 and reaching its lowest level since late February. At the time of writing, BTC was trading at $62,916, down more than 10% over the past week. While its trading volume has increased by over 20%, its market cap is slightly down by 0.20% in the last day.

The decline in BTC’s price is considered to be triggered by recent geopolitical tensions or global turmoil. The conflict between Israel and Iran caused major sell-offs among investors, leading to a broader market downturn.

Bitcoin

Here’s The Bitcoin Whale Who Dumped $1 Billion In BTC On Binance

Bitcoin has seen its price suffer from the tremendous selling pressure that has filled the market over the last few weeks. However, as investors hope for relief, it seems that the sellers are far from done, with one notable Bitcoin sell transaction in particular sending the market into a frenzy.

Whale Dumps $1 Billion Worth Of Bitcoin

Whale tracker Whale Alert took to X (formerly Twitter) to inform the crypto community of a large Bitcoin transaction that was participating in the sell-off. The transaction was carrying a total of 16,276 BTC which was worth around $1 billion at the time that the transaction was carried out.

While large transactions are not out of the ordinary, their destination is often the determinant of whether it is a bearish or bullish transaction. In cases where the coins are headed away from centralized exchanges and into personal wallets, it can be bullish because this often means that the investors are consolidating their coins into personal private storage and don’t plan on selling.

However, in cases where coins are being transferred to centralized exchanges, it can be very bearish since it often means that investors are looking to sell their coins. This was the case with the $1 billion Bitcoin transaction, as the 16,276 BTC were transferred to the Binance exchange.

Naturally, the transaction caused a stir among investors who contemplated the impact that such a large sell-off could have on the price of the cryptocurrency. However, the origin of the transaction would be revealed soon after, and prices would stabilize as a result.

Binance Says 16,276 BTC Transaction Was SAFU Fund Conversion

In the early hours of Thursday, Binance, the largest crypto exchange in the world, took responsibility for the 16,276 BTC transaction that was sent to the exchange. The funds were reportedly from its emergency insurance fund known as the Secure Asset Fund for Users (SAFU) fund.

According to the announcement, the exchange is converting this insurance fund into stable coins to avoid fluctuations in price associated with Bitcoin. Binance explains that it maintains the balance of this fund at $1 billion, which represents an ample level that is enough to safeguard user funds on the exchange.

As to why the exchange chose USDC as its stablecoin of choice, it said, “Making use of a trusted, audited, and transparent stablecoin for SAFU further enhances its reliability and ensures it remains stable at $1B.”

The Bitcoin has since been converted to USDC, and the SAFU wallet maintains a balance of 1 billion USDC.

Bitcoin price chart from Tradingview.com

No Fed Rate Cuts? No Worries For Bitcoin, Says Research Firm

As the US economy grapples with rising inflation expectations and scaled-back forecasts for Federal Reserve rate cuts, the Bitcoin market remains buoyant, according to a detailed analysis by Reflexivity Research. With the US CPI headline inflation projected to accelerate to 4.8% by the November 2024 elections, according to Bank of America, conditions are seemingly unfavorable for a loosening of monetary policy. Despite this, the cryptocurrency sector, particularly Bitcoin, appears insulated and optimistic.

Bitcoin Unfazed By Delayed Rate Cuts?

The bond market now anticipates only three Federal Reserve rate cuts this year, a significant reduction from the earlier forecast of six. The CME FedWatch tool indicates that the majority of market participants do not expect a rate cut to occur before the mid-September FOMC meeting. This adjustment reflects a recalibration of expectations regarding the Fed’s capacity to manage persistent inflation pressures.

Amidst these macroeconomic shifts, Ritik Goyal, in a guest post for Reflexivity Research, presents a compelling analysis in his report titled “The Fed is Unable to Cause a Recession. Risk Assets are Yet to Realize This.”

The report argues that, contrary to conventional wisdom, the Federal Reserve’s rate hikes have had unintended stimulative effects on the economy. Goyal elucidates three specific mechanisms through which this phenomenon operates:

1. Increased Government Interest Payments: “Rate hikes raised interest payments by the government to the private sector,” Goyal notes. As the Fed raises rates, it increases the interest burden on the government, which has borrowed extensively during the post-COVID period. With the federal debt-to-GDP ratio exceeding 120%, the doubled interest payments now effectively act as a stimulus, channeling approximately $1 trillion annually to the private sector

2. Direct Subsidy to Banking System: The Fed’s policy adjustments have also led to a redistribution of wealth within the financial system. “Rate hikes raised the Fed’s direct subsidy to the banking system,” states Goyal. This has occurred as the yield curve inversion resulted in the Fed incurring losses on its balance sheet, losses that directly benefit the banking sector, translating to an estimated $150 billion annual subsidy.

3. Induced Housing Construction Boom: The rate hikes have paradoxically stimulated the housing market. “Rate hikes induced a housing construction boom,” according to Goyal. As higher rates discourage existing homeowners from selling, the only viable option to meet housing demand is new construction, a sector with one of the highest GDP multipliers.

Goyal’s insights underline a critical misalignment in the Fed’s current approach against the backdrop of substantial fiscal interventions since the pandemic. “The traditional monetary policy framework is breaking down under the weight of fiscal dominance,” Goyal concludes, suggesting an environment that could favor non-traditional assets like Bitcoin.

Echoing Goyal’s findings, crypto expert Will Clemente highlighted the broader implications for cryptocurrencies on X (formerly Twitter), stating, “With debt/GDP as high as it is, we’re in a backwards world where high rates mean interest payments on debt are stimmy checks for people that buy assets—~$1T will be paid out in 2024. Big picture is very constructive for the internet coins.”

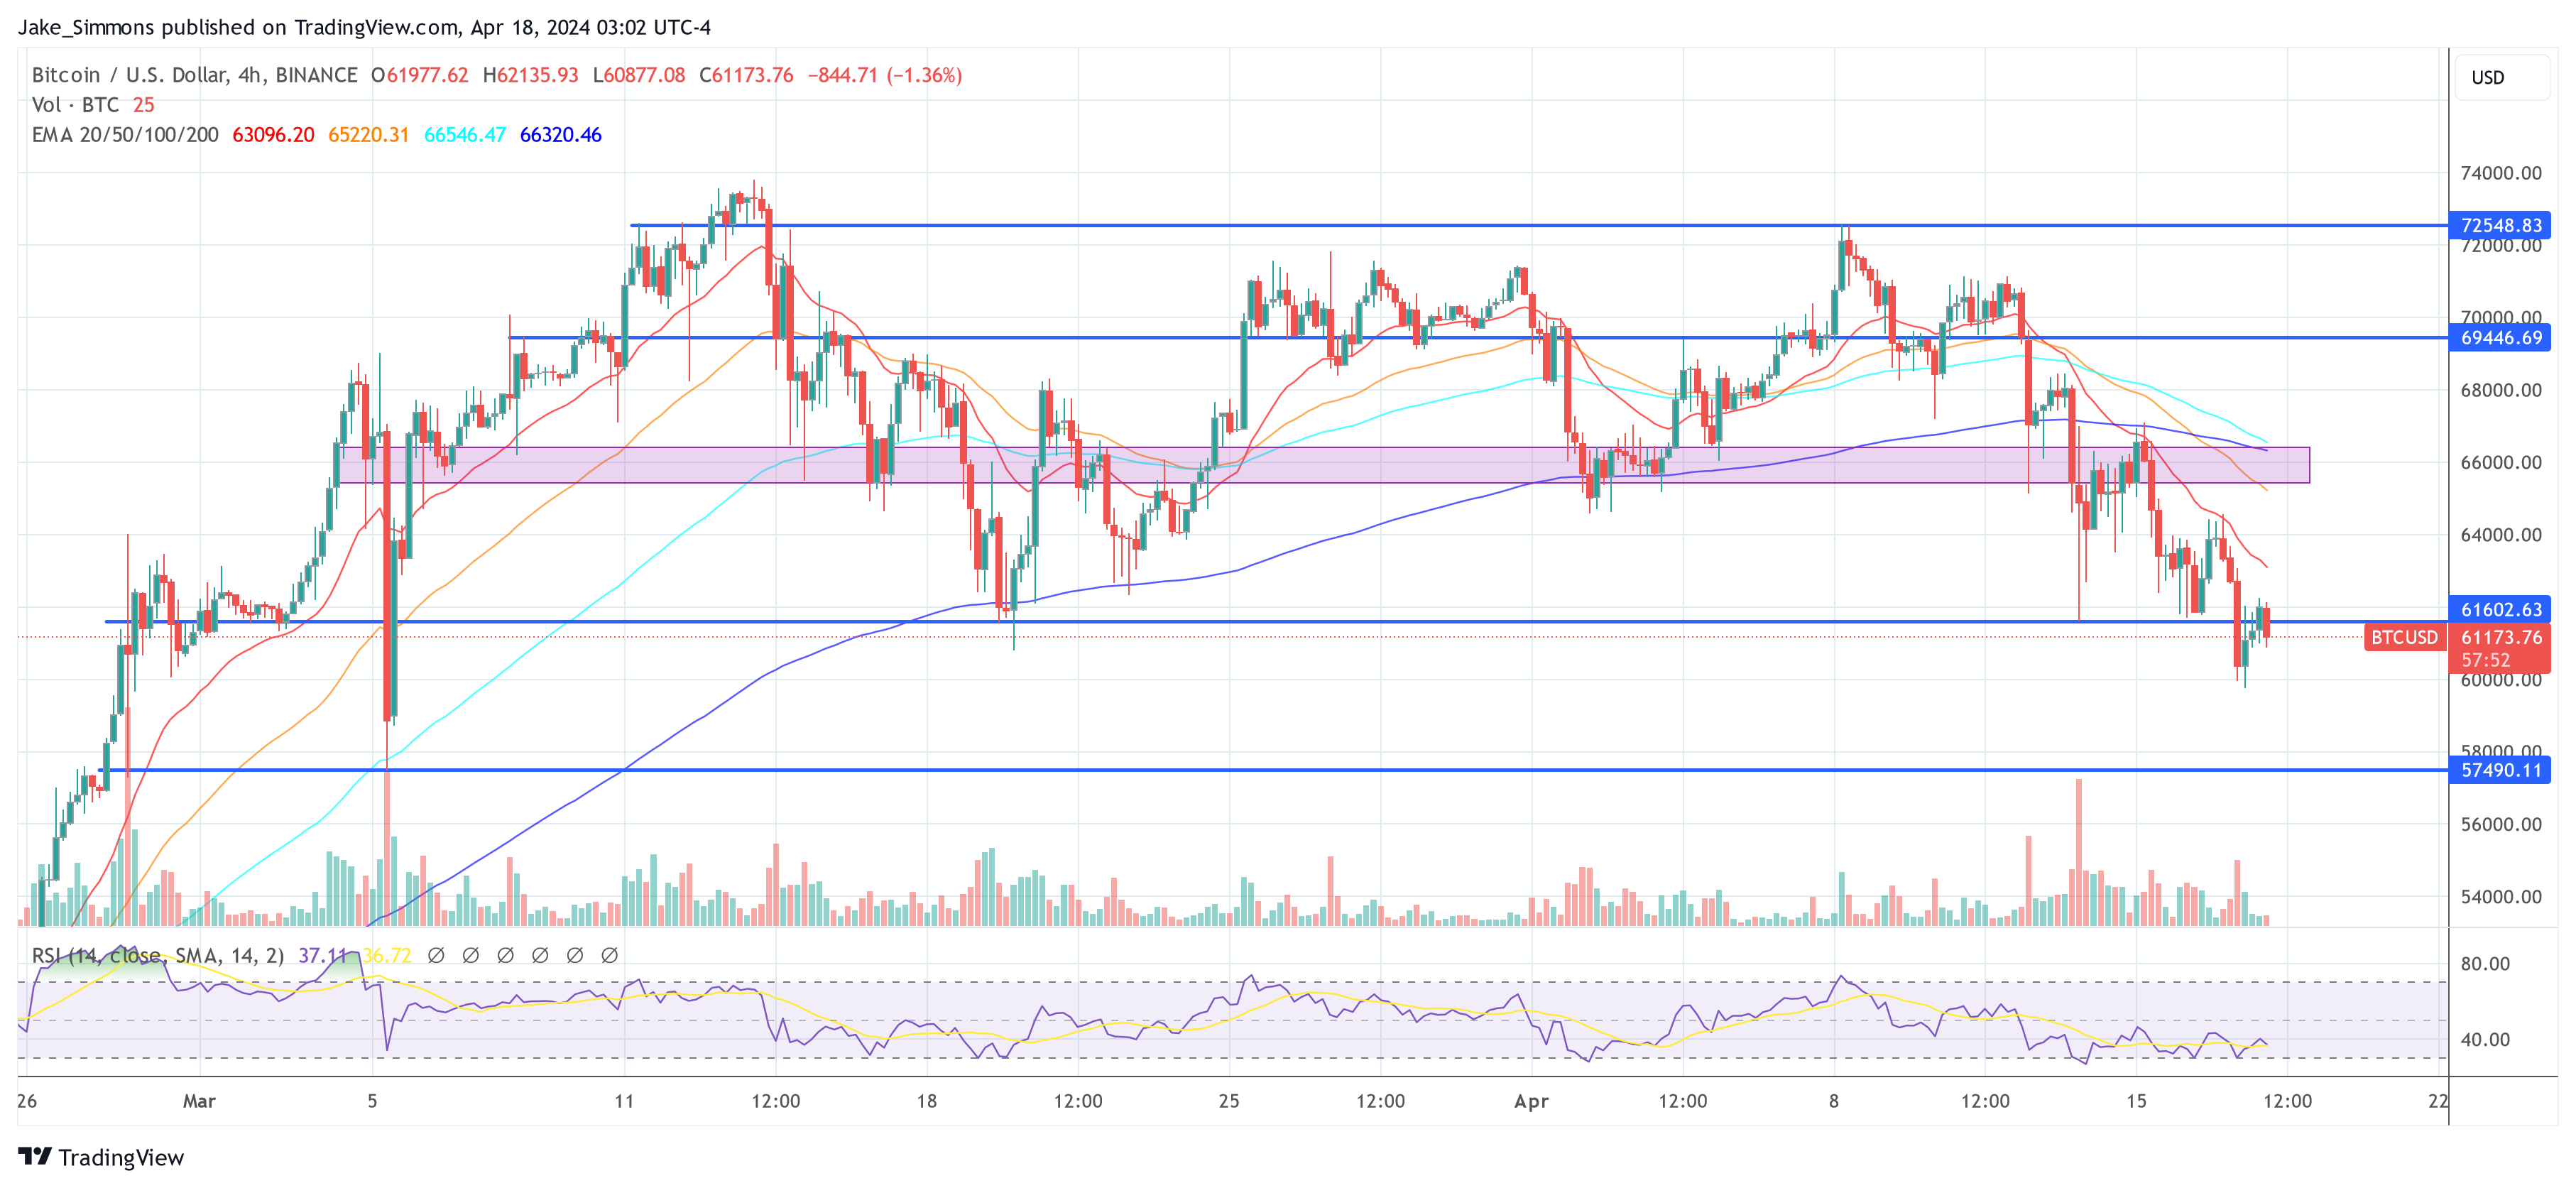
At press time, BTC traded at $61,173.

Bitcoin price

Bitcoin Price At Make-Or-Break Moment, Key Levels To Watch

Bitcoin price is still struggling below the $65,000 resistance zone. BTC must stay above the $60,000 support zone to avoid a major decline.

  • Bitcoin is still struggling to gain pace for a move above the $65,000 resistance zone.
  • The price is trading below $63,000 and the 100 hourly Simple moving average.
  • There is a key bearish trend line forming with resistance at $62,650 on the hourly chart of the BTC/USD pair (data feed from Kraken).
  • The pair could gain bullish momentum if it clears the $63,000 resistance zone.

Bitcoin Price Remains At Risk

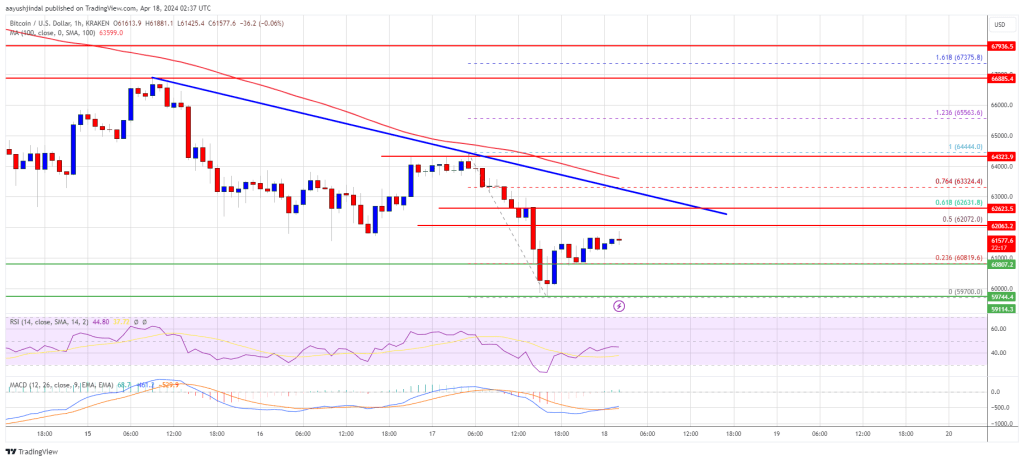
Bitcoin price failed to clear the $64,500 resistance zone. BTC formed a short-term top at $64,450 and started another decline. There was a move below the $63,000 and $62,000 levels.

The price even spiked below the $60,000 level. A low was formed near $59,700 and the price is now attempting a fresh recovery wave. The price climbed above the 23.6% Fib retracement level of the recent decline from the $64,444 swing high to the $59,700 low.

Bitcoin price is trading below $63,000 and the 100 hourly Simple moving average. Immediate resistance is near the $62,000 level. It is close to the 50% Fib retracement level of the recent decline from the $64,444 swing high to the $59,700 low.

The first major resistance could be $62,650 and the trend line. The next resistance now sits at $63,000. If there is a clear move above the $63,000 resistance zone, the price could continue to move up. In the stated case, the price could rise toward $64,500.

Bitcoin Price

Source: BTCUSD on TradingView.com

The next major resistance is near the $65,000 zone. Any more gains might send Bitcoin toward the $66,500 resistance zone in the near term.

More Losses In BTC?

If Bitcoin fails to rise above the $63,000 resistance zone, it could start another decline. Immediate support on the downside is near the $60,800 level.

The first major support is $60,000. If there is a close below $60,000, the price could start to drop toward the $59,200 level. Any more losses might send the price toward the $58,500 support zone in the near term.

Technical indicators:

Hourly MACD – The MACD is now losing pace in the bearish zone.

Hourly RSI (Relative Strength Index) – The RSI for BTC/USD is now below the 50 level.

Major Support Levels – $60,800, followed by $60,000.

Major Resistance Levels – $62,650, $63,000, and $64,500.

Pre-Halving Jitters: Bitcoin Price Briefly Slips Below $60,000

The Bitcoin price has recently experienced heightened volatility, causing the largest cryptocurrency in the market to briefly drop below the significant threshold of $60,000 for the first time since March 5. 

This price decrease comes just days before the highly anticipated Halving event scheduled for Friday. This event has traditionally been viewed as a positive catalyst for Bitcoin’s value due to its impact on token supply. 

However, market participants are questioning whether the Halving’s effects are already factored into the current market conditions, leading to extended bearish sentiment.

Long-Term Bullish Outlook Prevails

Bitcoin’s decline saw it plummet by 5% to $59,890, though it recovered some losses shortly afterward. Since reaching an all-time high (ATH) of $73,700 on March 14, the Bitcoin price has now retraced by approximately 18%. 

The downward trend extended to other major cryptocurrencies, including Ethereum (ETH), Solana (SOL), and Dogecoin (DOGE), which also experienced slumps on Wednesday.

The impending Halving, a quadrennial code update in Bitcoin, has raised concerns among investors as to whether it will be a significant market-moving event or a non-event overshadowed by other factors, such as the ongoing discussions surrounding the Bitcoin ETF market, which has seen a significant decrease in terms of outflows.  

Nathanaël Cohen, co-founder of INDIGO Fund, noted that market participants are de-risking due to this uncertainty and the additional macro factor of tensions in the Middle East involving Israel and Iran, putting further pressure on risk assets.

The recent decline in Bitcoin’s price was further exacerbated by a wave of liquidations in long positions for digital assets. Last Friday alone, approximately $780 million worth of bullish crypto wagers were liquidated within 24 hours. 

Despite the recent market turbulence, some participants maintain a bullish long-term outlook for Bitcoin. Some see the recent liquidations and subsequent flushing out of leverage in the crypto market as a positive development. 

Ravi Doshi, head of markets at FalconX, reported increased buying of longer-dated call options on their derivatives desk, suggesting that clients anticipate higher prices in the latter half of the year.

Bitcoin Price Rebounds Above $61,000

Following the brief dip below the $60,000 mark, the Bitcoin price has rebounded, currently trading at $61,600. This recovery is viewed as a bullish sign, with the cryptocurrency’s macro uptrend structure remaining intact as long as price levels of $51,000 and $42,000 are maintained. 

Bitcoin price

The market is closely watching whether the theory suggesting that the Halving price catalyst is already factored into the current market conditions holds. Additionally, the performance of Bitcoin ETFs in the United States and their potential impact on driving the cryptocurrency’s price back to previous highs are of significant interest.

Furthermore, the recent approval of the spot Bitcoin ETF market in Hong Kong is expected to contribute to increased adoption of the leading cryptocurrency. Although some experts do not consider it as significant as the US ETF market, it is anticipated to generate a surge in price and further strengthen Bitcoin’s position.

Ultimately, the outcome of the Halving event, combined with the developments in both the US and Hong Kong ETF markets, remains uncertain. The ability of Bitcoin to regain its bullish momentum and drive increased demand will be closely monitored.

Featured image from Shutterstock, chart from TradingView.com

Historical Trends Show What To Expect For Bitcoin Price Following The Halving

The 2024 Bitcoin halving is only two days away, and there are already varying expectations of what might happen to the BTC price once the event is completed. One way to get an idea of how it could play out for the Bitcoin price, though, is through historical data and how the cryptocurrency has performed at times like these.

Bitcoin Price Trends For Previous Halvings

There have been three halvings so far since Bitcoin was first launched in 2009 and with each one, Bitcoin has demonstrated various reactions to the event. The first halving took place on November 28, 2012, the second happened on July 9, 2016, and the last one was on May 11, 2020.

For the purpose of this report, only the last two halving will be referenced given that adoption had began to climb at the time that these two happened. The 2016 halving happened when Bitcoin was trading around $650, but in the weeks following the halving, the BTC price would drop another 30%, reaching as low as $460 before climbing back up once again.

Bitcoin halving 2016

Then, during the 2020 halving, the BTC price was trending just under $10,000, and following the halving, would see a drop in price as well. However, this drop was not as significant as the 2016 drop, with the BTC price only falling around 15% during this time.

Bitcoin halving 2020

This has formed quite a trend with the halving, where the Bitcoin price falls after the event, which is expected to be bullish. Therefore, if this trend continues, then BTC could see a sharp drop in price despite the expectation that the halving will be bullish for price.

However, it is important to consider that subsequent halvings have seen a lower post-halving crash compared to their predecessors. So, if this holds this year, Bitcoin could still be looking at a crash but to a much lesser degree. For example, the 2020 post-halving crash was half of the 2016 post-halving crash, so holding this trend, the crash this time around could only be an around 7-8% crash.

BTC Deviates From Established Halving Trends

While the historical data does suggest where Bitcoin could be headed following the crash, it is also important to note that the digital asset has deviated from a number of pre-halving trends. One of these deviations is the fact that the Bitcoin price hit a new all-time high before the halving, something that has never happened before. This could suggest that there will be a complete deviation from these established trends, meaning that a crash may not follow the halving after all.

Another deviation is that the few weeks leading up to the last two Bitcoin halvings have been green. However, in 2024, the last three weeks leading up to the halving have been red as the BTC price has been in decline. This also lends credence to the fact that there could also be a deviation from its post-halving trends.

One thing to keep in mind though, is that the crypto market has always been uncertain and Bitcoin has a habit of doing what no one expected. The Bitcoin Fear & Greed Index has seen a pull back from the extreme greed territory, but it continues to remain in greed, which means investors are still bullish. In this case, if Bitcoin were to do the opposite of what is expected, then it could follow the established trend and crash back down.

Bitcoin price chart from Tradingview.com

Crypto Exchanges Bitcoin Supply Can Only Last For 9 Months, ByBit Report

Cryptocurrency exchange and trading platform, Bybit has released a new report highlighting the impacts of the upcoming Bitcoin halving event on the supply dynamics of Bitcoin within exchanges in the crypto space. The crypto firm has provided valuable insights on how the halving event would enhance scarcity and considerably influence the price of BTC. 

Exchanges Set To Face Bitcoin Supply Crunch

On Tuesday, April 16, Bybit published a new report, providing a detailed analysis of the Bitcoin halving event set to take place this month. The crypto firm disclosed that the Bitcoin reserves within the world’s crypto exchanges have been depleting at a rapid pace, leaving only nine months of BTC supply left on exchanges. 

For a clearer perspective, Bybit explains that with just two million Bitcoin left in its total supply, a daily influx of $500 million into Spot Bitcoin ETFs would result in approximately 7,142 BTC leaving exchanges daily. This suggests that it would take only nine months to completely consume all of the remaining BTC reserves on exchanges. 

Bybit has stated that a major contributor to this supply squeeze would be the upcoming Bitcoin halving event, which would reduce the cryptocurrency’s total supply by 50% by cutting Bitcoin miners’ rewards in half. 

The crypto exchange has also disclosed that after the halving event, the sell-side supply of BTC flowing into Centralized Exchanges (CEXs) will become grossly reduced. Additionally, Bitcoin’s “supply squeeze will ostensibly be worse.”

BTC To Become “Twice As Rare As Gold”

In its report, Bybit compared Bitcoin’s supply after the halving event with that of gold. The crypto exchange revealed that Bitcoin was steadily growing to become one of the safest investment choices, even for the most seasoned and sophisticated investors within the crypto space. 

According to the exchange, the Bitcoin halving event would significantly impact the cryptocurrency’s scarcity factor, making it an even rarer asset than gold. 

Basing this analysis on the Stock-to-Flow (S2F) ratio, Bybit disclosed that Bitcoin’s S2F ratio is around 56 currently, while gold’s ratio is 60. After the halving event this April, Bitcoin’s S2F ratio is projected to increase to 112. 

“Each Bitcoin halving sharpens the narrative of Bitcoin as not just a currency, but a scarce digital asset, akin to digital gold. This upcoming halving in 2024 will thrust BTC into an era of unprecedented scarcity, making it twice as rare as gold,” the Co-founder and CEO of Bybit, Ben Zhou stated. 

While highlighting the significance of Bitcoin’s rarity following the halving event, another report also disclosed that the price of Bitcoin would experience significant upward pressure post-halving. This suggests that BTC’S supply squeeze could potentially propel its price to new heights during this period. 

Furthermore, the report revealed that several crypto analysts predict that the post-halving increase in Bitcoin’s price would be less remarkable than the early pre-halving surge which saw the price of Bitcoin hitting new all-time highs of more than $73,000.

Bitcoin price chart from Tradingview.com

Bitcoin Could Hit $86,000 If This Key Level Is Surpassed: Analyst

In a compelling forecast for Bitcoin, Ali Martinez, a well-known cryptocurrency expert and trader, has pointed out a possible development that could propel the crypto asset’s price to the $86,000 threshold in the foreseeable future.

Bitcoin Movement Determined By Key Levels

The analyst’s positive perspective highlights the possibility of a large upward shift in the price trend of Bitcoin, igniting interest and speculation in the cryptocurrency space.  Ali Martinez’s analysis primarily focuses on several key support and resistance levels, of which a break out from these levels will determine the future trajectory of Bitcoin. 

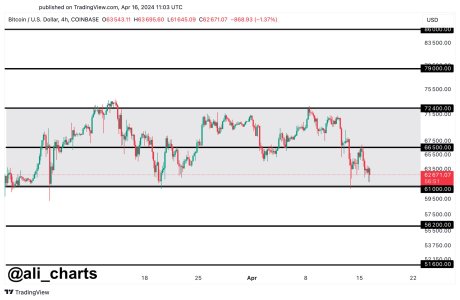
According to the expert, it appears the digital asset has been gathering momentum in a parallel channel. As a result, the $61,000 mark becomes the most significant support level, while the $72,400 mark becomes the most crucial resistance level.

Martinez affirms that Bitcoin might plummet toward the $56,200 and $51,600 range if it manages to surpass the aforementioned support level. However, should it break out from the $72,400 resistance zone, $79,000 and $86,000 are the next price targets to expect.

Bitcoin

Considering the UTXO Realized Price Distribution (URPD) chart, Martinez notes that $62,000 also proves to be an important support area for Bitcoin. If this level is lost, attention might move to the following significant demand region, which is situated around $51,500.

On the other hand, the likelihood of the bull run rekindling would be largely increased should there be a rise back above $66,250. This suggests a new wave of confidence and enthusiasm from market investors and players.

Martinez has also identified a notable shift in the accumulation trend score for Bitcoin lately. Specifically, the recent development marks the first time it has happened in six months, and it is now pegged at 0.27. This change suggests that BTC whales might be selling off their holdings rather than hoarding the crypto asset even more.

Interest From ETF Investors To Impact Price Substantially

Despite the negative performance of BTC lately, several analysts still believe the coin is headed for unprecedented heights. Crypto expert Willy Woo recently made a bold forecast, putting his price target at $650,000 at the bull market top and $91,000 at the bear market bottom.

Willy Woo expects the coin to top out at this level when ETF investors have completely deployed their capital based on asset manager recommendations. Furthermore, Woo stated that while these figures are quite cautious, Bitcoin will surpass the gold cap after ETFs have served their purpose. “Gold went on a 12-year bull run when its ETF was approved, now it is Bitcoin’s turn,” he added.

In the last day, the price of Bitcoin has fluctuated between a low of $62,000 and a high of $66,000, ultimately concluding around $63,000. Its daily trading volume has decreased by 20%, indicating a declining intreest from traders.

Bitcoin

Bitcoin Displays Bullish Adam And Eve Double Bottom: What It Means

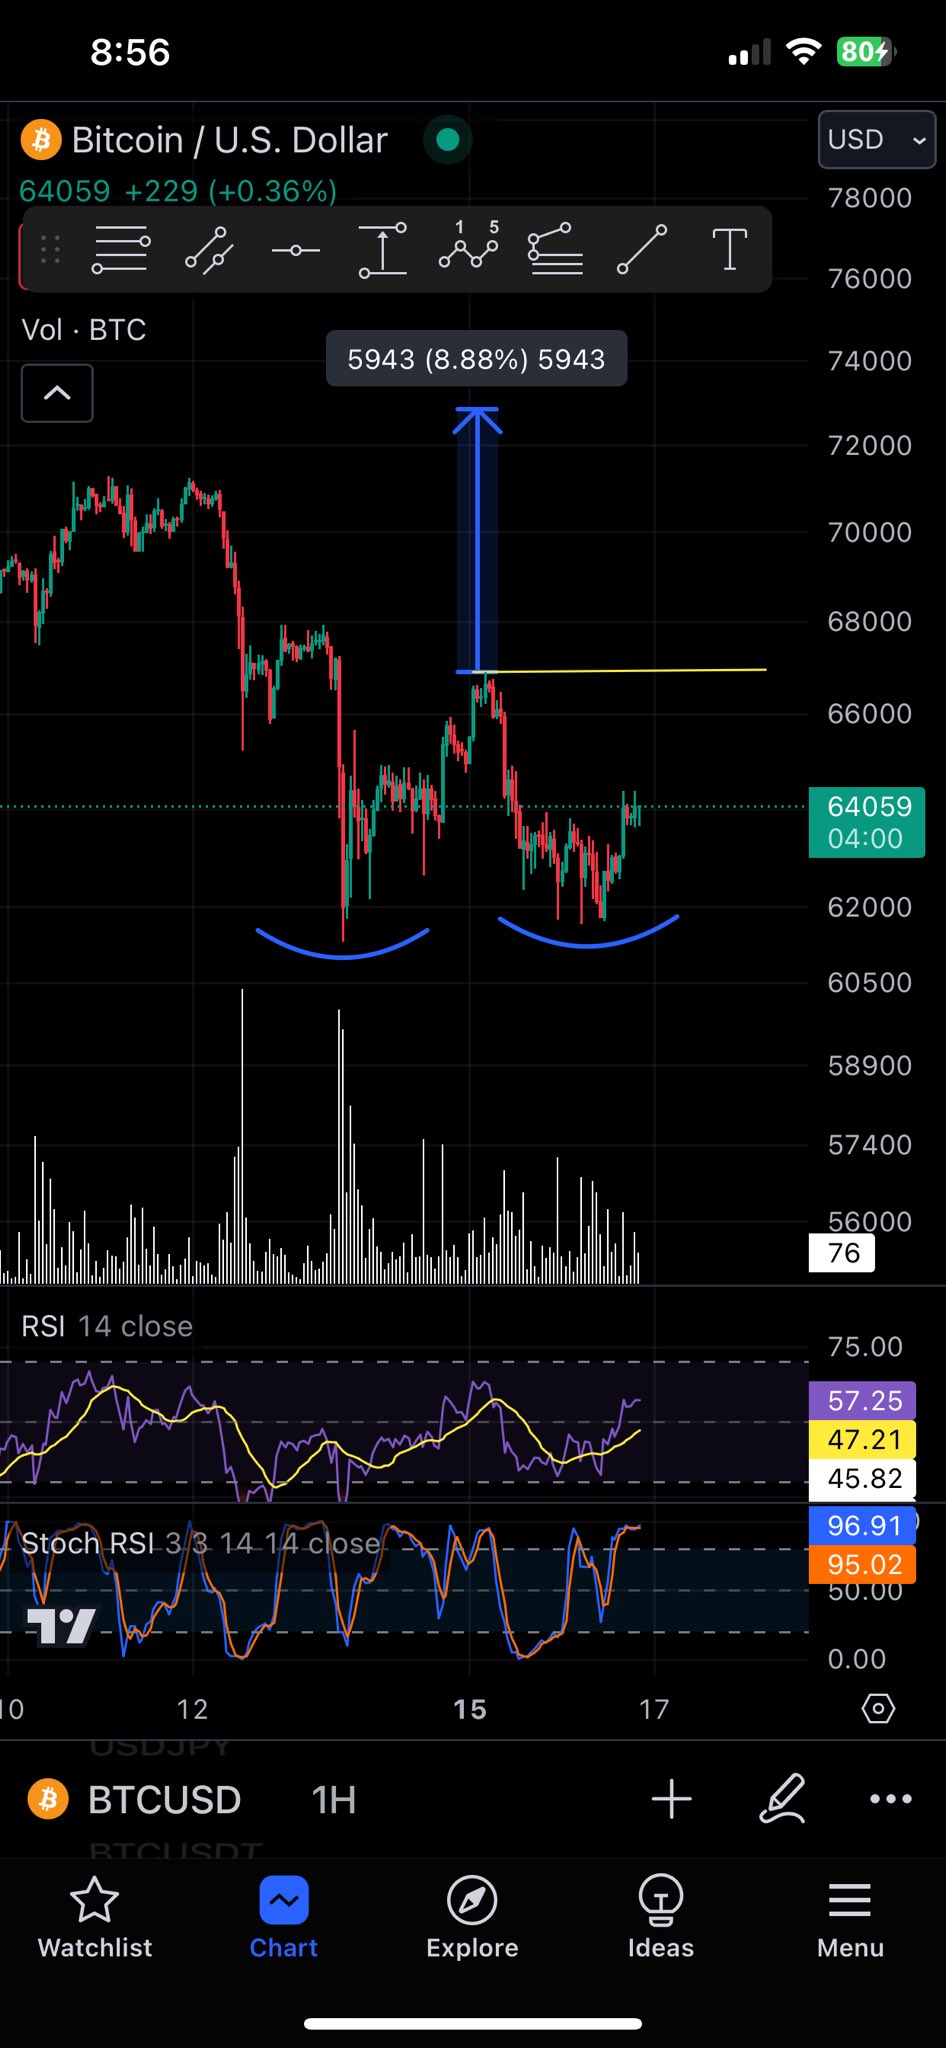
In his latest technical analysis, Christopher Inks, a recognized figure in the field of crypto analysis, points to the possible formation of a bullish Adam and Eve double bottom pattern for Bitcoin. This formation is spotted on the BTC/USD 1-hour chart and has significant implications for the cryptocurrency’s short-term price action.

The chart depicts Bitcoin’s price movement with a distinct pattern that resembles two troughs with a peak in between. The first trough, known as the “Adam,” is characterized by a sharp, V-shaped bottom, indicating a rapid price decline and equally swift rebound. This is followed by a more rounded, gradual, and wider “Eve” trough, suggesting a slower and more deliberate price recovery.

Bitcoin possible Adam and Eve double bottom in progress

Bitcoin Targets Its All-Time High

In this analysis, the price level to watch is marked by a horizontal yellow line, which Inks suggests is the neckline of the pattern. A breakout and close above this neckline would confirm the pattern, signaling a potential bullish reversal. The importance of this neckline, which lies around the $67,000 price level, cannot be overstated as it represents a key resistance point that the price needs to surpass to confirm the pattern.

To derive the target of the pattern, Inks uses the depth of the formation, measuring from the neckline to the lowest point of the Adam trough. This height (8.88%) is then projected upward from the breakout point, suggesting that the pattern target would be in the area of $73,000, close to Bitcoin’s all-time high (ATH).

Other technical indicators on the chart include volume, the Relative Strength Index (RSI), and the Stochastic RSI. Volume, denoted at the bottom of the chart, has shown a significant peak at the formation of the Adam bottom, followed by less pronounced volume during the formation of the Eve. This volume profile often accompanies the Adam and Eve pattern and can serve as a confirmation signal of the bullish sentiment.

The RSI, a momentum oscillator that measures the speed and change of price movements, is at 47, neutral territory, showing that neither bulls nor bears have gained full control yet. The Stochastic RSI, a more sensitive indicator that combines the features of stochastic oscillators and RSI, is indicating a strong upward momentum, with a reading above 95 out of 100, which could suggest potential for a short-term pullback due to overbought conditions.

Finally, it’s important to note that the Stochastic RSI is showing a crossover in the overbought territory, which can sometimes precede a price correction. However, given the bullish pattern indicated by the Adam and Eve formation, the sentiment appears to lean towards an optimistic outlook. If BTC price breaks above $67,000 and closes a hour-candle above this threshold, the bulls could target the all-time high at $73,780.

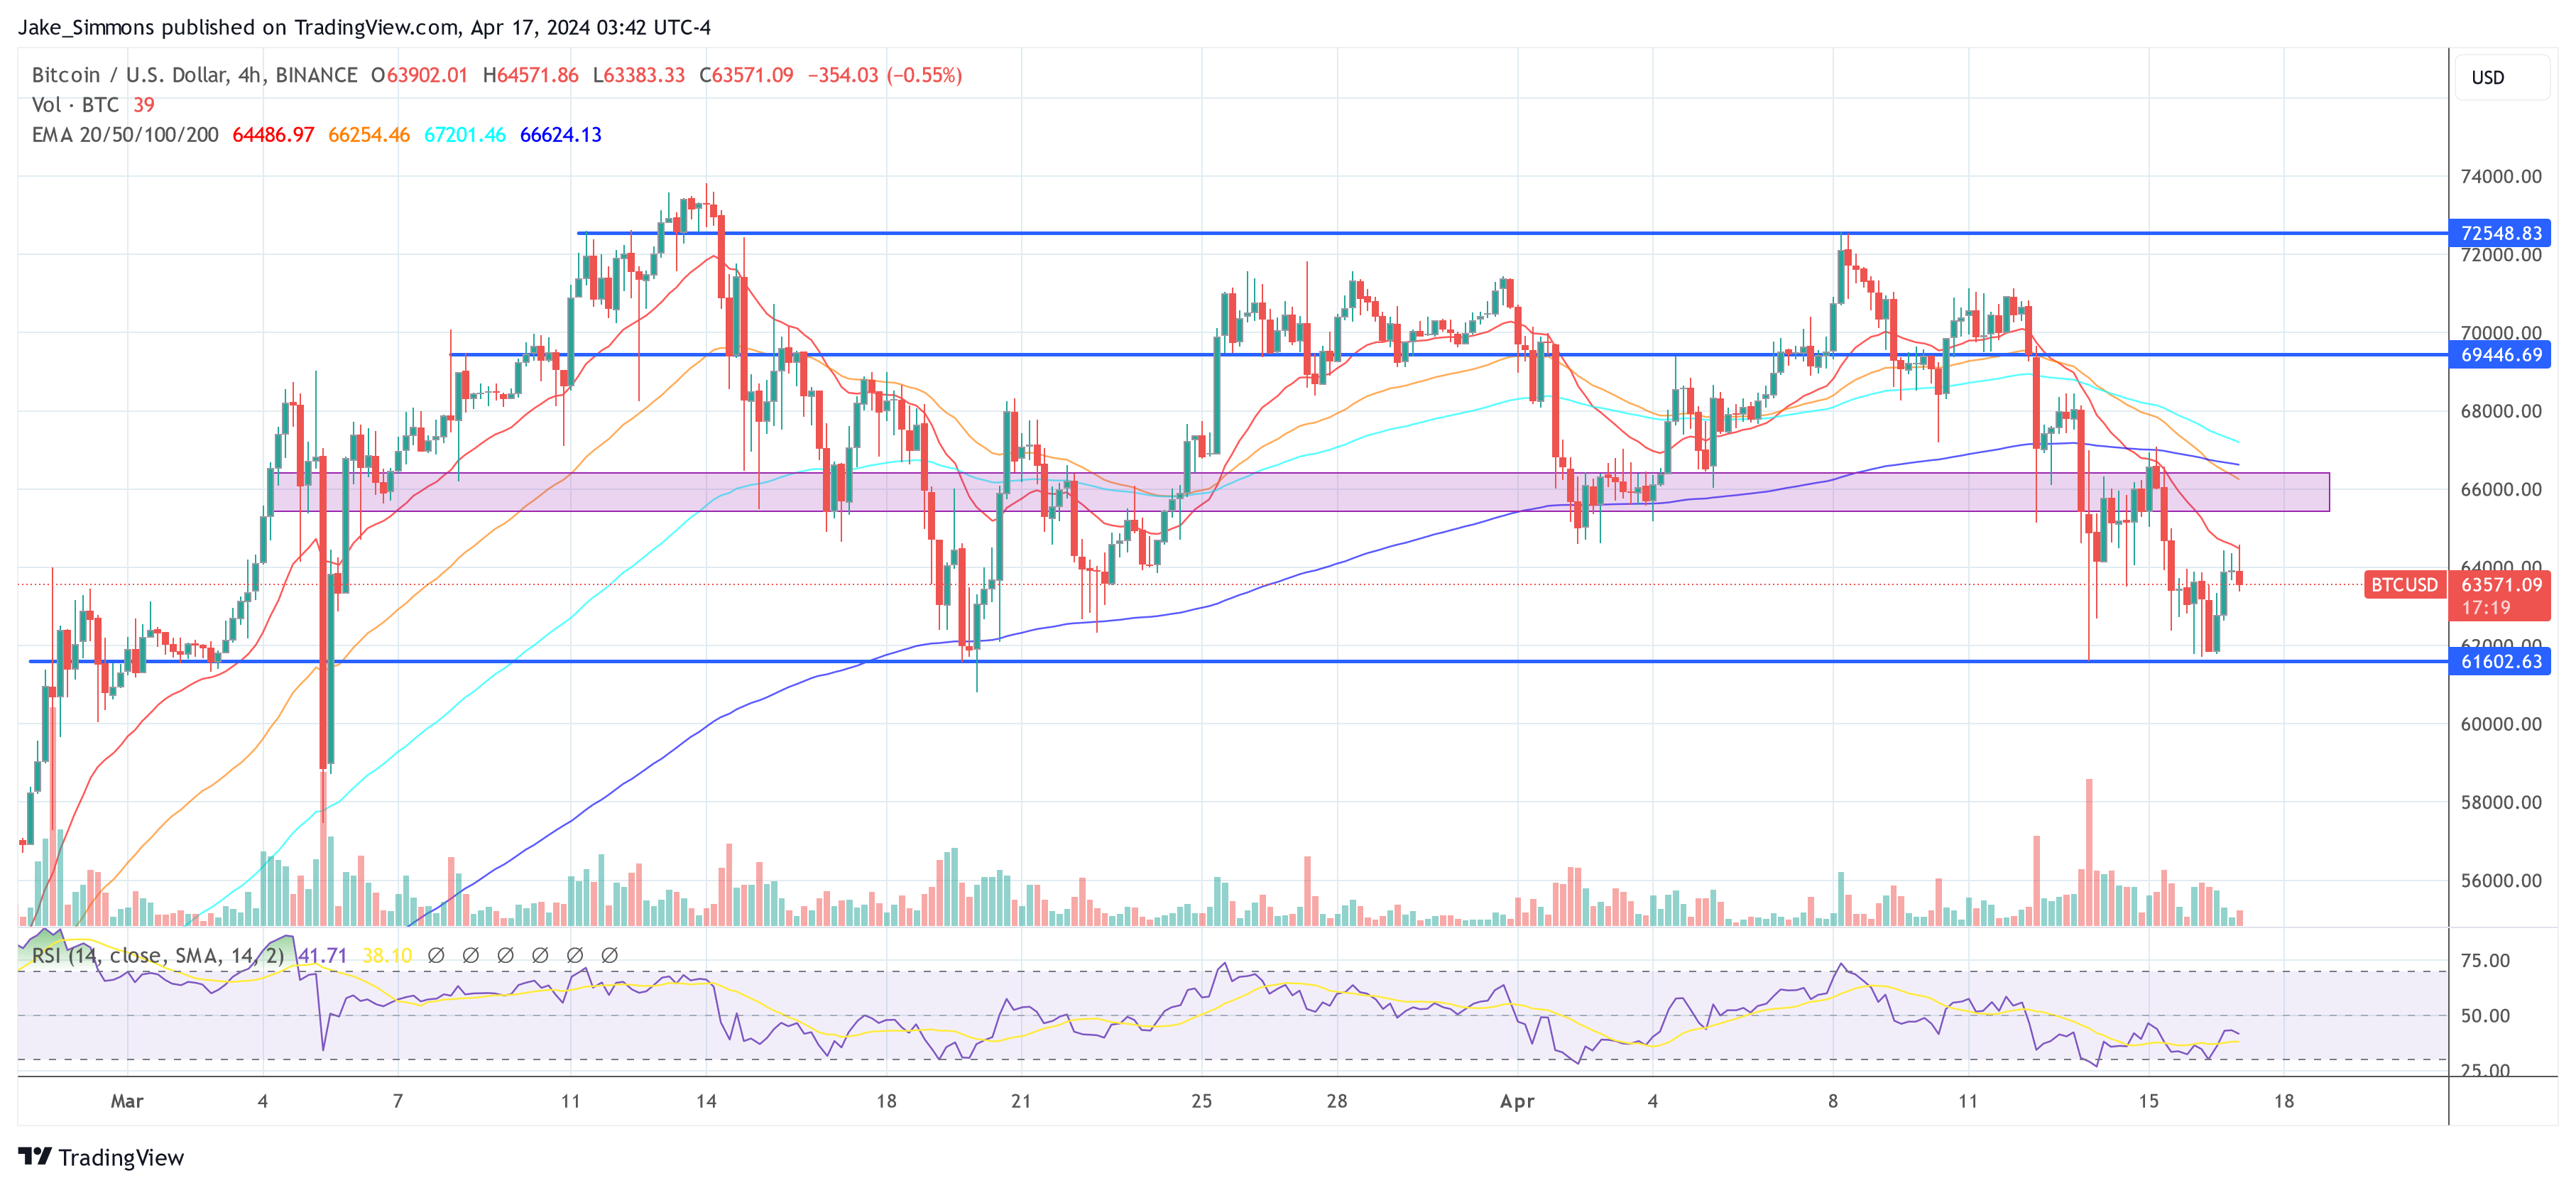
At press time, BTC traded at $63,571.

Bitcoin price

Cardano’s Dark Hour: Panic Grips Investors As ADA Loses 22% Of Its Value

As the cryptocurrency market experiences heightened volatility, one digital asset, in particular, finds itself under the microscope: Cardano (ADA).

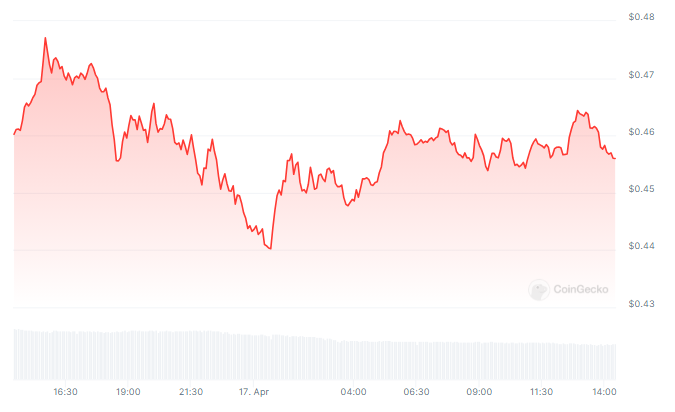
At the time of writing, ADA was trading at $0.45, down 1.8% and 21.9% in daily and weekly timeframes, data from Coingecko shows.

With prices fluctuating and investors on edge, analysts are closely scrutinizing ADA’s movements for signs of stability or further turbulence.

Analysis Points To Critical Crossroads For Cardano

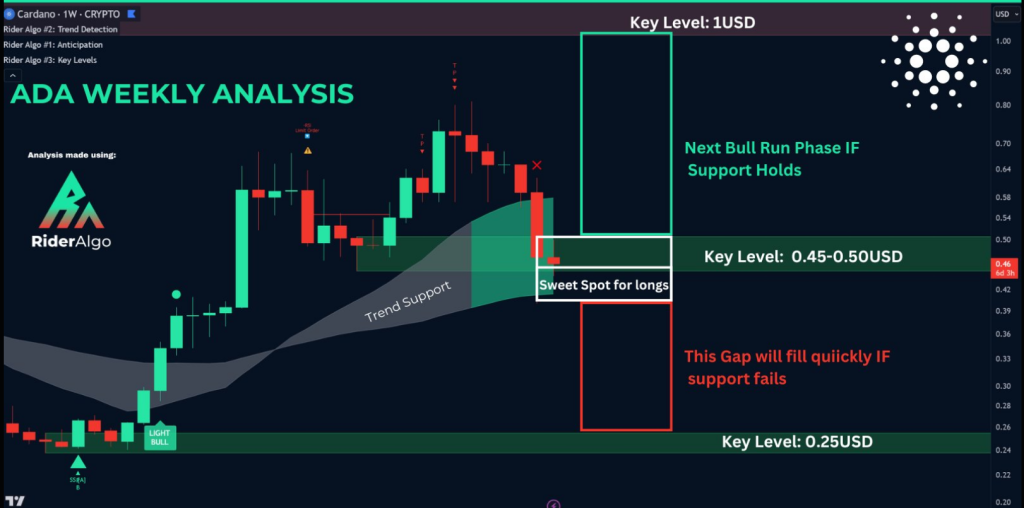
Recent analysis conducted by Trend Rider, a respected voice in the crypto community, suggests that Cardano’s price has reached a pivotal moment. The digital asset stands at a critical juncture, with its price hovering precariously near a key support zone.

Should ADA breach this support level, analysts warn of a potential plunge to $0.25. However, if Cardano manages to hold this level, it could signal the formation of a double bottom, potentially paving the way for a rally towards the $1 mark.

Amidst this uncertainty, the fate of Cardano appears intricately linked to the movements of Bitcoin, the dominant force in the cryptocurrency market.

Bitcoin’s Influence On ADA Trajectory

As Bitcoin charts its own course, Cardano investors are keenly aware of the impact that the flagship cryptocurrency’s movements can have on ADA’s price action.

Should Bitcoin embark on a bullish trajectory, it could trigger a sharp decline in altcoins like Cardano, followed by a swift rebound.

Conversely, a bearish path for Bitcoin could spell an extended period of bearish sentiment for the broader crypto market, including Cardano. Despite the uncertainty surrounding Cardano’s future, Trend Rider advises investors to remain calm and adhere to their investment strategies.

In addition to providing guidance for navigating the current market conditions, Trend Rider draws parallels between Cardano’s present situation and its historical performance.

Historical Comparisons Offer Hope Amidst Uncertainty

Drawing from history, Trend Rider points to Cardano’s resilience in the face of adversity. In October 2020, ADA experienced a significant drop in value, plummeting to a mere $0.10 before staging an impressive comeback, reaching a valuation of slightly over $3.

This historical precedent serves as a reminder that Cardano has weathered storms before, and may be poised for a similar resurgence in the face of adversity.

As fear levels peak amidst Cardano’s testing of major support thresholds, investors are reminded of the importance of maintaining a steady hand and a long-term perspective.

Featured image from Pexels, chart from TradingView

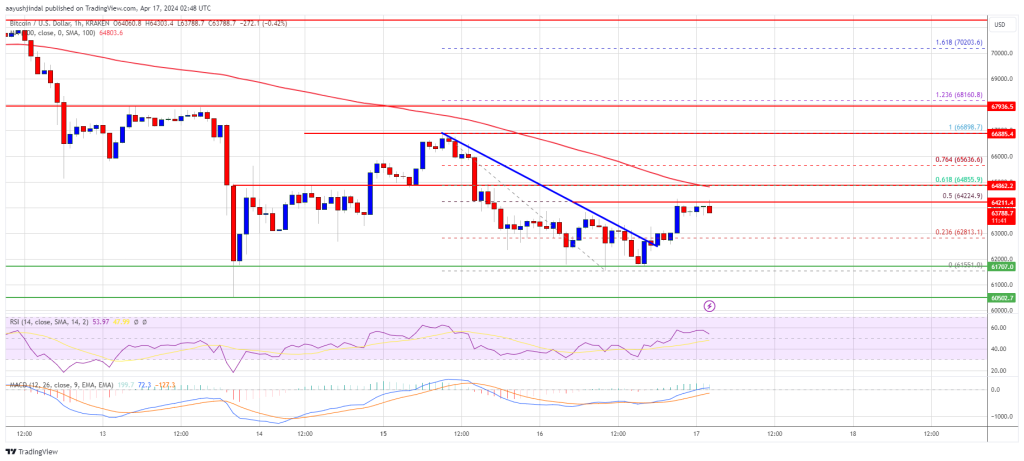
Bitcoin Price Consolidates Below Hurdles, Can BTC Bounce Back?

Bitcoin price is consolidating below the $65,000 resistance zone. BTC must surpass $65,000 and $67,000 to move into a bullish zone again.

  • Bitcoin is struggling to gain pace for a move above the $65,000 resistance zone.
  • The price is trading below $65,000 and the 100 hourly Simple moving average.
  • There was a break above a connecting bearish trend line with resistance at $63,000 on the hourly chart of the BTC/USD pair (data feed from Kraken).
  • The pair could gain bullish momentum if it clears the $67,000 resistance zone.

Bitcoin Price Eyes Upside Break

Bitcoin price failed to clear the $67,000 resistance zone. BTC started another decline and traded below the $65,000 support zone. It even declined below $62,000 before the bulls emerged.

A low was formed near $61,551 and the price is now attempting a fresh recovery wave. There was a break above a connecting bearish trend line with resistance at $63,000 on the hourly chart of the BTC/USD pair. The pair climbed above the 23.6% Fib retracement level of the recent decline from the $66,898 swing high to the $61,551 low.

Bitcoin price is trading below $65,000 and the 100 hourly Simple moving average. Immediate resistance is near the $64,250 level. It is close to the 50% Fib retracement level of the recent decline from the $66,898 swing high to the $61,551 low.

The first major resistance could be $64,850. The next resistance now sits at $65,000. If there is a clear move above the $65,000 resistance zone, the price could continue to move up. In the stated case, the price could rise toward $66,500.

Bitcoin Price

Source: BTCUSD on TradingView.com

The next major resistance is near the $67,200 zone. Any more gains might send Bitcoin toward the $70,000 resistance zone in the near term.

Another Decline In BTC?

If Bitcoin fails to rise above the $65,000 resistance zone, it could start another decline. Immediate support on the downside is near the $62,800 level.

The first major support is $62,000. If there is a close below $62,000, the price could start to drop toward the $61,500 level. Any more losses might send the price toward the $60,500 support zone in the near term.

Technical indicators:

Hourly MACD – The MACD is now losing pace in the bullish zone.

Hourly RSI (Relative Strength Index) – The RSI for BTC/USD is now above the 50 level.

Major Support Levels – $63,000, followed by $62,000.

Major Resistance Levels – $64,850, $65,000, and $67,000.