
Cryptocurrencies flash mixed signals as market participants digest the details of CZ’s guilty plea and the DOJ’s $4.3 billion settlement with Binance.
Cryptocurrency Financial News
Cryptocurrencies flash mixed signals as market participants digest the details of CZ’s guilty plea and the DOJ’s $4.3 billion settlement with Binance.

The lending firm has been in bankruptcy court since its Chapter 11 filing in 2022, while the SEC filed a lawsuit against both the firm and former CEO Alex Mashinsky in July.

The announcement came roughly nine months after U.S.-based crypto exchange Bittrex said it would shutter operations in response to the country’s regulatory environment.

Republican presidential candidate Vivek Ramaswamy, Independent presidential candidate Robert F. Kennedy, Jr. and many U.S. lawmakers were in attendance at NABS 2023.

NGRAVE, a digital asset security provider, offers user-friendly, self-custody solutions that combine offline key creation with advanced recovery options for crypto users.

SOL, AVAX and DYDX rank among the top-performing altcoins this month. Cointelegraph investigates what is behind the move.

Jasmine Smith, chief executive of Web3-based wellness app Rejuve.AI, told Cointelegraph that decentralized and AI-powered platforms for health research do not aim to replace doctors and clinicians but rather help them in their work.

As the metaverse loses its appeal to some global tech leaders, MetaMinds Group CEO Sandra Helou argues that failures in metaverse initiatives resulted from a lack of proper business models.

Stefan Thomas, the former chief technology officer at Ripple, has an IronKey hard drive containing 7,002 BTC with only two attempts at guessing a password remaining.

Transak’s compliance chief James Young told Cointelegraph that while the U.K.’s new crypto marketing rules are good for the industry, they still pose challenges to some firms operating in the decentralized space.

Exchange-traded fund analyst Eric Balchunas said the addition was “all part of the process” of a crypto ETF being listed and traded and a positive sign for SEC approval.

Advancements in AI have made it possible to create deepfake videos and voices in which scammers write the scripts to try and illegally obtain others’ crypto.

Ras Al Khaimah, known for its rich cultural sites, is turning to the digital assets sector to diversify its economy away from traditional avenues such as tourism.

Comments from institutional investors and amendments to the spot Bitcoin ETF applications could be behind the recent improvement in investor sentiment.

A crypto mining operation near a Microsoft facility that supported the Pentagon was reportedly under scrutiny by U.S. officials.
The XRP price has had a rollercoaster growth trajectory which was mostly hindered by the US Securities and Exchange Commission (SEC) filing a lawsuit against Ripple. But a lot of the altcoin’s performances over the months have been rather predictable, and with its history, we can get an idea of what to expect for the XRP price this month.
In a heat map of historical XRP price data generated by NewsBTC, we can see how the month of October has usually gone in the past. The heat map shows XRP’s performance over the last eight years and the figures for October are some of the worst historically.
As shown in the image below, the month of October has historically seen more losses than gains when it comes to the XRP price. In fact, out of the last eight years, only two years have seen October record a positive return for the XRP price.
In the first four years of the altcoin’s life, we can see that the month of October was characterized by losses. Then in the fifth year in 2019, XRP saw its first profitable October with a 14.84% increase. Then from there, there is an alternating trend recorded with one year being profitable and the next being filled with losses.
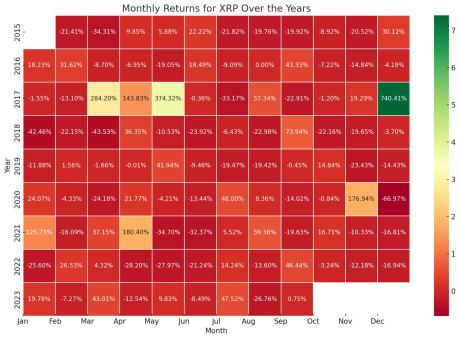
The year 2022 was no different, seeing 3.24% losses after the previous year saw October end with 16.71% gains. So if this holds, it could be that October 2023 would end on a good note. However, as the charts show, this month is already seeing XRP prices fall, so for it to finish strong, there would have to be a massive price reversal. Otherwise, October 2023 could stick to historical performance and end in the red.
As shown in this report from Bitcoinist, taking an average of the XRP price performance in October over the years shows that it is not a good month for the altcoin. The chart shared in the report reveals that historically, October is the third-worst month for the cryptocurrency.
The only months that have seen worse performance than October are the months of February with slightly higher loss numbers. Meanwhile, June takes the crown for the month with the worst returns as the last 7 seven years have seen the month end with losses.
On the other hand, December presents as the best month for the XRP price. This is followed by April being the second, with May and March snagging fourth and fifth place, respectively. January, November, and September are also profitable months but to a much lesser degree.

The SEC filed a lawsuit against Ripple in December 2020 for using XRP to raise funds, which the commission claimed was a violation of securities laws.

The wallet manufacturer reportedly had around 734 employees at the time of publication, suggesting roughly 88 people may have lost their jobs.

Bloomberg analyst Eric Balchunas speculated that the SEC may have pressured Valkyrie to halt ETH futures contract purchases until the ETF was officially approved.
Bloomberg analyst Eric Balchunas speculated that the SEC may have pressured Valkyrie to halt ETH futures contract purchases until the ETF was officially approved.


