Ethereum price failed to clear the $3,280 resistance zone. ETH declined below the $3,200 support and is now consolidating losses above $3,100.
- Ethereum struggled to clear the $3,250 and $3,280 resistance levels.
- The price is trading below $3,200 and the 100-hourly Simple Moving Average.
- There was a break below a key bullish trend line with support at $3,190 on the hourly chart of ETH/USD (data feed via Kraken).
- The pair could continue to move down if it trades below the $3,100 support.
Ethereum Price Trims Gains
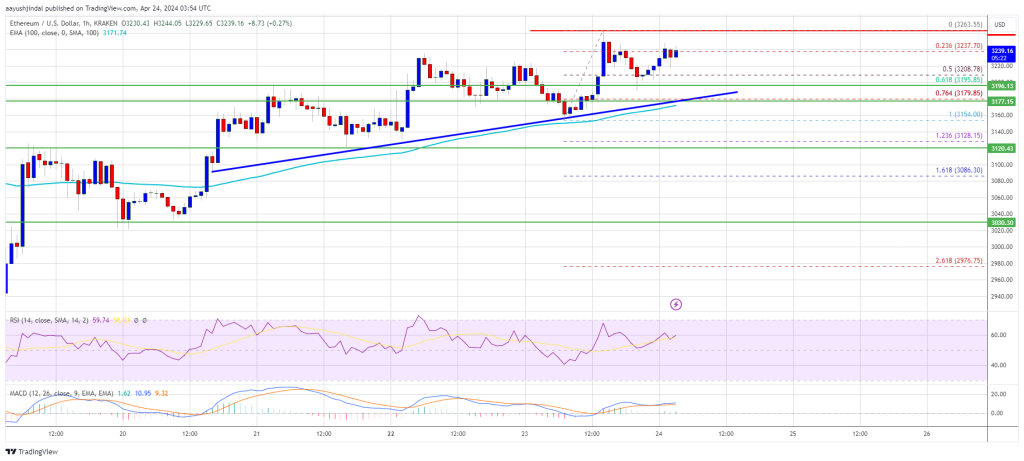
Ethereum price struggled to clear the $3,250 and $3,280 resistance levels. ETH started a fresh decline and traded below the $3,200 support to enter a short-term bearish zone, like Bitcoin.
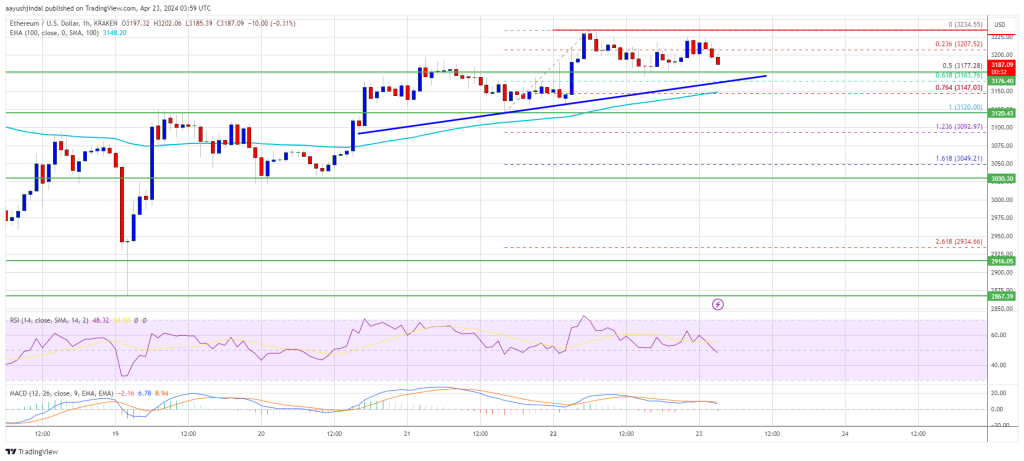
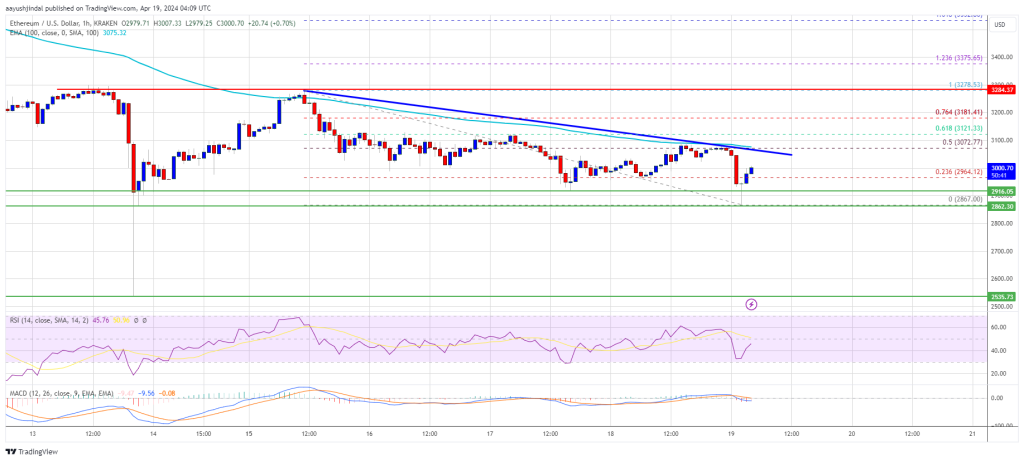
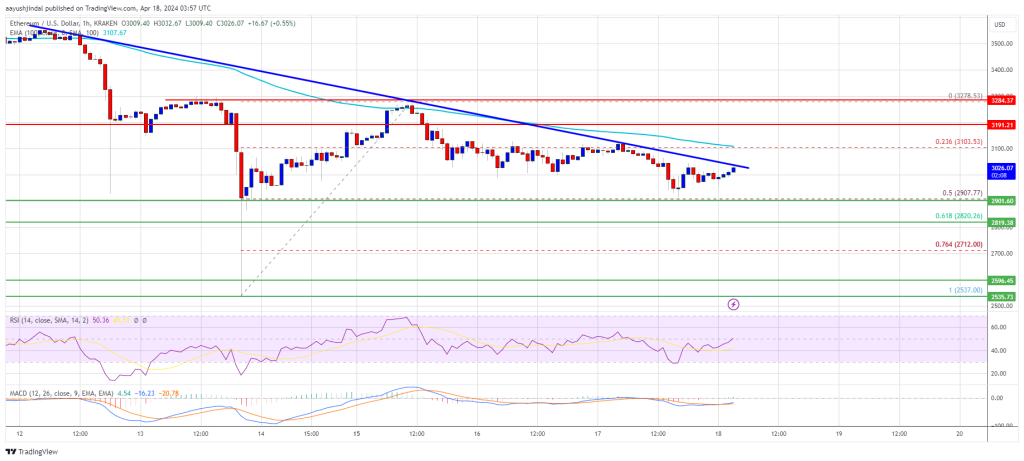
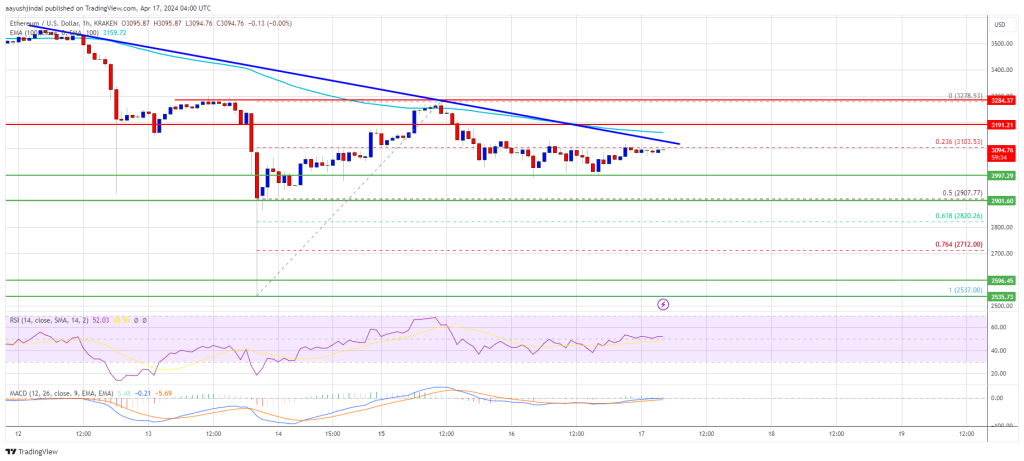
Besides, there was a break below a key bullish trend line with support at $3,190 on the hourly chart of ETH/USD. The pair even declined below $3,150 and tested $3,100. A low has formed at $3,105 and the price is now consolidating losses.
Ethereum is now trading below $3,200 and the 100-hourly Simple Moving Average. It is testing the 23.6% Fib retracement level of the recent decline from the $3,291 swing high to the $3,105 low.
Immediate resistance is near the $3,180 level and the 100-hourly Simple Moving Average. The first major resistance is near the $3,200 level or the 50% Fib retracement level of the recent decline from the $3,291 swing high to the $3,105 low.
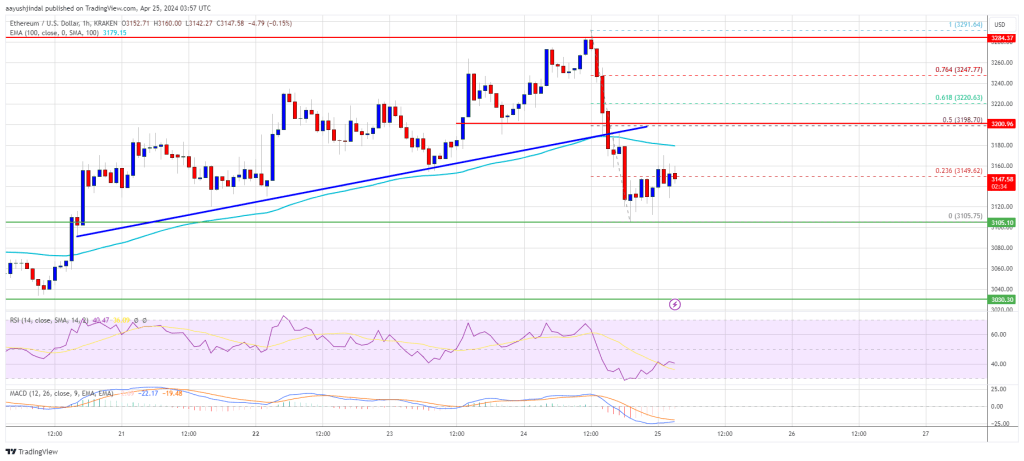
Source: ETHUSD on TradingView.com
The next key resistance sits at $3,220, above which the price might gain traction and rise toward the $3,250 level. A close above the $3,250 resistance could send the price toward the $3,280 resistance. If there is a move above the $3,280 resistance, Ethereum could even test the $3,350 resistance. Any more gains could send Ether toward the $3,500 resistance zone.
More Losses In ETH?
If Ethereum fails to clear the $3,200 resistance, it could continue to move down. Initial support on the downside is near the $3,120 level. The first major support is near the $3,100 zone.
The main support is near the $3,030 level. A clear move below the $3,030 support might increase selling pressure and send the price toward $2,850. Any more losses might send the price toward the $2,650 level in the near term.
Technical Indicators
Hourly MACD – The MACD for ETH/USD is losing momentum in the bearish zone.
Hourly RSI – The RSI for ETH/USD is now below the 50 level.
Major Support Level – $3,100
Major Resistance Level – $3,200


