Bitcoin Deja Vu: Capital Inflows Mirror Pre-2021 Bull Run Momentum

On-chain data shows the cryptocurrency capital inflows currently look similar to December 2020, right before Bitcoin rallied from $18,000 to $65,000.

Bitcoin & Ethereum Are Getting $19.7 Billion In Capital Injections Currently

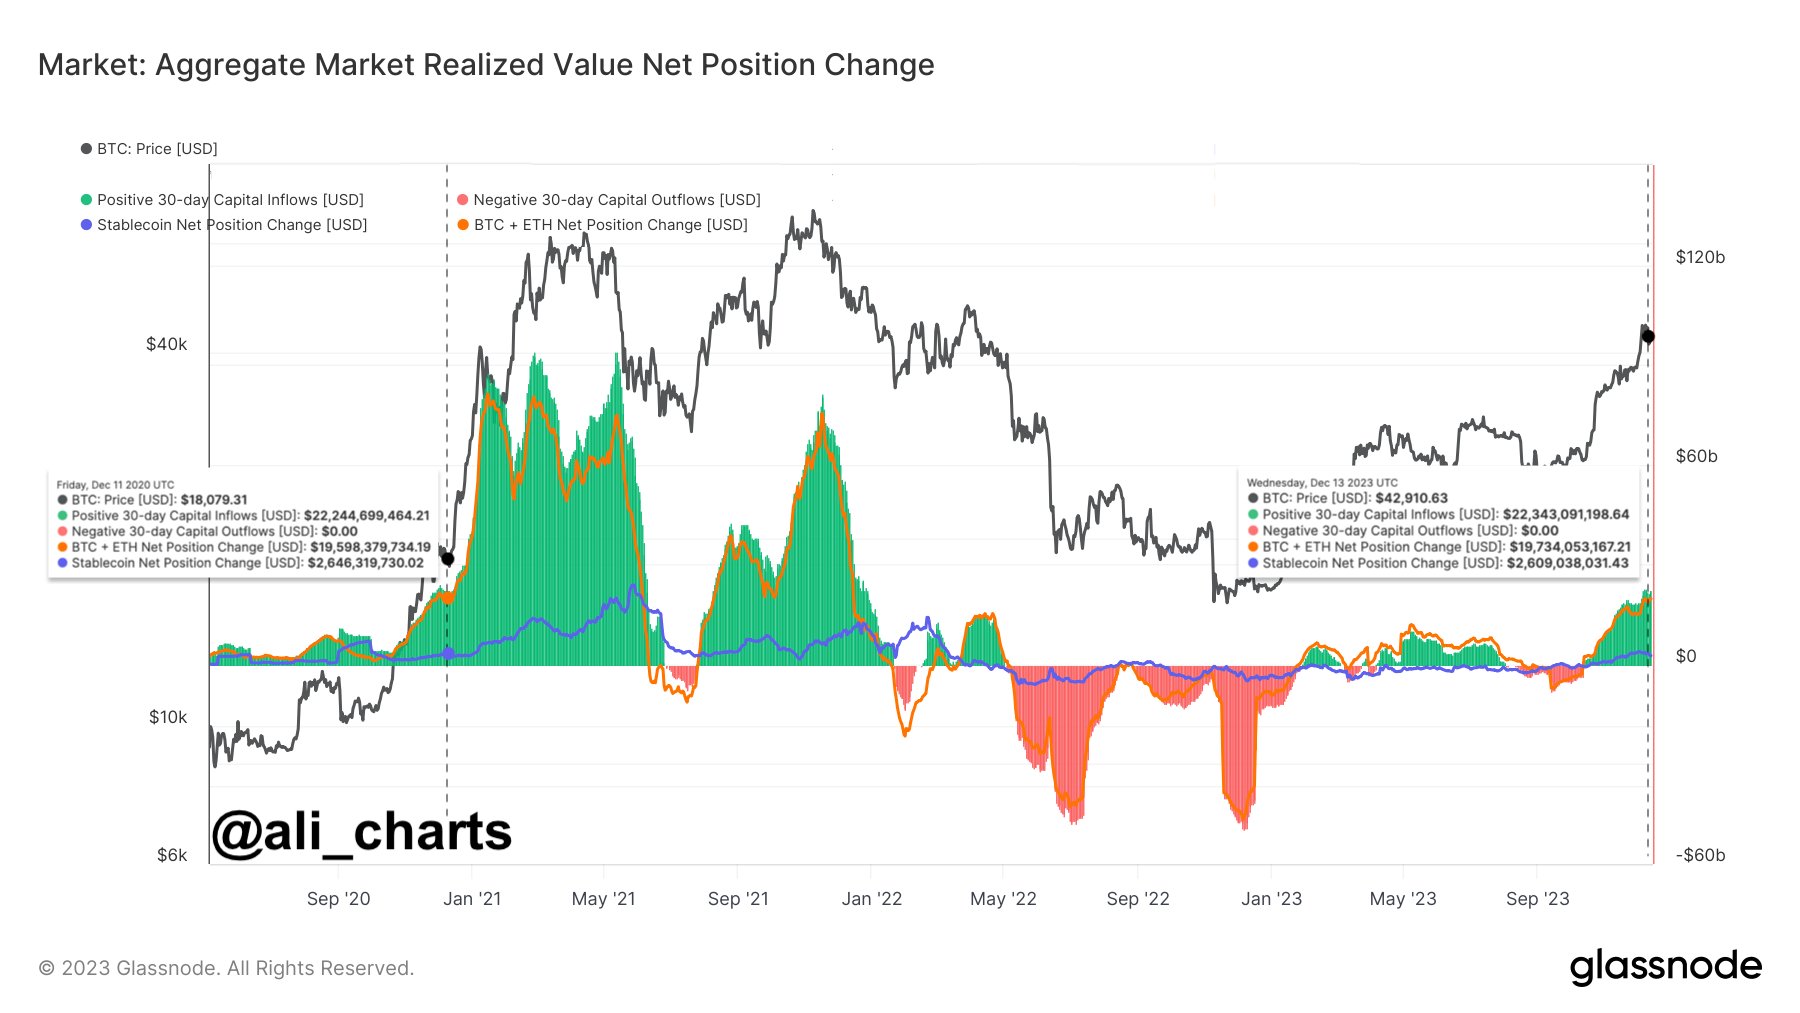
As explained by analyst Ali in a new post on X, Bitcoin and Ethereum are receiving a large amount of capital inflows currently. To showcase these positive flows, the analyst has referred to the “BTC + ETH Net Position Change” indicator from the on-chain analytics firm Glassnode.

What this metric does is that it keeps track of the 30-day change taking place in the combined realized cap of these top two cryptocurrencies. The “realized cap” here basically refers to the total amount of capital (in USD) that investors have used to purchase a given asset.

As such, the metric’s net position change could provide hints about whether the total money invested into the coin in question has gone up or down during the past month.

Now, here is a chart that shows the trend in this indicator for Bitcoin and Ethereum over the past few years:

Bitcoin Capital Inflows

As displayed in the above graph, the Bitcoin + Ethereum Net Position Change has been inside the positive territory recently and has only been climbing up. The trend naturally makes sense, as both of the assets have registered some sharp rises during the past month.

Currently, the indicator has a value of $19.7 billion. As Ali has pointed out, “This is around the same capital inflow we saw back in December 2020 before BTC surged from $18,000 to $65,000!”

In the same chart, data for two other metrics is also shown. The first is the “Stablecoin Net Position Change,” which, as its name suggests, keeps track of the monthly inflows and outflows for the major USD stablecoins in the sector.

Unlike Bitcoin and Ethereum, though, this metric doesn’t make use of the realized cap, but simply the supply of the stables. This is obviously due to the fact that these coins have mostly the same value at all points, so the realized cap wouldn’t be any different from the market cap (which itself is equivalent to the supply as the price is $1).

From the chart, it’s visible that the stablecoins have also enjoyed positive inflows recently. This means that all three major asset classes in the sector, Bitcoin, Ethereum, and the stables, are receiving capital injections currently.

Most of the capital inflows and outflows towards the cryptocurrency sector happen through these three. The altcoins only receive their capital through a rotation from these core assets.

Thus, the stablecoins and top two cryptocurrencies simultaneously enjoying positive inflows have historically been a very bullish combination for the sector as a whole. This constructive combination didn’t form for most of this year but finally has during this latest leg in the rally.

The last indicator on the chart keeps track of the net incomings and outgoings from the sector as a whole by simply summing up the netflows for BTC + ETH and the stables. As is apparent, this metric also has a value similar to December 2020 at the moment.

Looking at Bitcoin’s historical performance following December 2020, it could mean that the BTC price is set for another price surge going forward.

BTC Price

Bitcoin had recovered above the $43,000 level just earlier, but it appears the coin has seen a setback as it’s now once again trading below the mark.
Bitcoin Price Chart

Bitcoin Deja Vu: Capital Inflows Mirror Pre-2021 Bull Run Momentum

On-chain data shows the cryptocurrency capital inflows currently look similar to December 2020, right before Bitcoin rallied from $18,000 to $65,000.

Bitcoin & Ethereum Are Getting $19.7 Billion In Capital Injections Currently

As explained by analyst Ali in a new post on X, Bitcoin and Ethereum are receiving a large amount of capital inflows currently. To showcase these positive flows, the analyst has referred to the “BTC + ETH Net Position Change” indicator from the on-chain analytics firm Glassnode.

What this metric does is that it keeps track of the 30-day change taking place in the combined realized cap of these top two cryptocurrencies. The “realized cap” here basically refers to the total amount of capital (in USD) that investors have used to purchase a given asset.

As such, the metric’s net position change could provide hints about whether the total money invested into the coin in question has gone up or down during the past month.

Now, here is a chart that shows the trend in this indicator for Bitcoin and Ethereum over the past few years:

Bitcoin Capital Inflows

As displayed in the above graph, the Bitcoin + Ethereum Net Position Change has been inside the positive territory recently and has only been climbing up. The trend naturally makes sense, as both of the assets have registered some sharp rises during the past month.

Currently, the indicator has a value of $19.7 billion. As Ali has pointed out, “This is around the same capital inflow we saw back in December 2020 before BTC surged from $18,000 to $65,000!”

In the same chart, data for two other metrics is also shown. The first is the “Stablecoin Net Position Change,” which, as its name suggests, keeps track of the monthly inflows and outflows for the major USD stablecoins in the sector.

Unlike Bitcoin and Ethereum, though, this metric doesn’t make use of the realized cap, but simply the supply of the stables. This is obviously due to the fact that these coins have mostly the same value at all points, so the realized cap wouldn’t be any different from the market cap (which itself is equivalent to the supply as the price is $1).

From the chart, it’s visible that the stablecoins have also enjoyed positive inflows recently. This means that all three major asset classes in the sector, Bitcoin, Ethereum, and the stables, are receiving capital injections currently.

Most of the capital inflows and outflows towards the cryptocurrency sector happen through these three. The altcoins only receive their capital through a rotation from these core assets.

Thus, the stablecoins and top two cryptocurrencies simultaneously enjoying positive inflows have historically been a very bullish combination for the sector as a whole. This constructive combination didn’t form for most of this year but finally has during this latest leg in the rally.

The last indicator on the chart keeps track of the net incomings and outgoings from the sector as a whole by simply summing up the netflows for BTC + ETH and the stables. As is apparent, this metric also has a value similar to December 2020 at the moment.

Looking at Bitcoin’s historical performance following December 2020, it could mean that the BTC price is set for another price surge going forward.

BTC Price

Bitcoin had recovered above the $43,000 level just earlier, but it appears the coin has seen a setback as it’s now once again trading below the mark.
Bitcoin Price Chart

Ethereum Supply Turns Deflationary Post-Merge, Here’s How Much ETH Has Left Circulation

Ethereum has seen its deflationary status once again in the limelight as the network continues to see a significant decline in the number of ETH tokens in circulation. This comes on the back of the belief that the bull run and some other factors could help uphold this trend. 

More ETH Goes Out Of Circulation

According to data from Ultrasound Money, Ethereum has seen a decrease in its circulating supply in the last seven days, with over 14,160 ETH going out of circulation. This is a result of over 30,700 being burned during this period while only just over 16,500 ETH have been issued during this same timeframe. 

This development continues a growing trend where the number of tokens being burned outpaces the number of tokens being issued. NewsBTC had reported earlier this month how over 106,000 ETH had been burned in the last 30 days (between November 4 and December 4). At the same time, only just over 70,000 ETH had been issued. 

This deflationary trend has been attributed to the increasing number of validators exiting the Ethereum ecosystem. This trend is said to have begun at the start of October. Glassnode noted that the average number of validators exiting per day surged from 309 to 1018 validators per day at the start of October. 

This isn’t the only contributing factor, as network activity on Ethereum has picked up significantly. According to data from Etherscan, the daily number of transactions on the network has stood over a million in the last seven days. This has caused a spike in gas fees, causing more ETH to be burned with the EIP-1559 protocol.  

Ethereum price chart from Tradingview.com

Ethereum Deflationary Trend Expected To Continue

It is no coincidence that network activity on Ethereum has picked up as many continue to position themselves ahead of the imminent bull run, which is projected to kickstart in 2024. The recent surge in the trading volume of non-fungible tokens (NFTs) on Ethereum has also been a big factor. This is expected to continue once the bull market takes its full course. 

Another factor to consider is the fact that more liquidity is expected to flow into the Ethereum ecosystem if the pending Ethereum Spot ETFs applications get approved. This would likely spark a further increase in the trading activity on the network as many will look to invest in the second-largest cryptocurrency by market cap. 

ETH investors will undoubtedly be delighted at the fact that the future trajectory of ETH looks bullish. One can expect the crypto token’s value to rise as it continues to maintain this deflationary status. The less ETH in circulation, the more valuable it likely will be. 

At the time of writing, Ethereum is trading at around $2,270, up by over 4% in the last 24 hours, according to data from CoinMarketCap. 

Banking On Ethereum: JPMorgan Says Ether Will Rise Above Bitcoin In 2024

JPMorgan analysts, while maintaining an overall cautious stance on the cryptocurrency market, foresee Ethereum (ETH) surpassing Bitcoin (BTC) and other digital currencies in market price performance by 2024.

This bullish outlook for Ethereum reflects a distinctive perspective within the institution, suggesting that the analysts see unique potential and favorable prospects for Ethereum relative to other digital assets, even amid an overall cautious sentiment towards the broader crypto landscape.

In a published note on Wednesday, a team of analysts headed by Nikolaos Panigirtzoglou conveyed their expectation that Ethereum (ETH) will reclaim its prominence and regain market share within the cryptocurrency ecosystem in the upcoming year.

Ethereum Will Overtake Bitcoin – JPMorgan

“We believe that next year Ethereum will re-assert itself and recapture market share within the crypto ecosystem,” Panigirtzoglou wrote in a note.

The analysts underscored the pivotal role of the EIP-4844 upgrade, popularly known as Protodanksharding, as the primary catalyst for Ethereum’s anticipated resurgence.

This crucial upgrade, scheduled for implementation in the first half of 2024, is poised to bring about substantial improvements in Ethereum’s network activity.

Danksharding is a more efficient sharding method for Ethereum, and protodanksharding is the first step toward its complete implementation. Danksharding sidesteps the tedious procedure of dividing Ethereum into several shard chains, as contrast to the initially intended sharding method.

Data blobs, which are connected to blocks and can hold more data than blocks but are not permanently stored or accessible by the Ethereum virtual engine, are instead introduced.

Meanwhile, JPMorgan’s optimistic forecast aligns with Standard Chartered’s, as they previously stated in a communication that Ether might experience a 400% surge within a few years, followed by a more sustained upward movement towards $35,000.

Geoff Kendrick, the Head of FX Research, West, and Digital Assets Research, expressed the viewpoint that the upward trajectory for Ether might unfold at a more gradual pace compared to Bitcoin.

Ethereum Price Prediction: 5x Increase

Despite this potentially more extended timeframe, Kendrick envisions Ethereum eventually attaining a higher price multiple than Bitcoin relative to their current levels. Specifically, he anticipates Ethereum reaching a price multiple of 5.0x, surpassing Bitcoin’s expected 3.5x multiple.

Layer 2 networks, such as Optimism (OP) and Arbitrum (ARB), would gain the most from the upgrade, according to the JPMorgan analysts.

Layer 2 networks on Ethereum would benefit from the increased temporary data space, which would increase network throughput and decrease transaction fees. Data blobs improve Layer 2 network efficiency without changing the size of an Ethereum block.

In the meantime, as ether discovers new applications, demand for it will rise, and cryptocurrency-related trends will only grow. For example, the most common Ethereum use case is NFT transactions, which Kendrick believes will grow.

At the time of writing, Ether was trading at $2,281, up 5.0% in the last 24 hours, while Bitcoin was exhanging hands at $42,910, with a 2.3% increase in the last 24 hours.

Featured image from Pixabay

Ethereum Price At Make-Or-Break Moment, Decoding Key Hurdles To More Gains

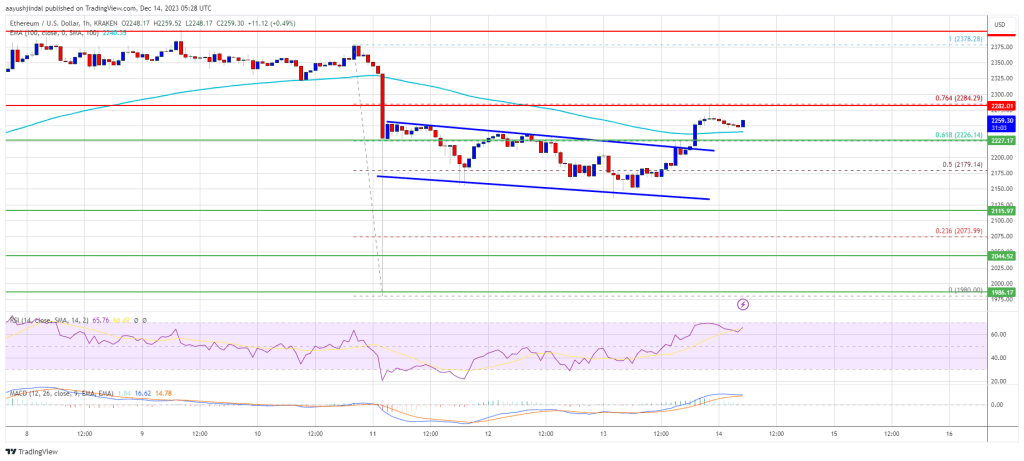
Ethereum price is recovering losses above $2,220. ETH could gain bullish momentum if there is a clear move above the $2,285 resistance zone.

  • Ethereum started a fresh increase above the $2,180 and $2,200 levels.
  • The price is trading above $2,220 and the 100-hourly Simple Moving Average.
  • There was a break above a major declining channel with resistance near $2,215 on the hourly chart of ETH/USD (data feed via Kraken).
  • The pair could start a strong increase if there is a close above $2,285 and $2,300.

Ethereum Price Regains Strength

Ethereum price remained supported above the $2,100 zone. ETH formed a base and was able to start a recovery wave above the $2,150 resistance zone, like Bitcoin.

There was a decent increase above the $2,180 resistance zone. Besides, there was a break above a major declining channel with resistance near $2,215 on the hourly chart of ETH/USD. The pair cleared the 61.8% Fib retracement level of the downward move from the $2,378 swing high to the $1,980 low.

Ethereum is now trading above $2,220 and the 100-hourly Simple Moving Average. On the upside, the price is facing resistance near the $2,285 level. It is close to the 76.4% Fib retracement level of the downward move from the $2,378 swing high to the $1,980 low.

Ethereum Price

Source: ETHUSD on TradingView.com

The next key resistance is near the $2,350 level. The main resistance is now near $2,400. A clear move above the $2,400 zone could send the price toward the $2,500 level. The next resistance sits at $2,580. Any more gains could start a wave toward the $2,640 level.

Another Decline in ETH?

If Ethereum fails to clear the $2,285 resistance, it could start a fresh decline. Initial support on the downside is near the $2,230 level or the 100-hourly Simple Moving Average.

The next key support is $2,180. The main support is now near $2,120. A downside break below $2,120 might start another major decline. In the stated case, Ether could revisit the $2,000 support. Any more losses might call for a test of the $1,880 support zone in the near term.

Technical Indicators

Hourly MACDThe MACD for ETH/USD is gaining momentum in the bullish zone.

Hourly RSIThe RSI for ETH/USD is now above the 50 level.

Major Support Level – $2,230

Major Resistance Level – $2,285

Crypto’s Silver Lining: Market Dips Are Stepping Stones To Soaring Heights – Analyst

Crypto Rand, a renowned crypto trader, has shared insights on the current market corrections, emphasizing the necessity of these corrections for sustainable market ‘growth.’

The trader, who disseminates his views on X, stresses that despite the evident pullbacks, the crypto market’s macrostructure remains “intact.”

This perspective comes at a time when most crypto assets, including Bitcoin, have experienced significant price drops over the past couple of days.

Navigating Resistance Levels: The Path To Growth

Crypto Rand’s leveraged the price action index of various cryptocurrencies, such as Cosmos (ATOM), Chainlink (LINK), NEAR Protocol (NEAR), Algorand (ALGO), and MultiversX (EGLD), among others to highlight his point.

Rand identifies multiple resistance levels in these assets’ trajectories, suggesting these as potential points for market turnaround. These resistance levels are categorized as major or minor, depending on the frequency and intensity of price actions historically observed at these points.

Despite the temporary pullbacks that these resistance levels might introduce, Crypto Rand views them as necessary pauses that allow the market to gather strength for future upward movements.

This perspective is particularly relevant in light of Bitcoin’s recent price behavior. The flagship cryptocurrency has seen a notable dip from its recent high of $44,000, currently trading just below $42,000.

Bitcoin (BTC) price chart on TradingView amid crypto market news

This downward trend has echoed across the crypto market, impacting other major assets like Ethereum including altcoins Rand mentioned like Chainlink, and Algorand.

Over the past 7 days, BTC and ETH have experienced declines of 4.4% and 2%, respectively. Meanwhile, Chainlink has seen a 6.9% drop during the same period, and Algorand has fallen by 4.1% in just the past 24 hours.

The Broader Perspective On Crypto Market Corrections

The sentiment that market corrections are a healthy and necessary aspect of growth is not exclusive to Crypto Rand. William Clemente, the co-founder of Reflexivity Research, echoes this viewpoint.

Clemente posits that the current market retraction, which could potentially bring Bitcoin’s price closer to $40,000, should “not be a cause for alarm.”

Clemente argues that this process is crucial for eliminating weaker market participants and reducing excess leverage, ultimately establishing a firmer foundation for future upward trends.

Clemente further articulates that the inherent volatility of Bitcoin should be perceived as “a feature, not a bug”. It is worth noting that this stance reinforces the notion that the crypto market is still evolving and that such fluctuations are part and parcel of its journey towards maturity.

Featured image from iStock, Chart from TradingView

Ethereum Rising User Base Boosts Revenue Projections: Predicted To Double To $5 Billion

Bitwise Invest, an investment firm specializing in the crypto space, recently unveiled its anticipated crypto predictions for 2024.

These projections provide a glimpse into the future of the cryptocurrency industry, highlighting major milestones and potential breakthroughs for the largest cryptocurrencies such as Bitcoin (BTC), and Ethereum (ETH), and exchanges like Coinbase. 

Bitcoin Predicted To Smash Records

Bitwise’s first prediction suggests that Bitcoin will surpass previous records and trade above $80,000, setting a new all-time high. The firm attributes this bullish outlook to two key catalysts: the imminent launch of a spot Bitcoin exchange-traded fund (ETF) early in 2024 and the anticipated halving of new Bitcoin supply by the end of April. 

Furthermore, Bitwise expects the spot Bitcoin ETFs to be approved and to collectively become the most successful ETF launch in history.

Interestingly, Bitwise also forecasts that Coinbase, one of the largest cryptocurrency exchanges, will witness its revenue double, surpassing Wall Street expectations by at least 10 times. 

Ethereum

The firm points out that Coinbase’s trading volumes typically surge during bull markets, and they anticipate a similar trend in 2024. Additionally, Bitwise highlights Coinbase’s successful launch of various new products that have gained traction in the market.

On the other hand, the investment firm predicts that more money will settle using stablecoins compared to traditional payment giant Visa. Bitwise highlights stablecoins as one of crypto’s “killer apps” and notes their remarkable growth from virtually zero to a $137 billion market in just four years. Bitwise anticipates 2024 to be another significant year for stablecoin expansion.

Ethereum Set For Major Breakthrough

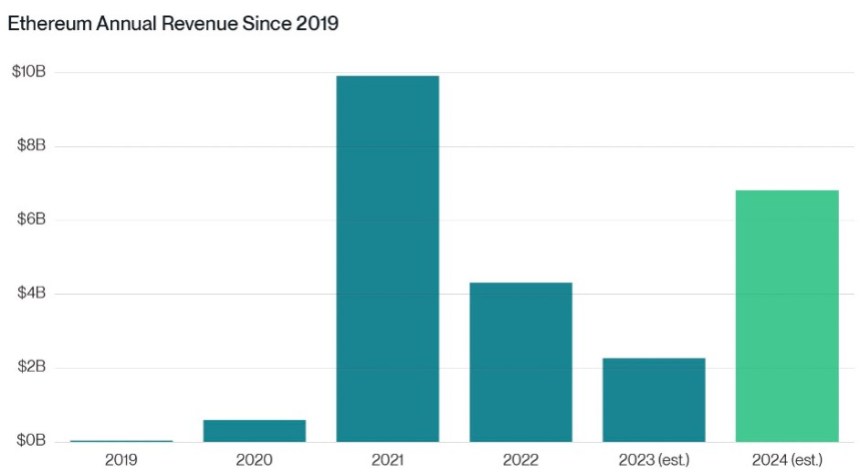
Bitwise expects Ethereum’s revenue to more than double from $2.3 billion in 2023 to $5 billion in 2024. The firm attributes this growth to the increasing number of users flocking to crypto applications. Bitwise emphasizes Ethereum’s potential as one of the fastest-growing large-scale tech platforms globally.

Ethereum

Furthermore, Bitwise anticipates a major upgrade to Ethereum, labeled EIP-4844, which could reduce average transaction costs to below $0.01. This significant cost reduction is expected to pave the way for mainstream adoption and the development of groundbreaking applications within the crypto ecosystem.

Bitwise’s bonus prediction suggests that by the end of 2024, one in four financial advisors will allocate funds to cryptocurrencies in their clients’ accounts. The firm foresees increased adoption by financial advisors once Bitcoin becomes easily accessible and mainstream.

Ethereum

In summary, Bitwise Invest’s crypto predictions for 2024 paint an exciting future for the cryptocurrency market. With expectations of a new all-time high for Bitcoin, the successful launch of spot Bitcoin ETFs, and revenue growth for industry giants like Coinbase and Ethereum, the crypto space is poised for significant advancements in the coming years.

As of the current update, ETH is trading at $2,200, reflecting a 1.4% increase over the past 24 hours. This positive movement follows a similar trend set by BTC. However, Ethereum has experienced a slight decline of 2.4% in the past seven days.

Featured image from Shutterstock, chart from TradingView.com 

Is A Mega Bull Run Incoming? Whale Transfers Over $780 Million Of Stablecoin To Binance

Data Nerd Data on December 13 shows that over the past 24 hours, the wallet “0xea8” moved 200 million BUSD from Binance, the world’s leading cryptocurrency exchange by client count.

The whale transfer caught the attention of keen crypto users, who also noted that the transfer was soon followed by a deposit of 99.95 million FDUSD, a stablecoin supported by the exchange.

Whale Address Accumulating FUSD Stablecoin On Binance

That the address is shuffling and accumulating large amounts of stablecoins is noteworthy. Data Nerd Data shows that the address has transferred over 781 million FDUSD to Binance in the last four months.

During this period, from around September, the crypto market has been recovering, edging higher on the back of improving fundamental factors.

The accumulation of over $781 million of stablecoin by the wallet controlled by an unknown individual or entity is overly bullish for crypto and Bitcoin prices.

It could suggest that a large institutional investor or group of investors is amassing stablecoins, potentially preparing for a significant market move.

Historically, large movements of stablecoins into centralized exchanges have often preceded major bull runs. 

Stablecoins are vital for crypto, ensuring there is enough liquidity. Since most are pegged to the USD and can be backed by fiat, these tokens, mostly minted on Ethereum or Tron, are often used as a gateway to crypto. Therefore, their accumulation can signal increased institutional interest and potential buying pressure.

Is A Mega Bitcoin And Crypto Rally In The Making?

That the wallet address is fortifying its FDUSD base reinforces the notion that institutional investors, ahead of the possible approval of the first batch of Bitcoin ETFs in the United States, could be increasingly warming up and preparing for leading coins like Bitcoin and Ethereum to extend gains in 2024. 

When writing on December 13, Bitcoin and top altcoin prices are relatively stable. To illustrate, Bitcoin is trending higher, stable above the $41,000 level after pulling back from 2023 highs of around $44,000. Crypto participants are bullish and expect Bitcoin prices to float even higher in 2024 before halving.

Bitcoin price trending upward on the daily chart | Source: BTCUSDT on Binance, TradingView

Binance will stop supporting BUSD in 2024. The exchange has also delisted USDC. Accordingly, USDT and FUSD are popular on Binance. However, the exchange continues to be on the Securities and Exchange Commission’s (SEC) crosshairs. 

In late November, the Department of Justice (DOJ) issued a $4.3 billion penalty on Binance as settlement with the SEC, Commodity Futures Trading Commission (CFTC), and other aggrieved agencies in the United States. The deal also saw Changpeng Zhao, the founder of Binance, step down from the CEO role.

Bitcoin Price Surges On Positive News: FASB’s Fair Value Recognition Reignites $42,000 Support Recovery

The Bitcoin price experienced a notable downturn as selling pressure intensified, resulting in a decline of over 4% from its annual peak of $44,500. This downturn was further exacerbated by the loss of the crucial $42,000 support level. 

However, the largest cryptocurrency in the market received a substantial uplift from the US Financial Accounting Standards Board (FASB), which has spurred a rapid 1.8% surge in BTC’s value within the past two hours. As a result, Bitcoin has successfully recovered the $42,000 support level.

FASB’s Fair Value Recognition Brings Clarity To BTC?

In a significant development for the cryptocurrency industry, the FASB has announced new accounting rules that require companies, including prominent entities like MicroStrategy, Tesla, and Block, to measure their cryptocurrency holdings at fair value. 

These rules, set to go into effect in 2025, allow businesses to capture the real-time highs and lows of their Bitcoin and Ethereum (ETH) assets, providing a more accurate representation of their holdings.

Under the previous accounting practices, companies were only allowed to record the lows, resulting in a one-sided accounting treatment that often led to reduced valuations and diminished earnings for businesses holding cryptocurrencies. The highly volatile nature of crypto values further exacerbated the issue.

The FASB’s new rules address these concerns by mandating the recording of cryptocurrencies at fair value, a measurement technique aimed at reflecting the most up-to-date value of these assets. 

Changes in fair value will now be recorded in net income, allowing companies to account for fluctuations in the value of their crypto holdings more comprehensively.

The positive news for BTC lies in the fact that the new FASB rules provide greater transparency and accuracy in assessing the true value of cryptocurrency assets. By capturing fluctuations in fair value, companies will have a more realistic representation of their holdings, enabling better decision-making and financial reporting.

Bitcoin, being the most widely recognized and valuable cryptocurrency, stands to benefit significantly from these changes. The recognition of its fair value allows companies to showcase the true worth of their BTC holdings, potentially boosting investor confidence and attracting further institutional interest.

Turbulent Times Ahead For Bitcoin Price

Following these recent developments, the Bitcoin price has successfully rebounded to previously lost levels, demonstrating heightened volatility after a brief consolidation phase just below $42,000.

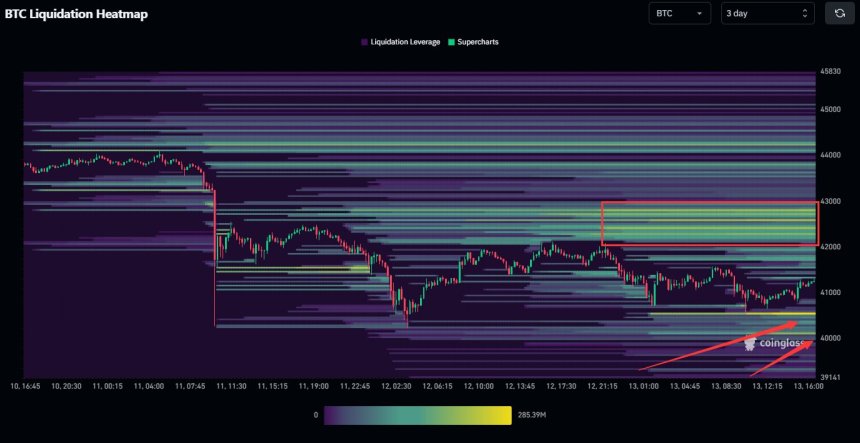
However, according to CoinGlass’ liquidation heatmap, Bitcoin’s price may be facing further volatility that could lead to a significant amount of liquidation of both long and short positions. 

Bitcoin price

The liquidation heatmap from CoinGlass highlights substantial indications of liquidation leverage exceeding $200 million both above and below the current Bitcoin price. 

Of particular concern is the thick liquidation leverage below $41,000, as seen in the chart above, which, combined with the prevailing trend, could become a probable target for the Bitcoin price in the coming days.

Conversely, following BTC’s correction, additional liquidation leverage has emerged in CoinGlass’s heatmap, particularly in the $42,000 and $43,000 range of short positions. This added selling pressure has contributed to the retracement of the Bitcoin price.

This potential scenario suggests a potential price swing up and down before a stable continuation of either the downward or upward momentum. The outcome remains uncertain as to which side will give way first and what prevailing trend will shape the latter part of the year.

Bitcoin price

Featured image from Shutterstock, chart from TradingView.com