
Coti will look to provide privacy-focused functionality to the Ethereum ecosystem as a new layer-2 protocol.
Cryptocurrency Financial News
Coti will look to provide privacy-focused functionality to the Ethereum ecosystem as a new layer-2 protocol.
Coti will look to provide privacy-focused functionality to the Ethereum ecosystem as a new layer-2 protocol.
Ethereum price is moving lower below the $2,250 support zone. ETH is now at risk of more downsides below the $2,120 support zone.
Ethereum price attempted a fresh increase above the $2,120 and $2,150 levels. ETH even climbed above the $2,200 level, but the bears were active near the $2,250 level. A high was formed near $2,252 and the price started a fresh decline, like Bitcoin.
There was a move below the $2,200 support zone. The price declined below the 23.6% Fib retracement level of the upward move from the $1,980 swing low to the $2,252 high.
Ethereum is now trading below $2,250 and the 100-hourly Simple Moving Average. There is also a key declining channel forming with resistance near $2,225 on the hourly chart of ETH/USD. If there is a fresh increase, the pair might face resistance near the $2,200 level.
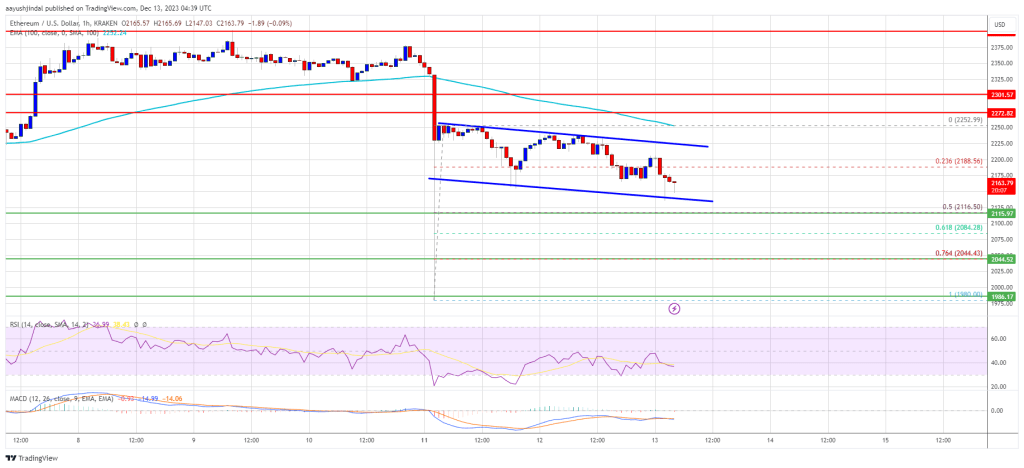
Source: ETHUSD on TradingView.com
The next key resistance is near the $2,225 level or the channel trend line. The main resistance is still near $2,250. A clear move above the $2,250 zone could send the price toward the $2,300 level. The next resistance sits at $2,350. Any more gains could start a wave toward the $2,500 level.
If Ethereum fails to clear the $2,225 resistance, it could continue to move down. Initial support on the downside is near the $2,120 level or the 50% Fib retracement level of the upward move from the $1,980 swing low to the $2,252 high.
The next key support is $2,045. The main support is now near $2,000. A downside break below $2,000 might start another major decline. In the stated case, Ether could revisit the $1,880 support. Any more losses might call for a test of the $1,820 support zone in the near term.
Technical Indicators
Hourly MACD – The MACD for ETH/USD is gaining momentum in the bearish zone.
Hourly RSI – The RSI for ETH/USD is now below the 50 level.
Major Support Level – $2,120
Major Resistance Level – $2,225
In decentralized finance (DeFi) and trading, Uniswap has long reigned as a dominant force. However, a recent analysis by Lark Davis, a Bitcoin (BTC) investor, seems to suggest Trader Joe, a decentralized exchange (DEX) on Avalanche–a highly scalable blockchain and Ethereum’s competitor, could eventually emerge as a formidable competitor, even overtaking Uniswap.
In a post on X on December 12, Davis noted a discrepancy in the relative valuation between JOE and UNI, which serve as governance tokens of Uniswap and Trader Joe. Specifically, the investors noted that Trader Joe’s handles around $300 million daily trading volume on Avalanche alone.
On the other hand, Uniswap processes approximately $1.6 billion in daily volume across the Ethereum mainnet and Arbitrum, the largest layer-2 platform by total value locked (TVL) by Ethereum.
Davis further noted that despite this “small” difference in trading volume, Trader Joe’s has a market capitalization of only $238 million. Meanwhile, Uniswap has a market cap of $3.6 billion, according to CoinMarketCap data.
Even with relatively narrow average trading volume, the huge difference in market capitalization suggests that JOE is significantly undervalued relative to UNI. Accordingly, this gap will likely be narrowed in the future, with JOE appreciating versus UNI, possibly benefiting holders.
Davis also pointed out JOE’s potential, saying the token rewards holders with USDC yields. This is different from UNI, where holders can vote on proposals and nothing else. In the investor’s preview, besides the undervaluation, this feature could further enhance JOE’s appeal, even contributing to its upside potential.
As the crypto market recovers, Avalanche might also present additional advantages to traders and, therefore, Trader Joe. The modern blockchain is scalable and has relatively low fees regardless of network activity. With crypto prices expanding, Ethereum gas fees have been rising in tandem, discouraging mainnet transfers. This has rerouted activity to layer-2s like Arbitrum and competing platforms, including Avalanche.
When writing on December 12, DeFiLlama data shows that Trader Joe has a TVL of $149 million, of which most assets are tied to Avalanche. Only $1 million is on Ethereum. JOE has been on an uptrend, rising 170% from October 2023 lows. The token is cooling off, looking at price action on the daily chart.
Shibarium, the Ethereum-based layer 2 blockchain solution from the Shiba Inu team, has achieved yet another major milestone, showcasing growing strength within the platform.
The Shiba Inu layer 2 platform has recently crossed a significant milestone in terms of total transactions processed as total transactions have increased dramatically over the past few weeks.
According to Shibariumscan – the network tracker, Shibarium has crossed over 90 million transactions performed in the platform since its introduction. Data from the network tracker shows that the number is currently sitting at approximately 90,677,816 as of the time of writing.
It is noteworthy that since December 2, the Shiba Inu blockchain has continuously maintained a whopping average of 7.5 million daily transactions. Currently, the total number of daily transactions revealed by the network’s tracker is totaled at 7.84 million transactions.
The network’s activity appears to be growing significantly, reaching major milestones over the past few weeks. Earlier this month, the total number of transactions in Shibarium was sitting at 66 million, indicating over 35% increase since this month.
Data from Shibariumscan also revealed an uptick in the network’s total blocks and wallet addresses. Shibarium’s total number of blocks is approximately 2,077,814, while the total number of wallet addresses is 1,305,042.
This kind of surge in transactions means that millions of BONE tokens were spent on transaction fees. As a result of this, it prepares the stage for the much-anticipated Shiba Inu token burn.
However, despite the recent surge in transactions, the Shiba Inu burn rate is still down in the past 24 hours. According to Shibburn, the SHIB token burn rate is down by 91% over the past 24 hours.
It is worth noting that Shiba Inu recently saw its highest burn rate ever since the initiative was introduced. Last week, the project saw an astounding 7,686,774% increase in burn rate, destroying about 8.35 billion SHIB tokens.
Last week, Shiba Inu announced that Shibarium will be adopting the Sepolia network. The team pointed out that Shibarium Puppynet will be moved from the Goerli Network to the Sepolia Network.
The goal of this adjustment is to be in line with more effective and scalable infrastructures, according to the team. Additionally, the transition will pave the way for more advanced solutions.
Furthermore, the move is not merely a transition, but an upgrade that will enable a more efficient and user-friendly environment. This is because of the growing demands of the blockchain community, particularly in fields such as NFTs and DeFi.
Sepolia provides a testing environment that is more stable and controlled, precisely replicating the Ethereum mainnet’s features and functionalities. Due to this, developers are guaranteed access to a dependable and consistent platform for testing their dApps and smart contracts. The team asserted that this strategic shift will become live on December 15, 2023.

A new Ethereum zero-knowledge proof compiler could address security concerns identified in different zkEVM solutions.
Ethereum price started a consolidation phase after a sharp decline. ETH must clear the $2,275 resistance to start a fresh increase in the near term.
Ethereum price started a sharp decline below the $2,300 pivot level, like Bitcoin. ETH declined heavily below the $2,220 and $2,200 levels. Finally, it tested the $2,000 support before the bulls emerged.
A low was formed near $1,980 and the price is now attempting a recovery wave. There was a move above the $2,120 and $2,150 resistance levels. The bulls pushed the price above the 50% Fib retracement level of the downward wave from the $2,400 swing high to the $1,980 low.
Ethereum is now trading below $2,320 and the 100-hourly Simple Moving Average. On the upside, the price is facing resistance near the $2,250 zone. There is also a key bearish trend line forming with resistance near $2,240 on the hourly chart of ETH/USD.
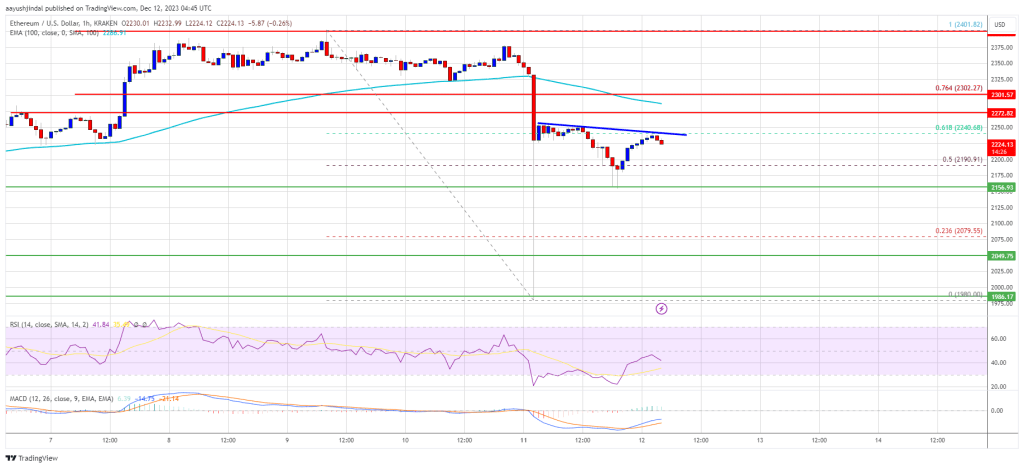
Source: ETHUSD on TradingView.com
The next key resistance is near the $2,275 level or the 76.4% Fib retracement level of the downward wave from the $2,400 swing high to the $1,980 low. A clear move above the $2,300 zone could send the price toward the $2,400 level. The next resistance sits at $2,450. Any more gains could start a wave toward the $2,500 level.
If Ethereum fails to clear the $2,275 resistance, it could start another decline. Initial support on the downside is near the $2,155 level.
The next key support is $2,120. The main support is now near $2,100. A downside break below $2,100 might start another major decline. In the stated case, Ether could revisit the $2,000 support. Any more losses might call for a test of the $1,880 support zone in the near term.
Technical Indicators
Hourly MACD – The MACD for ETH/USD is losing momentum in the bearish zone.
Hourly RSI – The RSI for ETH/USD is now below the 30 level.
Major Support Level – $2,155
Major Resistance Level – $2,275
Bitcoin is currently witnessing a decline in price, with its value dropping below the $42,000 mark. This movement comes on the heels of a significant uptick in the circulating supply of profitable Bitcoin, prompting a wave of profit-taking among investors.
ETC Group’s Head of Research, André Dragosch, highlights this trend, noting an increase in Bitcoin being moved to exchanges for potential sale. Dragosch noted, citing data from Glassnode:
Overall exchange balances for bitcoin have clearly picked up, implying a net inflow of coins to exchanges over the past week. More specifically, around +14k BTC have flown into exchanges on a net basis according to data provided by Glassnode. This will likely exert some downside pressure on prices in the short term.
According to the ETC Group, the current market scenario presents a landscape where a substantial portion of Bitcoin and Ethereum addresses are profitable. Data from the firm indicates that 88.3% of BTC addresses and 77.6% of ETH addresses are currently profitable, figures hovering near the highest for the year.
This environment of a high percentage of BTC and ETH addresses being in a state of profit has seemingly encouraged a segment of investors, particularly those with a short-term investment perspective, to capitalize on their gains, as indicated by the ETC Group’s analysis.
The ETC group further revealed that these short-term investors, defined as those who have held Bitcoin for less than 155 days, have been transferring their profitable assets to exchanges at a rate not seen since July of this year.
This surge in selling pressure is attributed to a key factor restraining the Bitcoin rally as the market adjusts to the increased availability of the cryptocurrency.
Further illustrating the market’s reaction, the past week marked the first instance of “net outflows” from crypto asset exchange-traded products (ETPs) since early October.
The total amount of these outflows was approximately $18.2 million, with Bitcoin ETPs experiencing the majority of these withdrawals, totaling $13.1 million. In contrast, Ethereum ETPs saw a “net inflow” of $5.8 million, suggesting a diverging investor interest between the two leading crypto.
The recent decline in Bitcoin’s price from its previous high of around $44,000 has impacted investor sentiment and resulted in significant trader liquidations. According to data from Coinglass, over the last 24 hours, there have been 115,873 trader liquidations, culminating in roughly $424.67 million in total liquidations.
Bitcoin has led these liquidations, with $105.51 million in long liquidations and $14.95 million in short liquidations. Ethereum follows closely, accounting for $78.53 million in long and $7.41 million in short liquidations.
It is worth noting that these liquidations and the fluctuating market dynamics underscore the division of trader’s fate in the crypto market. While some investors seize the opportunity to realize profits, others face the challenges of rapid market shifts.
Featured image from Unsplash, Chart from TradingView
In a recent blog post, ETC Group’s Head of Research, Andre Dragosh, provided a comprehensive analysis of the current state of the crypto market. Dragosh’s findings shed light on the market’s performance dynamics, profit-taking activity, and derivative trends.
According to Dragosh’s analysis, crypto assets showcased their resilience as they outperformed traditional assets like equities, supported by a significant repricing in monetary policy expectations and short futures liquidations at the beginning of last week.
However, this outperformance encountered some limitations in the short term due to stronger-than-expected US jobs data, which began to dampen the recent rally. The US non-farm payroll growth and unemployment rate surpassed consensus estimates, leading to a reversal in US Treasury yields and a decrease in overall risk appetite across traditional financial markets.
Notably, altcoin outperformance gained momentum during the period, with Avalanche (AVAX) and Cardano (ADA) returning over 50% each. Among the top 10 crypto assets, Avalanche, Cardano, and Polkadot (DOT) stood out as the relative outperformers.
According to Dragosh, this surge in altcoin outperformance compared to Bitcoin (BTC) indicates a “high-risk appetite” within the crypto market. On the other hand, on-chain data for Bitcoin suggests that investors are increasingly taking profits, evidenced by the rising number of coins in profit being sent to exchanges.
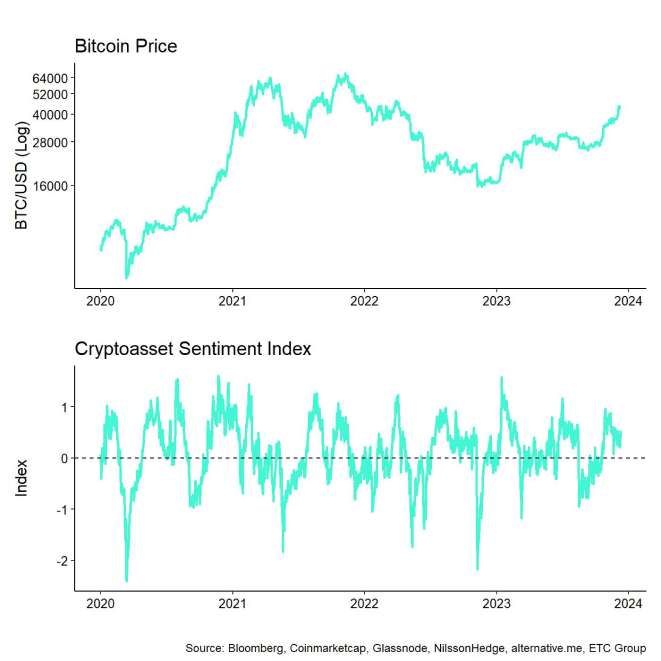
ETC Group’s in-house Crypto Asset Sentiment Index remained relatively elevated compared to the previous week, indicating positive market sentiment. However, major reversals to the downside were observed in the Crypto Dispersion Index and the BTC 25-delta 1-month option skew.
The Crypto Fear & Greed Index continued to reside in “Greed” territory, reflecting ongoing market optimism. Although ETC Group’s Cross Asset Risk Appetite (CARA) measure declined slightly, it remained in positive territory, signaling a decrease in risk appetite in traditional financial markets.
Performance dispersion among digital assets decreased compared to the previous week but remained relatively high. This implies that correlations among crypto assets have decreased, and investments are driven by coin-specific factors, highlighting the importance of diversification among digital assets.
The market remains in a strong profit environment, with a significant percentage of BTC and ETH addresses in profit. According to Dragosh, profit-taking activity, particularly among short-term holders, has increased as Bitcoin approaches recent highs, leading to higher selling pressure.
Long-term holders have also increased their transfers of profitable coins to exchanges, potentially hindering short-term price increases. However, it is worth noting that there is no evidence of older coins being spent, which would indicate a larger price correction.
On the other hand, aggregate open interest in BTC futures and perpetual remained stable, with notable futures short liquidations recorded. BTC option open interest saw a significant increase, accompanied by relative put-buying and an increase in the put-call open interest ratio.
The 25-delta BTC option skews also increased, indicating higher demand for puts compared to calls. However, overall at-the-money (ATM) implied volatilities did not change significantly.
At the time of writing, BTC has lost its $42,000 support line, trading at $41,600, down 5% in the last 24 hours.
Featured image from Shutterstock, chart from TradingView.com

Bitcoin’s sharp correction surprised investors, but is it a sign that further downside is in store?
Bitcoin’s sharp correction surprised investors, but is it a sign that further downside is in store?
Bitcoin’s sharp correction surprised investors, but is it a sign that further downside is in store?
Bitcoin (BTC) recently experienced a sharp decline, tumbling towards $40,000 amid a broader sell-off across the cryptocurrency market. While the most significant token managed to recover some losses, currently trading 4% lower at $42,000, concerns persist regarding the potential for further downside price action before a potential recovery.
According to a recent CoinShares report, digital asset investment products witnessed their 11th consecutive week of inflows, totaling $43 million. Notably, there was a significant increase in short position inflows due to recent price appreciation and perceived downside risks.
Europe led with $43 million in inflows, followed by the US with $14 million (with half in short positions). On the other hand, Hong Kong and Brazil experienced outflows of $8 million and $4.6 million, respectively.
Bitcoin remained the primary focus for investors, attracting $20 million in inflows, bringing the year-to-date inflows to $1.7 billion. Short-Bitcoin positions saw $8.6 million in inflows, suggesting some investors view the current price rises as unsustainable.
Ethereum (ETH) also saw increased interest, with its sixth week of inflows totaling $10 million, marking a turnaround from previous outflows.
According to Satoshi Club, there are indications that miners are selling their Bitcoin holdings following the recent price drop. Data shows a significant decrease in miners’ BTC holdings, with increasing flows to exchanges, suggesting selling pressure in the market.
Satoshi Club’s analysis highlights that this trend could be attributed to the anticipated halving in 2024, which will reduce miners’ rewards by half.
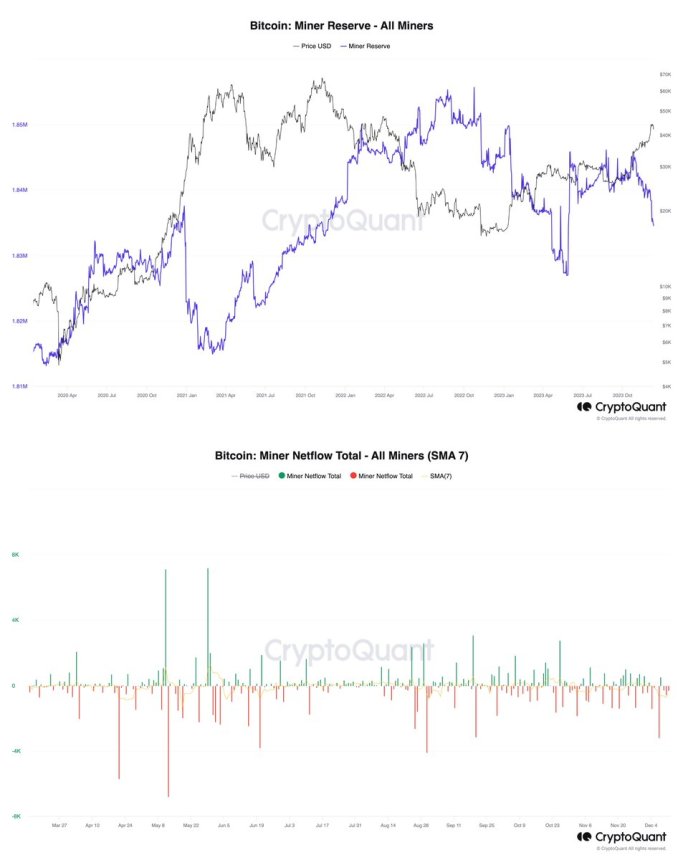
Additionally, Bitcoin’s net unrealized profit/loss, which indicates the investor profit ratio, has surpassed 0.5 for the first time since December 2021. This suggests that a significant portion of Bitcoin investments are currently profitable, potentially leading to increased selling pressure at current price highs.
BTC’s Bullish Structure Intact, But Deep Correction Threatens Run
In the 1-day chart for Bitcoin, the current trading price is closely aligned with a support level. Despite briefly dipping below this level, Bitcoin has managed to recover and trade above it, mitigating further declines.
However, in the event of continued selling pressure and an inability to maintain its current price level, Bitcoin’s next critical level of support would be $39,990.
It is worth noting that during the previous hype surrounding Bitcoin’s milestone, many traders entered long positions below the current levels. This influx of long positions could trigger a liquidation hunt before a recovery ensues.
If such a scenario unfolds, the hunt for liquidations could drive Bitcoin’s price further down, potentially testing support levels at $38,700 and $37,800.
On a positive note, Bitcoin’s current bullish structure would remain intact unless a significant correction occurs, pushing the price below the $29,900 level. This level began Bitcoin’s current bull run in late October.
The future outcome hinges on whether Bitcoin can successfully hold its nearest support levels and facilitate a recovery that shifts the focus from hunting long positions to hunting short sellers, eventually regaining previously conquered territories.
Featured image from Shutterstock, chart from TradingView.com
The Ethereum price has been among the worst hit in the flash crash that took place on Monday. The crash sent the asset’s price down below $2,200 for the first time in the last week and has continued to trend low around this point. As the market shows a bit of recovery momentum, questions remain about what could have triggered the crash.
One of the most obvious causes of the flash crash that affected the Ethereum price is the fact that large holders have been selling. This month, ETH hit its highest level in the last year and this sent a lot of investors back into profit. Now, since there has not been a complete bullish turnover of the crypto market, there are expectations that the market could crash and investors are trying to secure profits before this happens.
Crypto analyst Ali Martinez flagged the selling from these large holders in a post on X (formerly Twitter) on Sunday. According to him, these large holders had actually begun selling when the price had first crossed $2,300. This means that the selling pressure had been mounting for a while before being reflected in the price.
The whales who hold more than 10,000 ETH in their balances had been reducing their holdings toward the end of November. By December, their holdings had fallen to their lowest point in the last three months, showing proof of massive sell-offs by these whales.
Macroeconomic uncertainty has also played a role in the crypto crash that sent the Ethereum price to $2,200. One example of this is the CPI data release that is expected to take place on Tuesday. As investors eagerly await the results from the announcement, market fluctuations are expected.
The November inflation data is also expected to be released this week, as well as the Fed’s decision and statement happening on Monday. Ahead of these events, high volatility is always expected as investors move to secure some of their positions.
Nevertheless, Ethereum has begun to show some bullish momentum once more. It has since bounced from its lows of $2,170 and is back up above $2,000, where bulls are already providing a lot of support. If Bitcoin’s price continues to rise, Ethereum could reclaim the $2,300 level before the day is over.
The price of ETH is sitting at $2,238 at the time of this writing, down 4.50% in the last 24 hours.
Ethereum price took a major hit like Bitcoin and dropped over $350. ETH tested the $2,000 support and is currently attempting a fresh increase.
Ethereum price climbed further higher above the $2,300 level. ETH even cleared the $2,350 level but the bears remained active near the $2,400 zone. A high was formed near $2,401 and there was a sharp decline like Bitcoin.
The price declined over 8% and there was a move below the $2,200 level. Besides, there was a break below a key bullish trend line with support near $2,340 on the hourly chart of ETH/USD. The pair even spiked below the $2,000 support before the bulls appeared.
A low was formed near $1,980 and the price is now attempting a recovery wave. There was a move above the $2,150 and $2,180 levels. The price climbed above the 50% Fib retracement level of the downward move from the $2,401 swing high to the $1,980 low.
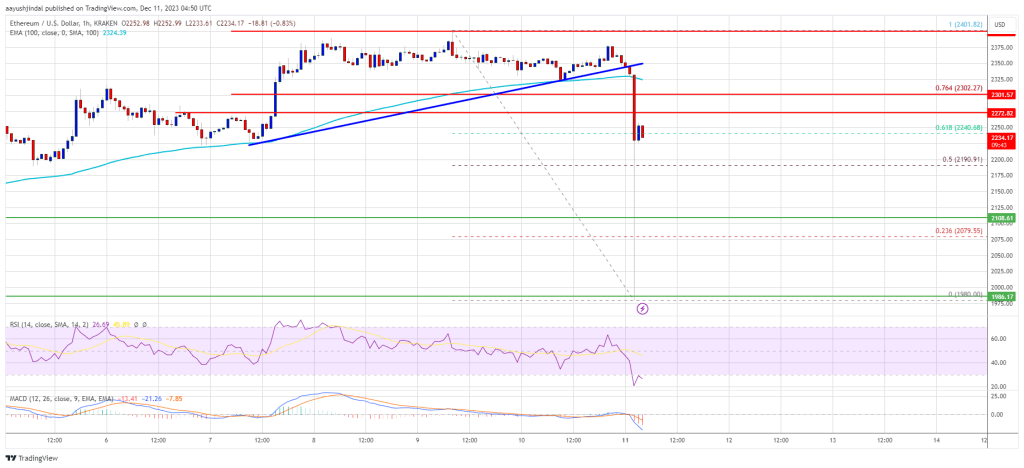
Source: ETHUSD on TradingView.com
On the upside, the price is facing resistance near the $2,275 zone. The next key resistance is near the $2,300 level or the 76.4% Fib retracement level of the downward move from the $2,401 swing high to the $1,980 low. A clear move above the $2,300 zone could send the price toward the $2,400 level. The next resistance sits at $2,450. Any more gains could start a wave toward the $2,500 level.
If Ethereum fails to clear the $2,300 resistance, it could start another decline. Initial support on the downside is near the $2,180 level.
The next key support is $2,120. The main support is now near $2,100. A downside break below $2,200 might start an extended decline. The key support is now at $2,000, below which there is a risk of a move toward the $1,880 level in the near term.
Technical Indicators
Hourly MACD – The MACD for ETH/USD is gaining momentum in the bearish zone.
Hourly RSI – The RSI for ETH/USD is now below the 30 level.
Major Support Level – $2,100
Major Resistance Level – $2,300
Bitcoin and Ether lead in liquidation heatmap with over $335 million in rekt positions in the last 12 hours.
Recent patterns indicate that the impetus fueling Ethereum’s climb is far from diminishing, and the price trajectory of the cryptocurrency has shown resilience. Ethereum may not be as advanced as some of its L1 competitors, but it stands out from the crowd thanks to its large developer community, immense acceptance, and crucial role in DeFi and other blockchain-based applications.
At the time of writing, ETH was able to keep a strong footing at the $2,300 level, trading at $2,347, nearly unchanged in the last 24 hours, but tallied a 10% increase in the last seven days, data from Coingecko shows.
There is still a lot of room for profit in the current bull market, even though Ethereum’s price spike hasn’t been as dramatic as other altcoin’s. Size, liquidity, and being the leading platform for smart contracts all contribute to Ethereum’s continued appeal as an investment.
This means that ETH’s price performance could be greatly enhanced by any further market increases. Ethereum, according to technical research, is about to see growth, and it is now testing key resistance levels. Both retail and institutional investors would be interested if the price breaks out above these levels, as it could indicate that the positive trend would continue.
#Ethereum has scratched its way to $2,349, its highest level since June, 2022. The long-term trend of top non-exchange whale wallets getting richer, and top exchange whale wallets having less sell-off power, is a promising combo for a continued climb. https://t.co/h7ogbqPLWf pic.twitter.com/82plXmVn02
— Santiment (@santimentfeed) December 7, 2023
For the first time in more than a year, Ethereum’s price has moved into a new range. The accumulation patterns seen in several top addresses indicate that this new range has created a chance for persistent price increases.
The most popular Ethereum addresses on exchanges and those outside of them have shown clear patterns of accumulation in the last several months, according to new data from Santiment.
A large number of top non-exchange addresses have been buying Ethereum at different prices, which has caused their holding volume of ETH to rise steadily and now surpass 54 million.
At the same time, following their most recent execution layer meeting on December 8, Ethereum developers have laid out a detailed strategy for the network’s future in 2024, including new suggestions, major upgrades, and more.
Meanwhile, Ethereum is predicted to significantly outpace mega-cap tech stocks. After the Bitcoin miners’ payouts are halved, investment firm VanEck thinks Ethereum will soar. In the past, this has caused a fresh spike in the price of Bitcoin, with the proceeds going into altcoins.
Ethereum won’t surpass Bitcoin, despite surpassing large stocks, and what “flippening” rumors claim. It is still believed that Bitcoin will continue to lead in market capitalization even though there is a chance that ETH may gain value in daily transaction volume.
(This site’s content should not be construed as investment advice. Investing involves risk. When you invest, your capital is subject to risk).
Featured image from Shutterstock
In this exploration, we tackle the critical question: Will Ethereum recover? We’ll look at Ethereums future and analyze ETH’s present market status, potential for resurgence, the anticipated impact of the progress on Ethereum 2.0, and share expert price predictions.
The question “Will Ethereum recover?” depends on numerous factors. As of November 2023, Ethereum has shown signs of rebounding from its 2022 lows, suggesting a potential bottoming out. Key developments like the transition to Proof-of-Stake and the introduction of EIP (Ethereum Improvement Proposal) 1559, launched all the way back in August 2021, which brings deflationary pressure on Ethereum’s supply, making it a more attractive investment.
Additionally, Layer 2 (L2) technologies are enhancing Ethereum’s scalability, addressing previous challenges of high transaction fees and slow speeds. Ethereum’s dominance in the smart contracts sector and its substantial role in the decentralized finance ecosystem further strengthen its recovery prospects. However, predicting the exact trajectory of Ethereum’s recovery remains complex, with varying forecasts suggesting both potential ups and downs in the near future.

Ethereums Future: Top-10 Factors Impacting ETH Price
These ten factors could be crucial for answering the question “Will Ethereum recover?“:
#1 Future Upgrades:
Ethereum’s development roadmap includes significant upgrades like Proto-Danksharding, also known as EIP-4844, and Full Danksharding, which could greatly impact its scalability and functionality. The successful implementation of these upgrades can boost confidence in the network and the Ethereums future price.
#2 Regulatory Approvals:
Regulatory decisions, such as the approval of a spot Ethereum Exchange Traded Fund (ETF) in the United States by the Securities and Exchange Commission (SEC), can have a substantial impact on Ethereum’s status as a digital asset. BlackRock filed for a spot ETH ETF in mid-November 2023.
#3 Overall Crypto Market Trends:
Ethereum’s performance is closely tied to the broader cryptocurrency market. A general uptrend in the crypto market, catalyzed by events like the Bitcoin halving, can positively influence Ethereum’s price.
#4 ETH Burn Rate:
Ethereum’s transition to a proof-of-stake (PoS) consensus mechanism includes a mechanism called EIP-1559, which introduces a fee-burning mechanism. The more ETH is burned in transactions, the scarcer it becomes, potentially increasing its value.
#5 Layer-2 Solutions:
The adoption and success of Ethereum layer-2 scaling solutions, such as Optimistic Rollups and zk-Rollups, can significantly improve the network’s scalability and reduce transaction fees. This could attract more users and developers.
#6 DeFi And NFT Activity:
Ethereum’s ecosystem heavily relies on DeFi (Decentralized Finance) and NFT (Non-Fungible Token) applications. Increased adoption and activity in these sectors can drive demand for ETH and positively impact its price.
#7 Competition:
Ethereum faces competition from other blockchain platforms like Solana and Cardano. The success or failure of these competitors can affect Ethereum’s market position.
#8 Macroeconomic Factors:
Economic events, such as inflation, monetary policy decisions, and global financial crises, can influence investors’ choices. Cryptocurrencies like Ethereum are sometimes seen as a hedge against traditional financial instability.
#9 Network Security:
The security of the Ethereum network is crucial. High-profile hacks or vulnerabilities can undermine trust in the platform and lead to price declines.
#10 Ecosystem Development:
The growth of the Ethereum ecosystem, including the number of dApps, users, and developers, can affect its adoption and value.
Ethereum’s burn rate is a key aspect of its economics, influencing both its supply dynamics and long-term valuation. To grasp the Ethereum burn introduced with EIP-1559, examining the latest data and understanding how this mechanism operates within the Ethereum ecosystem is crucial.
Ethereum Is “Ultra Sound Money”
EIP-1559 was a proposal that fundamentally restructured Ethereum’s fee market. Before this proposal, miners received the entire transaction fee. With activation on August 5, 2021, EIP-1559 introduced a base fee for transactions, which is burned (permanently removed from circulation), and only an optional tip is given to miners. This mechanism aims to make transaction fees more predictable and the network more efficient.
The “ultra sound money” meme emerged from the community in response to EIP-1559. It plays on the concept of “sound money,” a term traditionally used to describe money that is not prone to depreciation and is a reliable store of value, like gold.
With EIP-1559, Ethereum’s supply becomes more predictable and potentially deflationary—if the amount of ETH burned exceeds the new ETH issued, the total supply will decrease over time, hence the term “ultra sound money.” This is seen as an enhancement over “sound money,” with Ethereum not just maintaining its value but potentially increasing it due to the decreasing supply.
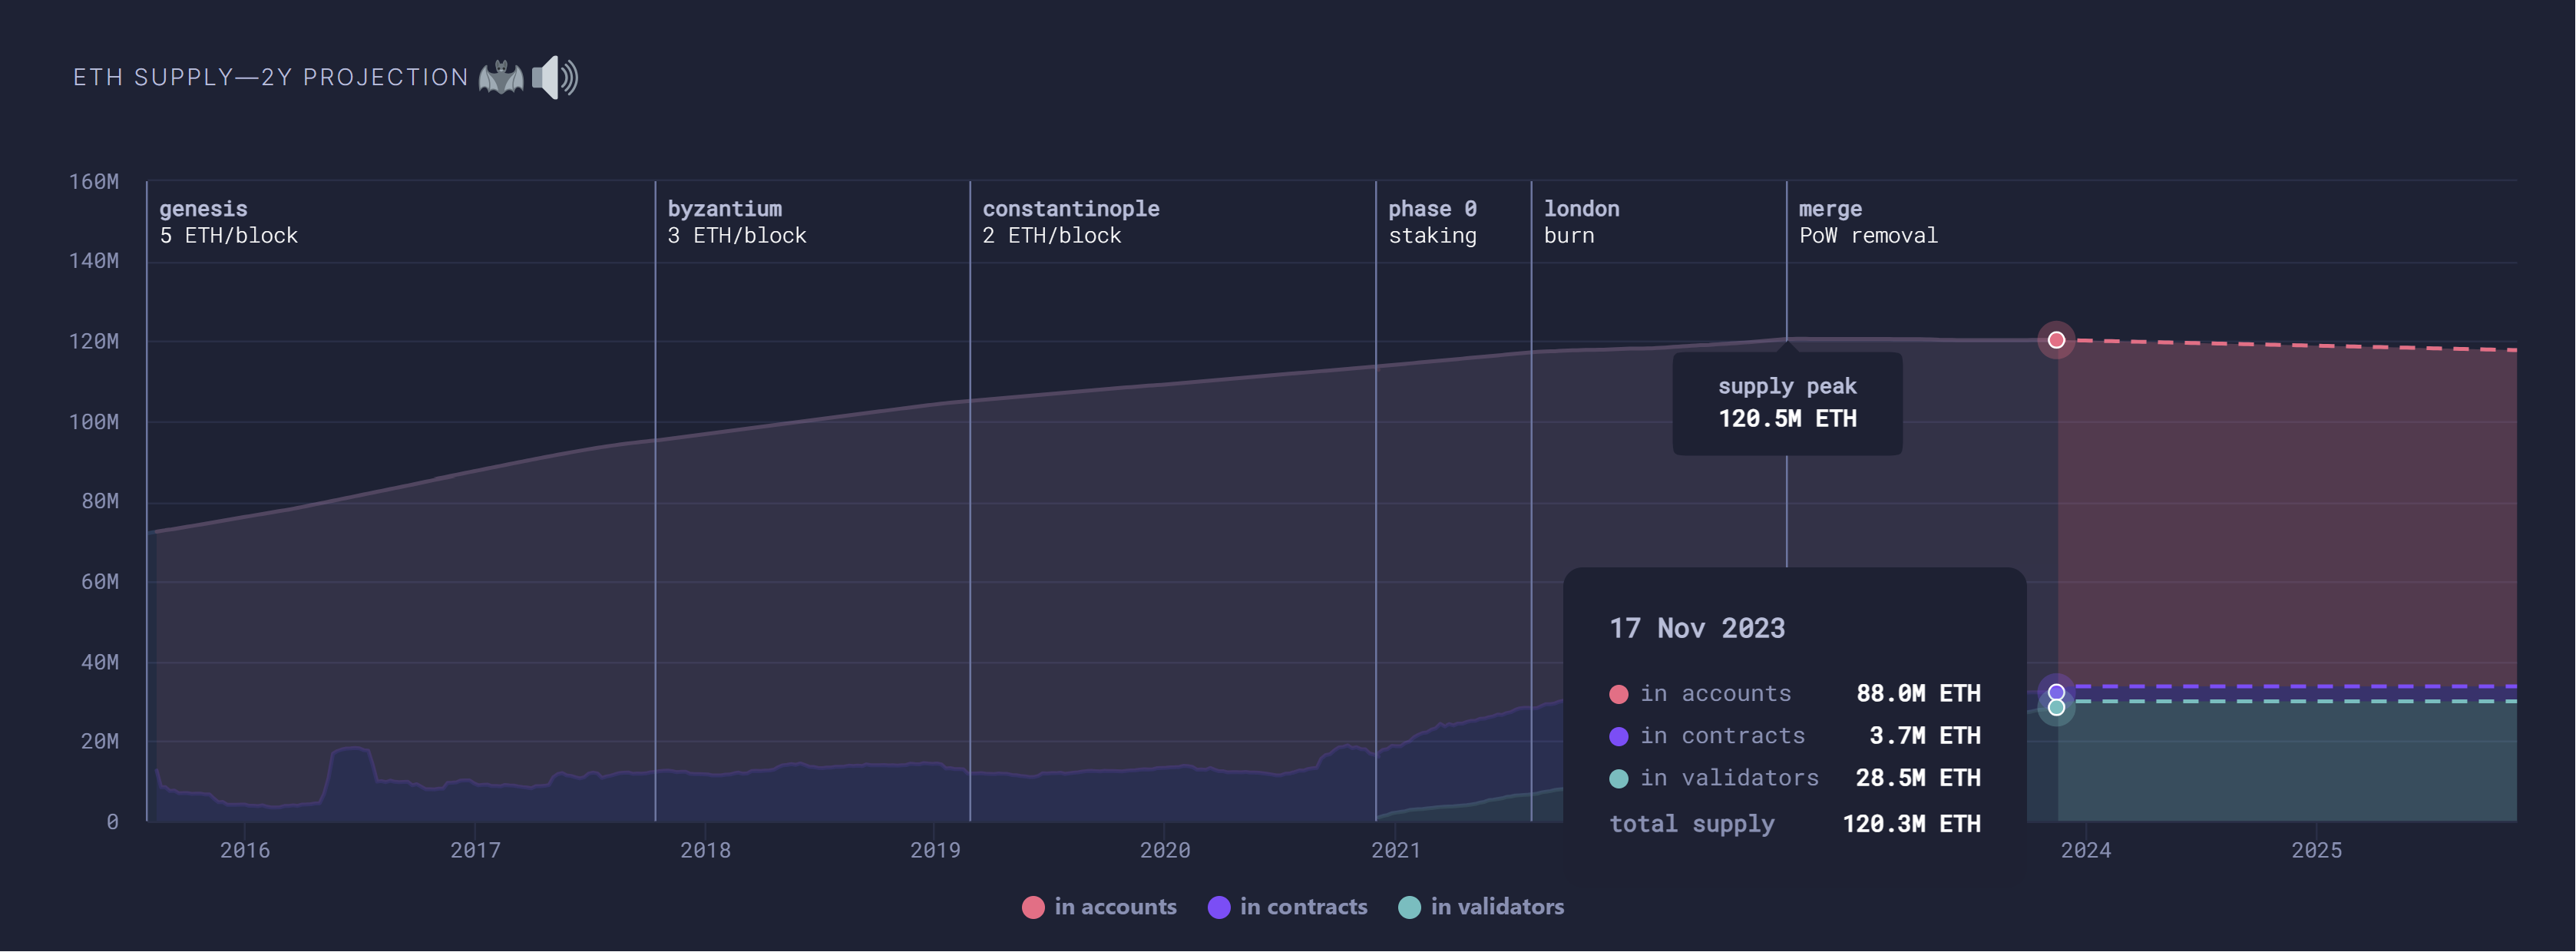
Ethereum Burn Rate Projections
The attached chart underscores the impact of these changes on Ethereum’s supply, especially post-EIP-1559, where the supply curve starts to flatten, suggesting a reduction in the growth of Ethereum’s total supply. This aligns with the concept of Ethereum becoming a deflationary asset post-EIP-1559, contributing to the narrative that Ethereum’s future could be as an “ultra sound” form of money.
On November 17, 2023, the Ethereum supply stood at 88 million ETH in accounts, 3.7 million ETH in contracts, and 28.5 million ETH in validators, totaling 120.3 million ETH. The dotted line indicates Ethereums future decrease in total supply due to the burning of ETH and the issuance changes post-Merge. The chart projects that the ETH supply will shrink to 117.7 million ETH in November 2025.
In the realm of cryptocurrency, technical analysis serves as a navigational tool to gauge market sentiment and potential price movements. Examining the 1-week ETH/USD chart provides insight into Ethereum’s price action and helps address the burning question: “will Ethereum recover?”
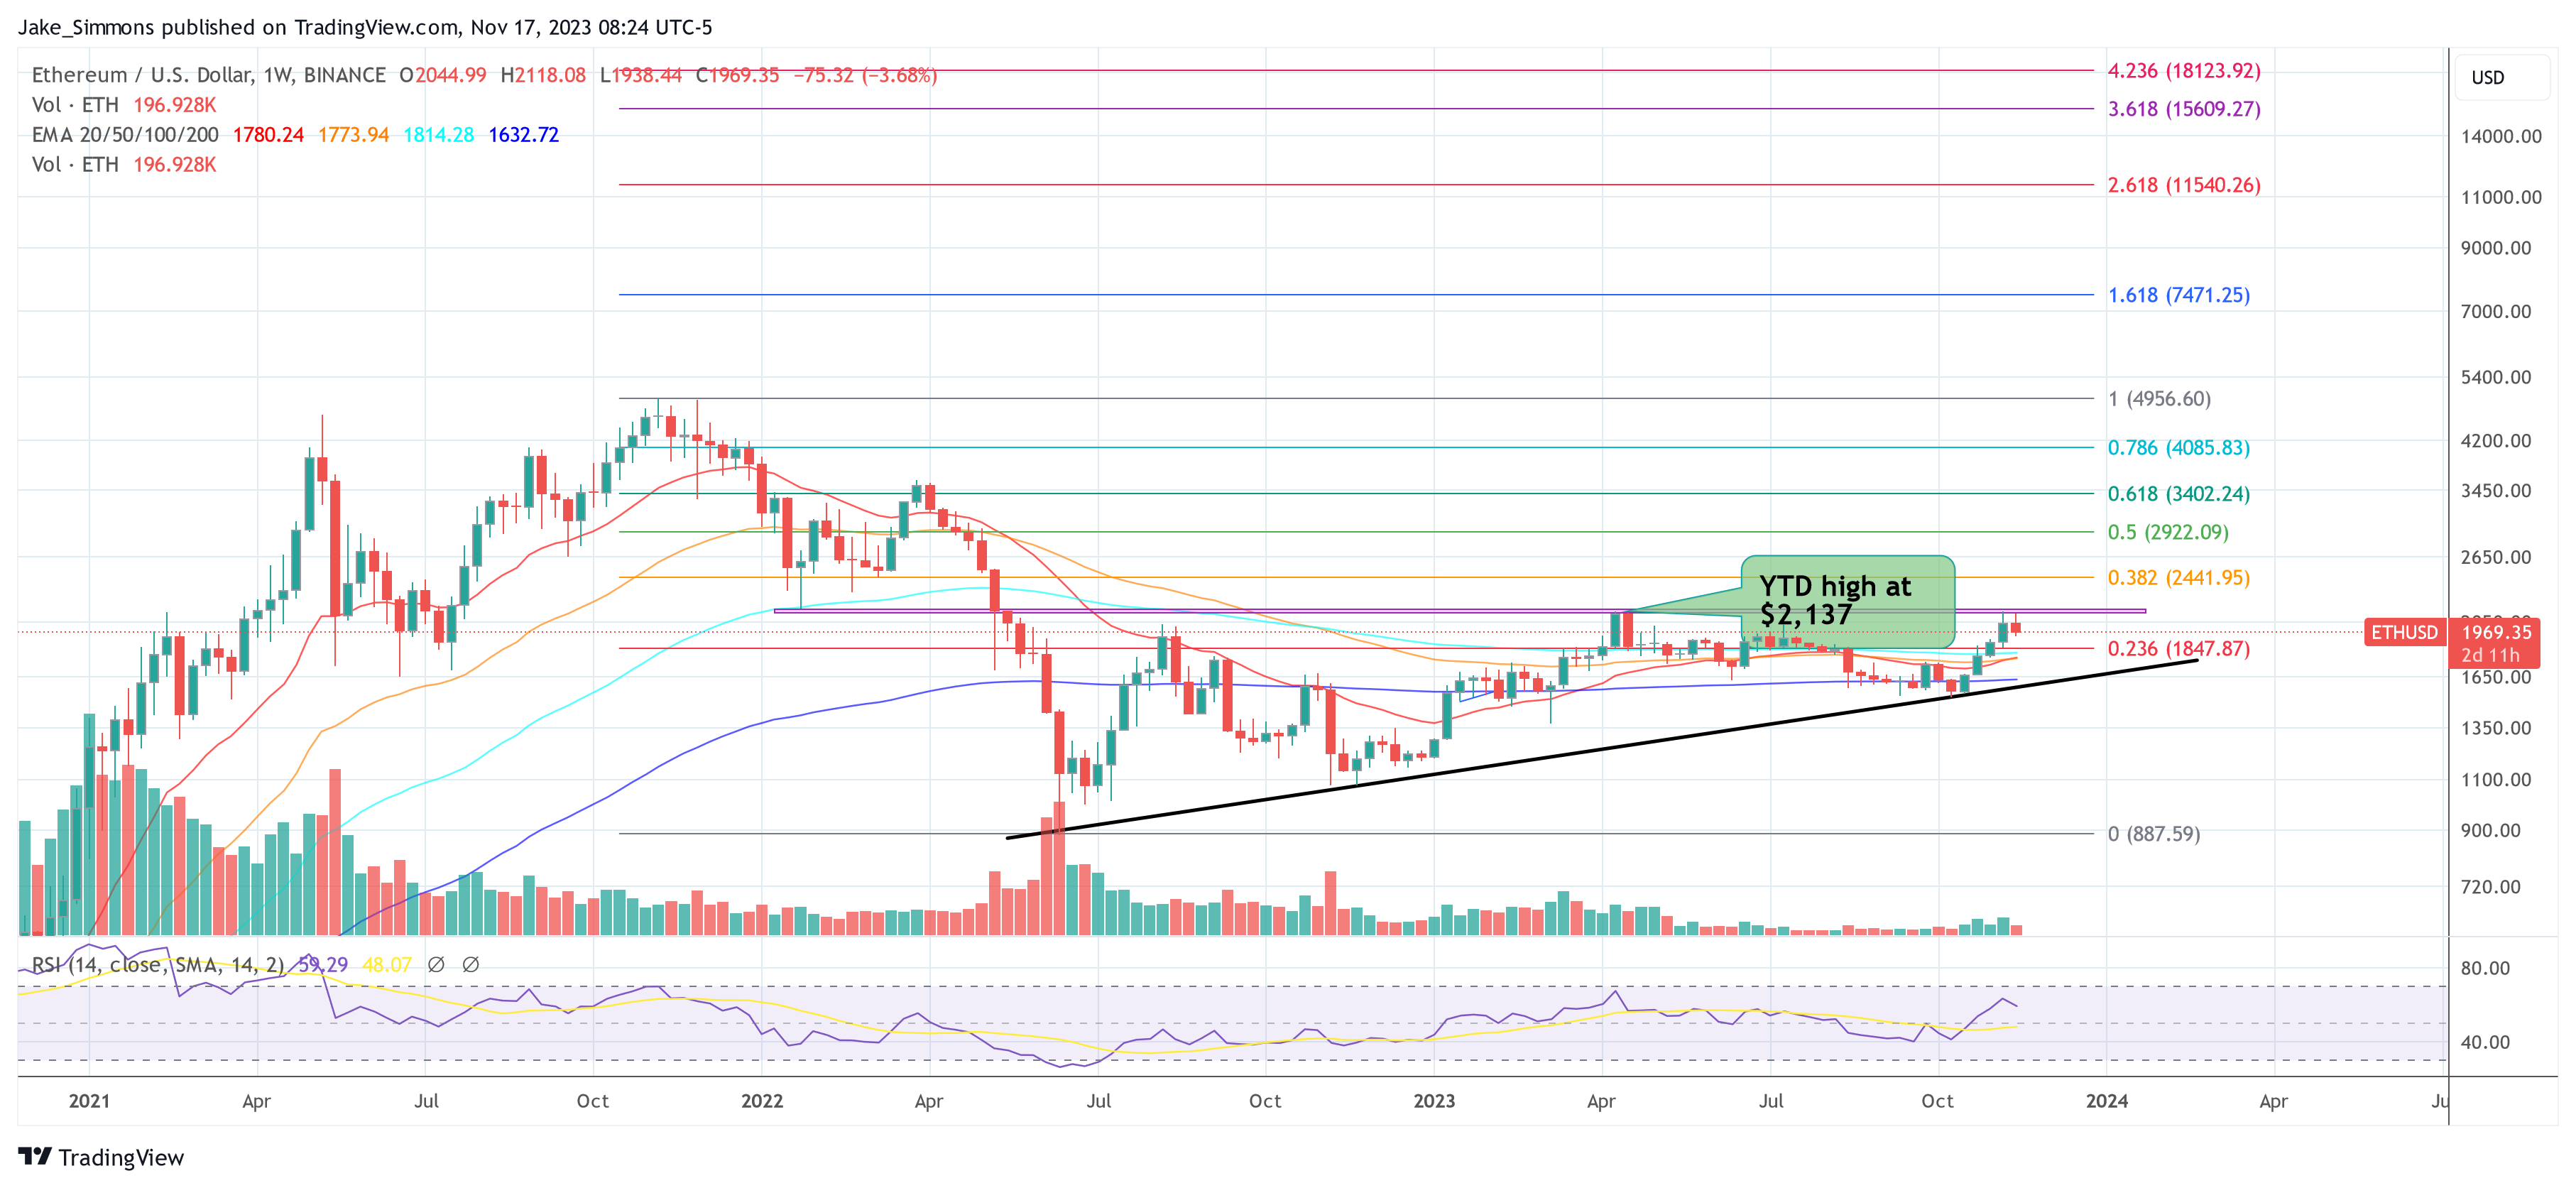
Fibonacci Levels And Price Targets
The chart showcases several Fibonacci retracement levels, which are crucial in identifying potential support and resistance zones based on previous price movements. Here are the key Fibonacci retracement levels highlighted:
Trend Lines, Resistance Zones And RSI
The chart shows a black ascending trend line, tracing the lows and signifying a potential area of support that Ethereum’s price could respect. If the price maintains above this line, it may indicate continued bullish sentiment.
The red box, or resistance zone, around the Year-To-Date (YTD) high at $2,137 underscores a region where sellers have previously entered the market. Overcoming this zone is critical for Ethereum to continue its upward trajectory.
The Relative Strength Index (RSI), sitting at 48.07, shows Ethereum is neither in the overbought nor oversold territory. This indicates a neutral momentum, which could precede a move in either direction.
Conclusion: Will Ethereum Recover?
While the chart presents strong arguments for an Ethereum bull run, with ETH price sustaining above critical support levels and challenging notable resistance zones, the future price action will depend on how the market interacts with these technical indicators. If Ethereum can break through the resistance encapsulated by the YTD high, we could see an affirmative answer to “Will Ethereum recover?” However, it is imperative for investors to monitor these levels closely, as they serve as a roadmap, not a crystal ball.
Tony “The Bull” Severino, NewsBTC’s Head of Research, has provided an in-depth analysis of Ethereum’s market behavior in his latest edition of Coin Chartist. He observes, “Ethereum has yet to begin trending with a reading above 20 on the ADX, nor has it broken above the upper Bollinger Band. But these signals are likely coming soon.” This suggests Ethereum’s significant uptrend might be on the horizon.
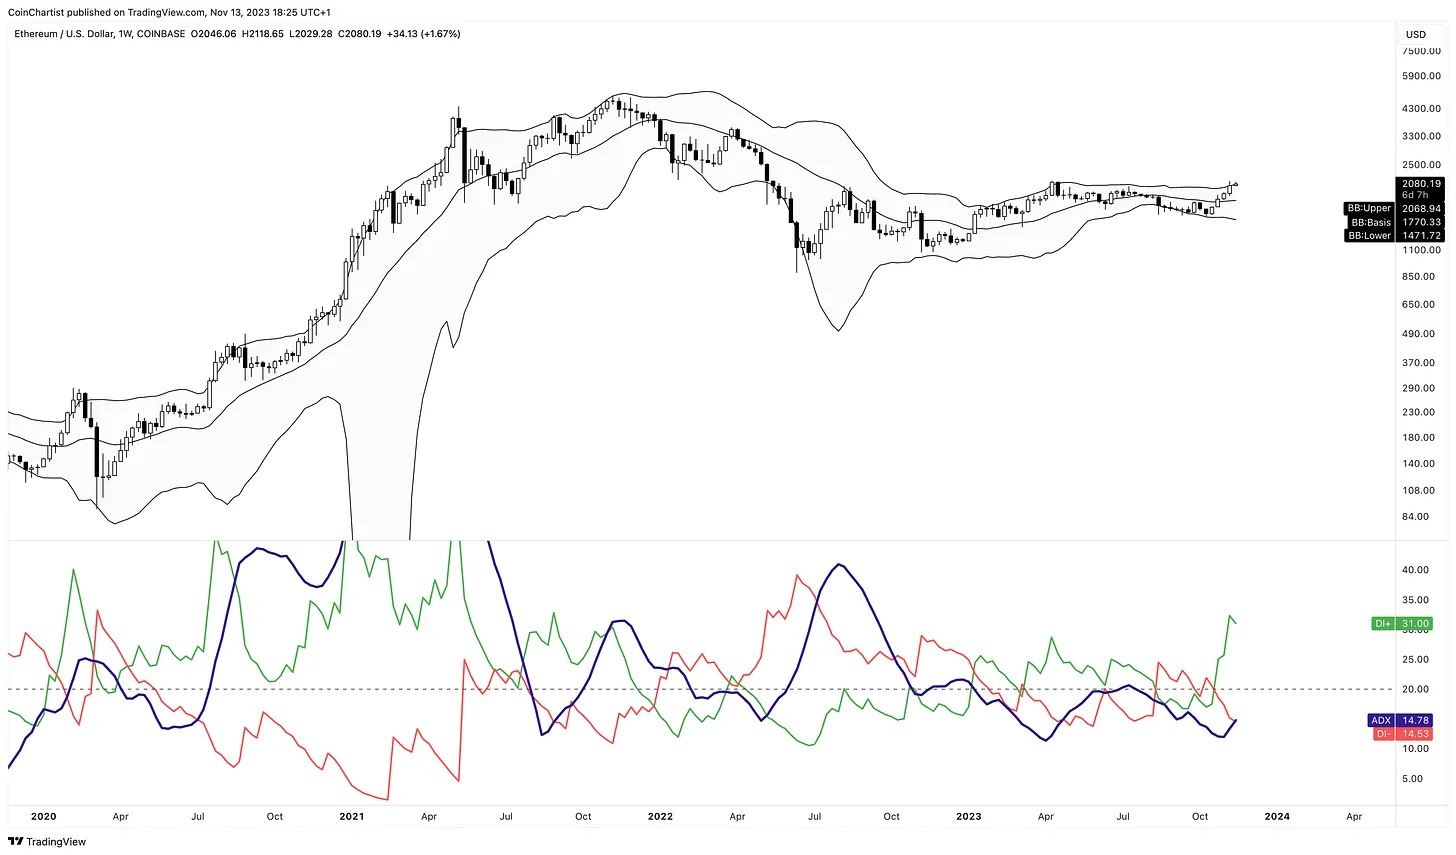
Comparing Ethereum with Bitcoin, Severino notes, “ETHUSD is much lower within the Ichimoku Cloud than BTCUSD,” indicating Ethereum is currently lagging behind Bitcoin. However, he anticipates Ethereum will soon “switch to over-performance.”
Highlighting a positive development, Severino states, “ETHUSD 1W was finally able to crack above its TDST downtrend resistance.” Yet, Ethereum needs to form a perfected TD9 series for further bullish confirmation. On the monthly chart, Ethereum’s overbought status on the Stochastic indicator suggests a strong trend, as Severino points out, “Each time the Stochastic has confirmed a 1M above 80 on the Stock, there was a massive push higher.”
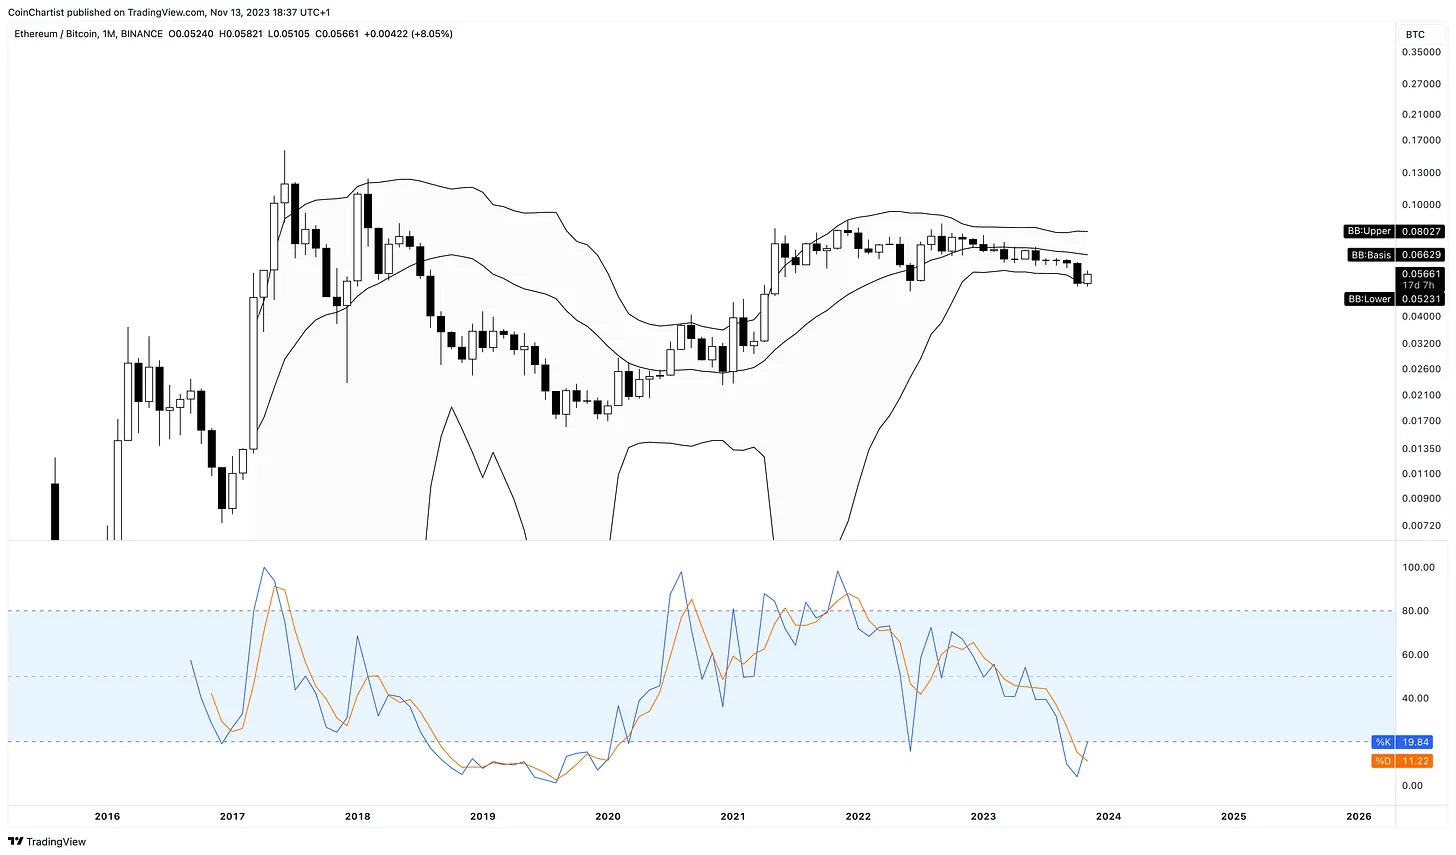
Looking ahead, Severino underscores the importance of Ethereum’s performance against Bitcoin, “But if ETHBTC can push back above 20 this will generate a buy signal on the 1M Stochastic and kickstart Ether’s over-performance above Bitcoin.” This analysis provides a detailed perspective on Ethereum’s potential future trajectory in the crypto market.
The continuous evolution of Ethereum through its 2.0 upgrades sets the stage for an optimistic price prediction. As the network becomes more scalable, secure, and sustainable, the intrinsic value of Ethereum is likely to increase.
The successful completion of the Shanghai/Capella upgrade, which introduced staking, is already a significant milestone that demonstrates the network’s commitment to its roadmap. Such advancements are expected to reinforce investor confidence and could catalyze a bullish outlook for Ethereums future price.
Ethereum 2.0 Roadmap
Ethereum 2.0 represents a series of upgrades aimed at improving the network’s scalability, security, and sustainability. Contrary to the previous term ‘ETH2’, the roadmap is now defined by more specific upgrade milestones:
Past and Completed Upgrades
The Merge: This critical upgrade on September 15, 2022 marked Ethereum’s transition from proof-of-work (PoW) to proof-of-stake (PoS) and was a foundational step in the Ethereum 2.0 roadmap, eliminating the need for energy-intensive mining.
Another key feature, staking withdrawals has already been enabled with the Shanghai/Capella upgrade, which went live on April 12, 2023
Future Ethereum Upgrades
The Ethereum community has replaced the term “Ethereum 2.0” with more specific names for each upgrade, providing clearer insight into the network’s transition and improvements. These upgrades aim to turn Ethereum into a fully scaled, resilient platform, capable of supporting a global decentralized application system. As implementation of these phases progresses, Ethereum’s growing appeal as an investment could positively influence its price predictions.
Proto-Danksharding: EIP-4844
EIP-4844 introduces “shard blob transactions” to enhance Ethereum’s data availability in a way that aligns with future full sharding plans. This proposal creates a new transaction format containing “blobs” – large data segments essential for rollups, a Layer 2 solution, but inaccessible for EVM execution. It serves as a temporary scaling solution, bridging the gap until full sharding implementation.
Notably, rollups have become increasingly important for scaling Ethereum, as they offer a way to execute transactions outside the main Ethereum chain (Layer 1) and then post the data back to Layer 1. EIP-4844’s format is expected to greatly reduce transaction fees for rollups by offering a cheaper data storage mechanism compared to current methods.
Full Danksharding
Full Danksharding, which advances from Proto-Danksharding, will likely further reduce costs for Layer 2 rollups. It introduces “blobs” in a format slated for use in the final sharding design. This includes a new transaction type and an independent fee market for these blobs.
Full Danksharding will build on Proto-Danksharding and aims to further cut Layer 2 rollups’ costs. It will comprehensively implement data availability sampling and essential components for a fully sharded Ethereum network, including proposer-builder separation and proof of custody. This approach aims to assign only a portion of the data to validators, reducing the network’s load and enhancing scalability.
As Ethereum continues to progress with its 2.0 upgrades, the financial community has been actively speculating on its future value. Here are some Ethereum price predictions from renowned institutions and analysts, answering the question “will Ethereum recover”:
VanEck: The investment management firm predicts that Ethereum’s price could reach as high as $11.8k by 2030. This projection is based on their assessment that Ethereum’s network revenues could rise from $2.6 billion to $51 billion in 2030, assuming Ethereum captures a 70% market share among smart contract platforms.
Standard Chartered: Analysts at Standard Chartered are bullish on Ethereum’s long-term potential. They forecast that the price of ETH could hit $4,000 by the end of 2024 and double to $8,000 by the end of 2026. Their Ethereum bull run prediction is based on Ethereum’s established dominance in smart contract platforms and the potential for emerging uses in areas like gaming and tokenization. Moreover, they suggest that the upcoming Bitcoin halving in April 2024 could positively impact the broader crypto market, especially Ethereum.
Also, the potential approval of a spot Ethereum ETF in the US could significantly impact Ethereum’s price. BlackRock, the world’s largest asset manager, filed for a spot Ethereum ETF in mid-November 2023. The approval of this ETF would mark a major milestone for Ethereum, potentially attracting more institutional and retail investments and substantially boosting Ethereum’s market price.
Will Ethereum recover?
Ethereum’s recovery depends on various factors including market trends, technological advancements, and broader economic conditions. With ongoing upgrades like Ethereum 2.0, many analysts remain optimistic about its long-term potential.
Will Ethereum Go Back Up?
Many market experts predict Ethereum will go back up. They are citing improvements from Ethereum 2.0 and increasing adoption in DeFi, NFTs and traditional finance.
Where Is Ethereum Going?
Ethereum is transitioning to a more scalable, secure, and sustainable network with Ethereum 2.0. This is potentially leading to increased adoption and value.
What Is The Ethereum Burn?
The Ethereum burn, introduced in EIP-1559, permanently destroys a part of transaction fees, potentially creating deflationary pressure on Ethereum’s supply.
Is Ethereum Going Back Up?
Current market predictions and the development roadmap suggest potential for Ethereum’s price to increase. But the exact trajectory will depend on multiple factors.
How Many Ethereum Burned So Far?
As of the latest available data, the Ethereum network has burned 0.2 million ETH tokens since implementing EIP-1559. The burn rate dynamically adjusts based on network activity.
When Will The Ethereum Bull Run Start?
The start of a bull run for Ethereum is speculative. It depends on market cycles, investor sentiment, and significant catalysts like upgrades and regulatory developments.
Will Ethereum Go Down?
Market volatility is inherent to cryptocurrencies. While Ethereum may experience downturns, its fundamental development aims to mitigate such risks and foster growth.
What Will Be The Future Price Of Ethereum?
Various predictions exist, ranging from moderate increases to high valuations by 2030. Standard Chartered predicts $8,000 per ETH by the end of 2026.
Is Ethereum Going To Go Back Up?
The general consensus among many analysts is positive. The value of Ethereum is expected to rise as it develops and becomes more widespread in the blockchain sector.


