Ethereum Price Prediction: Crypto Analysts Reveal Catalyst That Will Drive Price Above $3,500

A crypto analyst has singled out an event that could be the spark that Ethereum needs to hit the price level of $3,500. He believes that the second-largest cryptocurrency by market cap is going to make this run after Bitcoin “gets its shine.”

How Ethereum Will Hit $3,500

In a post shared on his X (formerly Twitter) platform, the CEO and founder of MN Trading, Michaël van de Poppe, alluded to the Ethereum Spot ETF filing by Fidelity in his price prediction of $3,500. The crypto analyst seemed to be suggesting that approval of an Ethereum Spot ETF could propel Ethereum’s price to such heights. 

His reference to Bitcoin also confirms that this might indeed be van de Poppe’s “thesis.” He spoke about Ethereum “running to $3,500 in Q1 2024” after Bitcoin has had its shine. The “shine” likely refers to the possible approval of a Spot Bitcoin ETF. Some analysts have predicted that there is a 90% chance that a Spot Bitcoin ETF will be approved by January 10, 2024.

With this in mind, the crypto analyst possibly believes that approval of an Ethereum Spot ETF could come not long after once the Spot Bitcoin ETF is approved. If that happens, it could spark a massive rally in Ethereum’s price. That could explain why Michaël van de Poppe is predicting Ethereum to run to $3,500. 

Several asset managers have already applied with the Securities and Exchange Commission (SEC) to offer an Ethereum Spot ETF. However, all eyes seem to be on the SEC’s decision on the pending Spot Bitcoin ETF applications. This could simply be because a final decision is expected on the pending Spot Bitcoin ETF applications, unlike Ethereum’s, which still have a longer review process.

Ethereum price chart from Tradingview.com

Ethereum Spot ETFs May Not Get The Same Reception

Historically speaking, there is reason to believe that Ethereum Spot ETFs might not enjoy the same reception that Spot Bitcoin ETFs have gotten so far. This is based on the fact that there was a stark comparison in the numbers when the futures ETF of both crypto tokens launched. 

Bitcoin futures ETFs were already in place as of 2021, with ProShares Bitcoin Strategy (BITO) ETF being the first to launch. Meanwhile, Ethereum futures ETFs just launched this year. What is most interesting is the trading volume that BITO saw on its launch date in comparison to all Ethereum futures ETFs on their launch date. 

BITO is reported to have seen more than $1 billion in trading volume in the first two days of launching. On the other hand, the total trading volume for Ether ETFs on their launch day amounted to just under $2 million

Ethereum ATH: Exploring The Possibility Of Ether’s New Peaks In 2024

Ethereum (ETH), the world’s second-largest cryptocurrency, is demonstrating robust momentum as its price stages a resurgence, reclaiming levels above $2,000.

This bullish trend gains traction concurrently with significant developments in the US Securities and Exchange Commission (SEC). The regulatory authority is engaging in discussions regarding the potential approval of a spot Ethereum Exchange-Traded Fund (ETF).

This pivotal development has injected optimism into the Ethereum market, as the prospect of an ETF introduces new possibilities for mainstream adoption and investment, further fueling the current upward trajectory of Ether’s value.

Ethereum’s Ascending Triangle: Bullish Breakout Potential

Over the course of several months, the price of Ethereum has been in a consolidation trend that has resulted in the formation of an ascending triangle. Although the technical formation is bullish by nature, this is only true following a profitable breakout.

Trend lines connect the equal highs and higher lows of the ascending triangle configuration. This arrangement indicates that investors are growing more confident and buying the dips at a faster pace.

Interestingly, today’s charts show there are no “dips” to buy, as Ethereum broke past the vaunted $2,000 level to welcome December on a high note.

Ethereum is not only keeping up, but also rising to unprecedented heights. The price of ETH is currently up 3% at $2,100, and investors and enthusiasts are excited about the possibility of a rally to $3,000 or even higher.

Ether’s impressive success against Bitcoin, outperforming the alpha cryptocurrency by almost 5%, is a major indicator of this. Important on-chain signals imply that ETH may continue to outperform BTC this month.

Fidelity Filing Fuels Ethereum Optimism

The first indication of a bullish move was a breakout over the psychological $2,000 barrier, although there has been a lot of see-saw motion around this level. More specifically, ETH is trading between the weekly support level at $1,930 and the high for the second quarter at $2,140. This is the fourth week in a row that this has been happening.

Crypto analyst Michael van de Poppe has voiced his optimism for Ethereum in light of the Fidelity filing. Given this submission, he affirms his conviction that after Bitcoin’s rapid increase, Ethereum is positioned to attain $3,500 throughout the initial quarter of 2024.

In a related development, research shows there has been a significant increase in Ethereum whale accumulation. On-chain data indicates that the biggest Ethereum wallets, according to Santiment, are showing a positive pattern that suggests a big change.

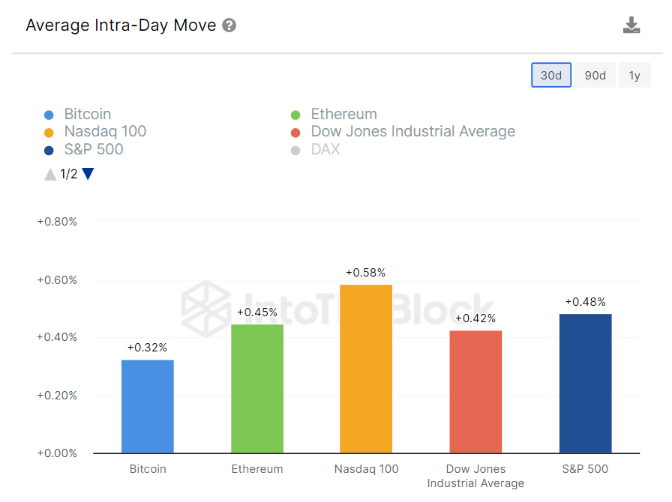
Meanwhile, Ethereum has an amazing 30-day Average Intra-Day Volatility score of 0.45%, surpassing Bitcoin’s 0.32%, a recent research by IntoTheBlock shows.

Investment strategies may need to change as a result of this change in volatility dynamics, which would highlight the Ethereum market’s dynamic prospects.

(This site’s content should not be construed as investment advice. Investing involves risk. When you invest, your capital is subject to risk).

Featured image from Freepik

Ethereum Price Momentum Reignites, RSI Signals Rally To $2,200

Ethereum price remained well-bid above the $2,020 level. ETH is now rising, and the bulls seem to be aiming for a move toward the $2,200 level.

  • Ethereum is making a fresh attempt to clear the $2,100 and $2,120 resistance levels.
  • The price is trading above $2,050 and the 100-hourly Simple Moving Average.
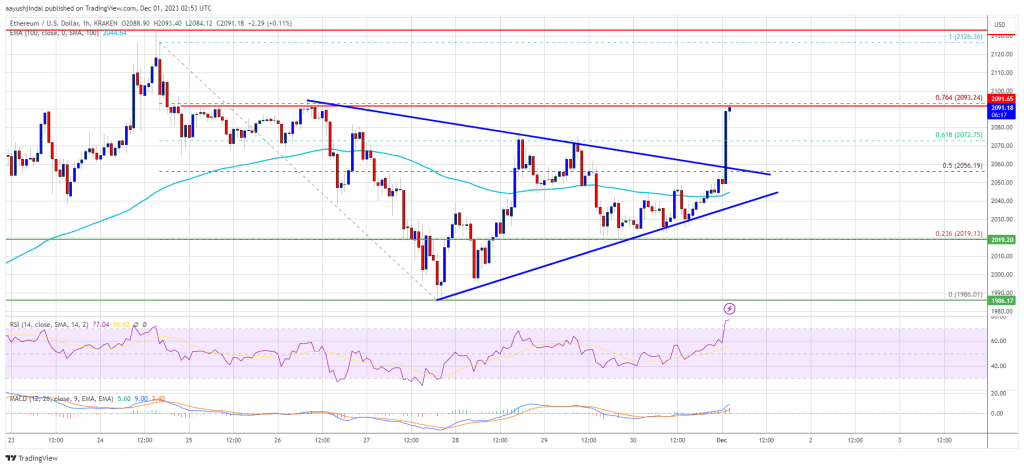
  • There was a break above a major contracting triangle with resistance near $2,055 on the hourly chart of ETH/USD (data feed via Kraken).
  • The pair could gain bullish momentum if it clears the $2,120 resistance zone.

Ethereum Price Regains Strength

Ethereum price started a downside correction below the $2,050 level. ETH tested the $2,020 support, where the bulls took a stand. A low was formed near $2,019 before the price climbed higher, like Bitcoin.

The price cleared the $2,050 resistance zone. There was a break above a major contracting triangle with resistance near $2,055 on the hourly chart of ETH/USD. The pair climbed above the 50% Fib retracement level of the downward move from the $2,126 swing high to the $1,986 low.

Ethereum is now trading above $2,050 and the 100-hourly Simple Moving Average. On the upside, the price is facing resistance near the $2,095 zone or the 76.4% Fib retracement level of the downward move from the $2,126 swing high to the $1,986 low.

The first key resistance is near the $2,100 level. The next resistance sits at $2,120. A clear move above the $2,120 level could send the price toward the $2,200 resistance zone.

Ethereum Price

Source: ETHUSD on TradingView.com

The next resistance is near $2,250, above which the price could aim for a move toward the $2,320 level. Any more gains could start a wave toward the $2,440 level.

Another Decline in ETH?

If Ethereum fails to clear the $2,100 resistance, it could start another decline. Initial support on the downside is near the $2,055 level. The next key support is $2,040.

The main support is now near $2,000. A downside break below $2,000 might start a steady decline. The key support is now at $1,920, below which there is a risk of a move toward the $1,880 level in the near term.

Technical Indicators

Hourly MACDThe MACD for ETH/USD is gaining momentum in the bullish zone.

Hourly RSIThe RSI for ETH/USD is now above the 50 level.

Major Support Level – $2,050

Major Resistance Level – $2,120

dYdX To Unlock $478M Worth Of Tokens, Will Bears Have A Field Day?

On December 1, dYdX, the layer-2 decentralized exchange, will unlock 150 million DYDX worth roughly $478 million to early investors and core team members. This substantial unlock has raised concerns among investors, who fear the influx of fresh tokens could substantially increase supply.

If this is not matched by high demand, DYDX prices will likely pull back, reversing recent gains posted over the past few trading weeks. 

DYDX Worth $500 Million To Hit The Market

According to Bubblemaps data, out of the $478 million worth of DYDX, over 50% is allocated to venture capitalists (VCs), including Paradigm and Polychain. Zooming back and looking at their data, VCs seeded $100 million to the layer-2 decentralized exchange.

These tokens were distributed to private investors through five wallets, including Coinbase Custody, Investor Distribution, and the Foundation Wallet.

Currently trading at over $3, DYDX is at February 2023 levels and technically bullish. However, the upcoming token unlock casts a shadow over the token’s positive momentum.

Notably, dYdX, postponed its token unlock by ten months. According to data, the humongous DYDX unlock was initially postponed from February to December 2023. Following this move, DYDX prices edged higher.

Even so, prices pulled back before consolidating in the better part of Q2, Q3, and early Q4 2023. There was a pronounced rally in late October 2023 as DYDX rose, riding the optimism across the crypto board.

At spot rates, DYDX is up 82% from October 2023 highs. However, looking at price action, bears are retesting the 20-day moving average of the BB. A break below this level might trigger a sell-off, pushing prices back to October 2023 highs.

DYDX prices trending lower on the daily chart | Source: DYDXUSDT on Binance, TradingView

Which Way Could Take The Price Action?

While it is likely that prices could contract ahead or after the unlocking event, the team has devised a way of mitigating the expected selling pressure. To illustrate, the initial unlock will release 30% of the total amount. Afterward, there will be monthly equal releases over the next three years. 

 For optimists, however, that a significant portion of these tokens will go to the team, and investors could end up supporting prices. Team members and venture capitalists trade less frequently than retail investors, meaning the expected liquidation pressure, if any, could be limited.

Moreover, some team members and even early investors might consider re-staking DYDX from their infrastructure, giving them more control. 

Even with this release, crypto participants are upbeat, anticipating Bitcoin prices to track higher ahead of the expected spot Bitcoin ETF approval by the Securities and Exchange Commission (SEC). More tailwinds could result from the Bitcoin halving event in early Q2 2024.

Ethereum Price Rally In Jeopardy? Key Supports To Watch Out In Short-Term

Ethereum price corrected lower below $2,050. ETH is now consolidating above the $2,020 support and might start a fresh increase in the near term.

  • Ethereum is still struggling to climb above the $2,075 and $2,080 resistance levels.
  • The price is trading below $2,050 and the 100-hourly Simple Moving Average.
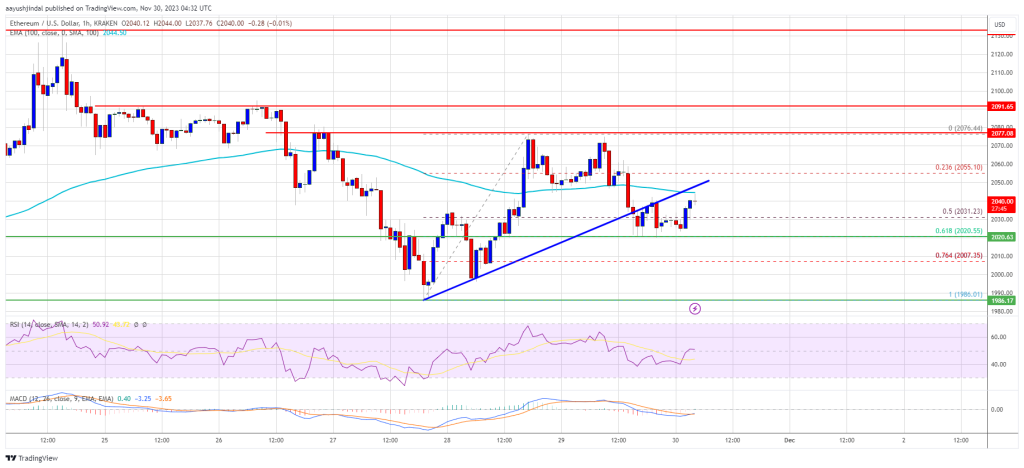
  • There was a break below a key bullish trend line with support at $2,040 on the hourly chart of ETH/USD (data feed via Kraken).
  • The pair could gain bullish momentum if it clears the 100-hourly Simple Moving Average and then $2,075.

Ethereum Price Trims Gains

Ethereum price struggled to clear the $2,075 resistance zone. The bears took control and pushed ETH below the $2,050 level. However, Bitcoin managed to stay above the $37,550 support zone.

ETH traded below the 50% Fib retracement level of the upward move from the $1,986 swing low to the $2,076 high. Besides, there was a break below a key bullish trend line with support at $2,040 on the hourly chart of ETH/USD.

Ethereum is now trading below $2,050 and the 100-hourly Simple Moving Average. It is now consolidating above the $2,020 support zone. On the upside, the price is facing resistance near the $2,00 zone and the 100-hourly Simple Moving Average.

The first key resistance is near the $2,075 level. The next resistance sits at $2,090. A clear move above the $2,090 level could send the price toward the $2,130 resistance zone.

Ethereum Price

Source: ETHUSD on TradingView.com

The next resistance is near $2,200, above which the price could aim for a move toward the $2,250 level. Any more gains could start a wave toward the $2,320 level.

More Losses in ETH?

If Ethereum fails to clear the $2,050 resistance, it could continue to move down. Initial support on the downside is near the $2,020 level. The next key support is $2,000.

A downside break below $2,000 might start a steady decline. The key support is now at $1,930, below which there is a risk of a move toward the $1,880 level in the near term.

Technical Indicators

Hourly MACDThe MACD for ETH/USD is losing momentum in the bearish zone.

Hourly RSIThe RSI for ETH/USD is now below the 50 level.

Major Support Level – $2,020

Major Resistance Level – $2,075

A Golden Opportunity For Ethereum? 600% Buy Signal Returns

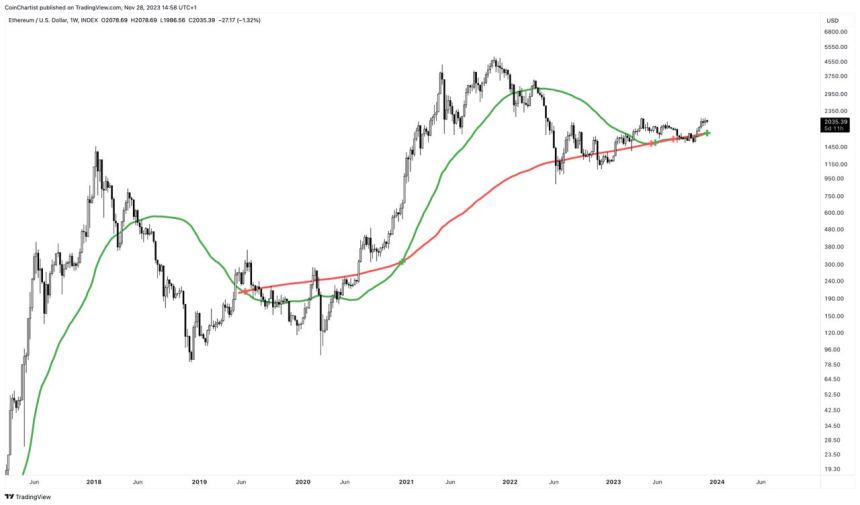
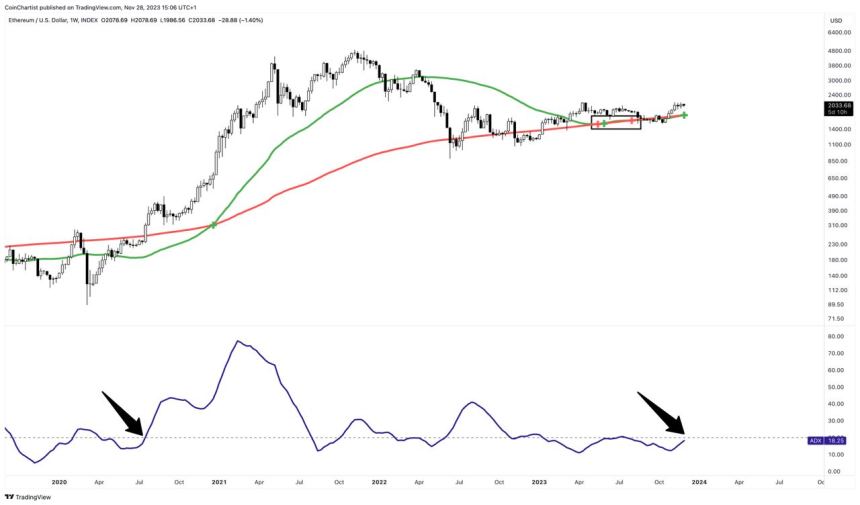
Ethereum has formed a “golden cross” pattern on the 1-week timeframe, marking the second such signal this year. While the long-term implications could be very positive if history repeats itself, there are reasons to temper expectations.

ethereum golden cross

Ethereum Golden Cross And A Possible Target For New ATHs

1W ETHUSD has formed a golden cross for the second time in 2023. A golden cross is a buy signal in moving average-based trading systems. It suggests that the trend is moving in an upward direction and because trends tend to persist, this is notable.

The golden signal occurs when a shorter-term moving average (the 50-week MA) crosses through a longer-term moving average (the 200-week MA) from below. A death cross forms when the opposite happens.

The last confirmed golden cross for Ethereum in December 2020 preceded a massive 600% rally over the next year to the asset’s all-time high near $4,900. A repeat move of similar magnitude this time would put Ethereum above $12,000—over six times today’s price of around $2,000.

However, it is important to note that not all golden crosses lead to the anticipated upside. In 2023 alone, 1W ETHUSD has death crossed and golden crossed twice now, demonstrating how moving average-based systems are prone to whipsaw without an established trend to follow.

ethereum ADX

An Uptrend Or More Whipsaw? How The ADX Confirms Trends

The whipsawing death cross and golden cross price action on the Ethereum 1-week chart failed to generate follow-through in either direction. So how can we be sure that this isn’t yet another premature crossover?

This is where the Average Directional Index (ADX) comes in when gauging the validity of moving average crosses. The ADX aims to measure trend strength, typically on a scale of 0 to 100.

As the 1-week ADX edges up from below 20, it confirms growing momentum that reduces the odds of more whipsawing price action. Traders often use such ADX readings to confirm golden/death crosses and enter only the most high-conviction signals.

The 1W ETHUSD Average Directional Index isn’t yet above 20, but is approaching this key level. Above it, it gives the golden cross much more validity.

XRP Community And Cardano Founder Engage In Heated Clash

The XRP community and Charles Hoskinson, the founder of Cardano, are currently in the cryptocurrency spotlight as both parties have been involved in a fiery dispute lately.

XRP Community And Charles Hoskinson Face Off

On Tuesday, November 28, an XRP community member, Mr. Huber, took to X (formerly Twitter) and called out Charles Hoskinson. The post was accompanied by a snippet video of Hoskinson calling the XRP community conspiratorial. The post read:

I’m sorry, @IOHK_Charles, but for two years you did everything you could to make the #XRPcommunity to look ridiculous and embarrass us in public. I know you offered peace, but only to come out of nowhere and call us crazy conspiracy theorists again. No look at you. It’s funny what can happen in a year, isn’t it?

Mr. Huber’s X post criticized the Cardano founder on the previous statements he made towards Ripple. Basically, about Ripple’s allegations of corruption in the United States Securities and Exchange Commission’s (SEC) ranks.

Mr. Huber asserts that Hoskinson assisted in the “trivialization and cover-up of Joseph Lubin’s corruption.” According to Huber, it didn’t help the founder because Cardano’s native coin, ADA, is now categorized as a security by the SEC. 

In response to the accusations, the co-founder asserted that Huber was unaware that he was paying for Lubin’s price. The Cardano founder stated:

You believe that assisting in the trivialization and cover-up of Joseph Lubin’s corruption is a constructive approach to bringing clarity to Cardano. But the opposite is true. Joseph Lubin is smirking in your face because you don’t realize that you are paying for Lubin’s price.

Hoskinson further restated that there is no proof of the allegations against the Ethereum co-founder Joe Lubin. As Hoskinson believes, Joseph Lubin did not influence the SEC’s decision to treat Ethereum differently than XRP. Hoskinson stated:

Still waiting on a single piece of evidence for the latter. If you cannot provide it, then yes, you are spreading conspiracies and slander. That’s what this has been about for two years now. And somehow you guys still fight.

Serious Allegations Need Solid Evidence

Hoskinson’s criticism of the dissemination of slander and conspiracies highlights the importance of solid evidence before accusing people of serious allegations. However, members of the XRP community have since criticized Charles Hoskinson’s remarks on the issue.

So far, the Cardano founder asserted that his rejection of the allegations is unrelated to whether Ethereum received a free pass from the SEC. He further discerns between “unsubstantiated conspiracy” theories and what he believes is a valid criticism of regulatory approaches toward cryptocurrencies.

XRP

Ethereum Price Recovers, Why 100 SMA Is The Key To Fresh Increase

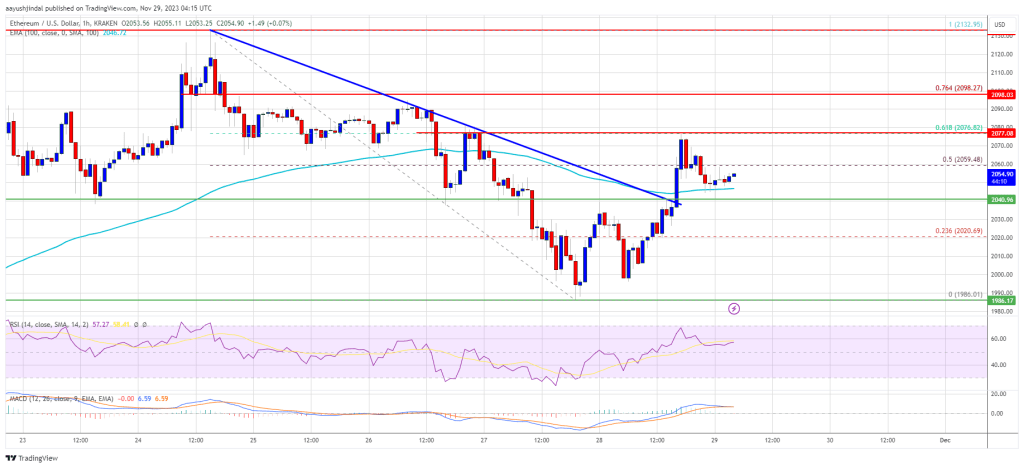
Ethereum price recovered from the $1,985 zone. ETH is showing positive signs and might rise further if it clears the $2,075 resistance.

  • Ethereum is recovering higher from the $1,985 zone.
  • The price is trading above $2,040 and the 100-hourly Simple Moving Average.
  • There was a break above a key bearish trend line with resistance near $2,040 on the hourly chart of ETH/USD (data feed via Kraken).
  • The pair could gain bullish momentum if it stays above the 100-hourly Simple Moving Average.

Ethereum Price Eyes Fresh Increase

Ethereum price spiked before the $2,000 support before the bulls appeared. ETH traded as low as $1,986 and recently started a recovery wave, like Bitcoin.

There was a decent increase above the $2,020 level. The price climbed above the 23.6% Fib retracement level of the downward move from the $2,132 swing high to the $1,986 low. Besides, there was a break above a key bearish trend line with resistance near $2,040 on the hourly chart of ETH/USD.

Ethereum is now trading above $2,040 and the 100-hourly Simple Moving Average. On the upside, the price is facing resistance near the $2,075 zone. It is close to the 61.8% Fib retracement level of the downward move from the $2,132 swing high to the $1,986 low.

The first key resistance is near the $2,100 level. The next resistance sits at $2,130. A clear move above the $2,130 level could send the price toward the $2,150 resistance zone.

Ethereum Price

Source: ETHUSD on TradingView.com

The next resistance is near $2,220, above which the price could aim for a move toward the $2,265 level. Any more gains could start a wave toward the $2,320 level.

Another Decline in ETH?

If Ethereum fails to clear the $2,075 resistance, it could start a fresh decline. Initial support on the downside is near the $2,045 level and the 100-hourly Simple Moving Average, below which the bears might gain strength.

The next key support is $2,000. A downside break below $2,000 might spark a strong bearish move. The key support is now at $1,930, below which there is a risk of a move toward the $1,880 level in the near term.

Technical Indicators

Hourly MACDThe MACD for ETH/USD is losing momentum in the bullish zone.

Hourly RSIThe RSI for ETH/USD is now above the 50 level.

Major Support Level – $2,045

Major Resistance Level – $2,075

Shiba Inu Burn Rate Skyrockets Close To 500,000% in 24 Hours

Shiba Inu (SHIB), an Ethereum-based altcoin has recently garnered the attention of the cryptocurrency community and investors as the token’s burn rate experienced a massive surge.

Shiba Inu Burn Rate Increases Significant

The Shiba Inu burn rate recently increased significantly by 499,416% in a 24-hour period between Sunday and Monday. Data from Shibburn – the platform that tracks SHIB token burns, shows this marks a new record for the token’s burn initiative. It also highlights the renewed strength of the community’s attempts to manage its token total supply.

Furthermore, the data also shows that over 264.20 million SHIB tokens were burned on the same day. The recent uptick in the SHIB burn rate can be traced back to several burn transactions. However, a single transaction that was carried out by an unknown wallet address is believed to have buttressed the surge.

According to the data available, the unknown wallet address transferred approximately 261.4 million SHIB tokens to a burn wallet on Monday. An important turning point in the SHIB burn initiative was reached with this transaction alone. This is because the transaction made up about 98% of all the tokens burned during this time.

Another transaction also garnered significant attention in the community. The wallet transferred approximately 21.52 million SHIB tokens to a burning wallet.

These kind of transactions are significant because it reduces the total supply of SHIB tokens in circulation. Over 410.66 trillion SHIB tokens have been burned from its total supply in circulation. Currently, the total supply of SHIB tokens in circulation is sitting at approximately 589.35 trillion tokens, according to CoinMarketCap.

The Importance Of SHIB Revealed

A Shiba Inu community member has recently revealed the importance of the SHIB tokens in the Shiba Inu ecosystem. The member suggests that people need to read the Shibpaper to know the role of the token.

They took to X (formerly Twitter) to share a screenshot of the project’s whitepaper on the role of the SHIB token. According to the screenshot, the tokens serve as the ecosystem’s legislative instrument as it states that SHIB tokens “propels legislative machinery.” It also grants every Shibizen an equitable voice in molding the project’s journey.

The screenshot read:

The Shib token allows for symbolically propels our legislative machinery. Embodying our democratic fabric, it grants every Shibizen an equitable voice in molding our shared journey. From council elections to legislative votes, the Shib token guarantees transparency and participative democracy.

The recent spike in burn rate has provided the SHIB community with a newfound hope, even though the road to a significant price gain appears long. With over 500 trillion SHIB tokens still in circulation, the community is still positive about potential price gains ahead.

Shiba Inu

Ethereum Bears Keep Pressing, Why ETH Price Might Revisit This Key Support

Ethereum price is moving lower from $2,130. ETH is showing a few bearish signs and might decline toward the $1,920 support zone.

  • Ethereum is slowly moving lower below the $2,060 zone.
  • The price is trading below $2,060 and the 100-hourly Simple Moving Average.
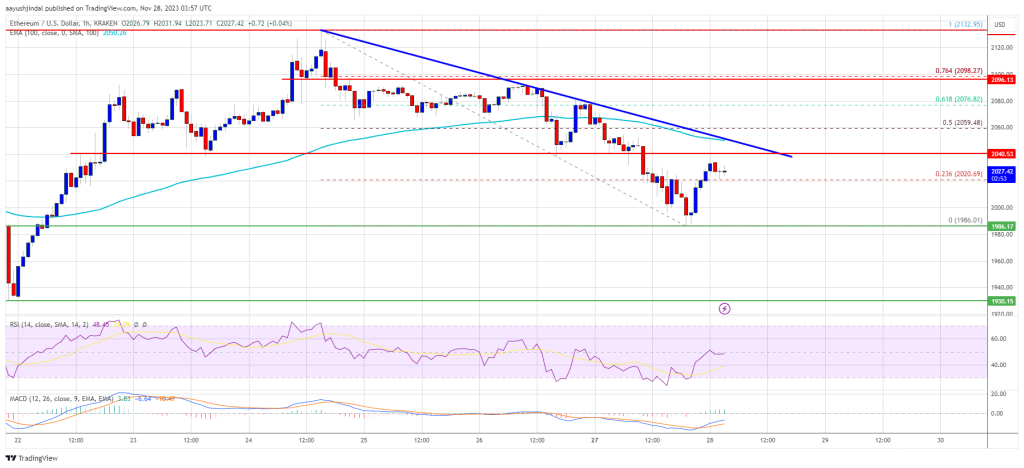
  • There is a major bearish trend line forming with resistance near $2,040 on the hourly chart of ETH/USD (data feed via Kraken).
  • The pair could continue to move down toward the $1,920 support zone.

Ethereum Price Extends Decline

Ethereum price started a fresh decline after it struggled near $2,130. ETH formed a high at $2,132 and started a downward movement. There was a move below the $2,100 and $2,080 levels, like Bitcoin.

The price even spiked below the $2,000 support. A low was formed near $1,986 and the price is now consolidating losses. There was a minor recovery wave above the $2,020 level. Ether climbed above the 23.6% Fib retracement level of the recent drop from the $2,132 swing high to the $1,986 low.

Ethereum is now trading below $2,060 and the 100-hourly Simple Moving Average. On the upside, the price is facing resistance near the $2,040 zone. There is also a major bearish trend line forming with resistance near $2,040 on the hourly chart of ETH/USD.

The first key resistance is near the $2,060 level or the 50% Fib retracement level of the recent drop from the $2,132 swing high to the $1,986 low. The next resistance sits at $2,100. A clear move above the $2,100 level could send the price toward the $2,135 resistance zone.

Ethereum Price

Source: ETHUSD on TradingView.com

The next resistance is near $2,150, above which the price could aim for a move toward the $2,200 level. Any more gains could start a wave toward the $2,250 level.

More Losses in ETH?

If Ethereum fails to clear the $2,040 resistance, it could start a fresh decline. Initial support on the downside is near the $2,000 level.

The next key support is $1,985. A downside break below $1,985 might send Ether toward the $1,920 support. The key support is now at $1,885, below which there is a risk of a move toward the $1,820 level.

Technical Indicators

Hourly MACDThe MACD for ETH/USD is losing momentum in the bullish zone.

Hourly RSIThe RSI for ETH/USD is now below the 50 level.

Major Support Level – $1,985

Major Resistance Level – $2,040

Ethereum Return To $4,800: Analyst Identifies Pattern To Trigger Rally To ATH

The Ethereum price has been trading more than 50% below its all-time high of $4,800 for the better part of a year now with no sign of returning to its previous all-time high. However, this slow trend may not continue for much longer as a crypto analyst has identified a pattern that could trigger a rally to its previous highs.

Ethereum Stuck Inside A Bullish Triangle

In an analysis that was posted on TradingView, crypto analyst FieryTrading identified a unique pattern that the Ethereum price has been trading in for almost two years. This pattern is a bullish triangle pattern and it has persisted for more than one and a half years.

Looking at the chart, the Ethereum price has not deviated from this bullish triangle and has not had any success breaking out of it. The triangle began toward mid-2022 when the Terra Network collapse triggered a crypto market-wide crash. Then even with multiple major recoveries since then, the altcoin’s price remains inside this triangle.

Ethereum price chart from Tradingview.com

The lower end of this bullish triangle is at $887 which is the cycle low, and the upper end has been tracked at just above $2,100. Given this range, it suggests that for Ethereum to break out of this bullish triangle, it would have to clear the $2,200 resistance.

What Happens If ETH Breaks Out Of This Pattern?

As the crypto analyst highlights, a breakout of this pattern would lead to a massive rally. The top of this breakout rally could eventually see the Ethereum price return to its 2021 all-time high levels, reaching above $4,800.

Ethereum price chart from Tradingview.com (crypto analyst)

“In my eyes, a break out from this pattern might result in big gains for ETH, since it will burst through an area full of short-trade stop-losses which will be forced to buy back their positions,” FieryTrading said. A move to $4,800 would translate to a 130% increase from its current price levels.

However, the crypto analyst explains that this could be more of a long-term performance, so it is possible that the cryptocurrency will not complete this move until at least the year 2024. But it paints a good, bullish picture for the altcoin going forward.

On its own this year, the Ethereum price has performed quite well, especially over the last 30 days. Data from CoinMarketCap shows that ETH’s price has risen 16.53% in one month to break above the $2,000 resistance which has now turned into support.

Ethereum remains the second-largest cryptocurrency with a market cap of approximately $250 billion.

Blast Surpasses Cardano And Base – Here’s How Much DeFi Investors Have Locked

Blast is the latest Layer 2 network to burst into the scene in the last week and has taken the decentralized finance (DeFi) world by storm already. This network which seemingly came out of nowhere has backing from Paradigm, and as its popularity has risen, it has surpassed Base and Cardano’s Total Value Locked (TVL) in less than a week after launch.

Blast TVL Crosses $565 Million

The Blast network was officially announced on November 21 and it quickly garnered support from crypto investors. In the first day, the network saw over $81 million in crypto locked. And in two days, the figure had quickly grown above $123 million.

Despite some of the FUD (Fear, Uncertainty, and Doubt) that has followed the launch of the network, investors have continued to bridge their assorted into it. By Sunday, November 26, the total value locked on the Blast network had officially crossed $544 million, according to data from DeFi tracker DeFiLlama.

This figure puts the network’s TVL ahead of older competitors such as Coinbase’s Base. While Blast’s TVL sits at $544 million, the Base TVL is at $338.26 million. This means that Blast’s TVL is currently 60% higher than that of Base.

In the same vein, the Blast TVL is also way ahead of that of Cardano. Presently, the Cardano TVL sits at around $330.07 million, just a little lower than Base, and around 61% lower than that of Blast.

New L2 Draws Criticism From DeFi Investors

Amid the rapid growth that Blast has enjoyed, it has also drawn criticism from DeFi investors. The concerns have ranged from security to how the network is being run. One of the most pertinent criticisms has stemmed from the fact that all of the crypto being bridged to the network will be locked until next year.

The network revealed that investors will not be able to access their locked funds until February 2024. In addition, Blast promises users yield on their Ethereum (ETH) and stablecoins being bridged to the network, but with no readily discernible way of how this yield will be earned.

Some members of the crypto community have, however, figured out that the funds were being deposited into the Lido DAO protocol. Apparently, Blast is currently earning around $1.5 million a month by depositing the bridged funds into Lido. This has further raised concerns about the growing dominance of Lido, which is headed toward 33.3% and could pose a risk for the Ethereum network.

Nevertheless, Blast continues to dominate conversations around DeFi on social media. There is now a total of 266,130 ETH locked on the network, with the expectations of an airdrop happening in 2024.

DeFi total market cap chart from Tradingview.com (Blast Cardano Base)