After over two years of operation and maintenance by the Conflux Foundation, ShuttleFlow, a multi-asset bridge built on Conflux, is set to shut down.
Per the announcement, the platform was pivotal in driving progress within the decentralized finance (DeFi) arena, enabling “seamless” asset transfers across various chains.
Conflux Foundation Passes The Torch
ShuttleFlow emerged as one of the advanced multi-chain asset bridges in the DeFi space. Its architecture facilitated interoperability between different blockchains, opening up new user possibilities.
Notably, ShuttleFlow enabled “effortless swaps” between external blockchains such as Ethereum (ETH) and Binance (BNB), utilizing Conflux as the transit chain. With the decision to shut down ShuttleFlow, the Conflux Foundation has entrusted cryptocurrency hub company Zero Gravity with the responsibility of maintaining and further developing the technology stack.
According to Monday’s announcement, Zero Gravity will continue to enhance the Bridge’s capabilities to ensure a “seamless and secure” experience for users within the expanding multi-chain ecosystem.
Furthermore, the Conflux Foundation assures users that their funds are secure throughout the transition. All user funds will be migrated from ShuttleFlow to Zero Gravity, safeguarding their assets.
Users who have previously bridged assets through ShuttleFlow and successfully claimed them on the destination chain will not be required to undertake any additional actions for the migration.
ShuttleFlow will continue to assist users in claiming assets on the destination chain even after the bridging service is shut down. Users can locate their unclaimed assets on the ShuttleFlow history page.
ShuttleFlow Service Ends
The ShuttleFlow website and decentralized app (dApp) will continue to operate with limited functionality until January 6, 2024. However, the bridging service through ShuttleFlow’s dApp will cease on November 6, 2023. Once ShuttleFlow fully shuts down, users can bridge their assets through Zero Gravity’s official dApp.
The Conflux Foundation firmly believes that the decentralization and accumulation of infrastructure partners are crucial for the growth of its ecosystem. With Zero Gravity taking the reins, ShuttleFlow’s vision of enabling chain-agnostic asset flows to and from the Conflux Network will persist.
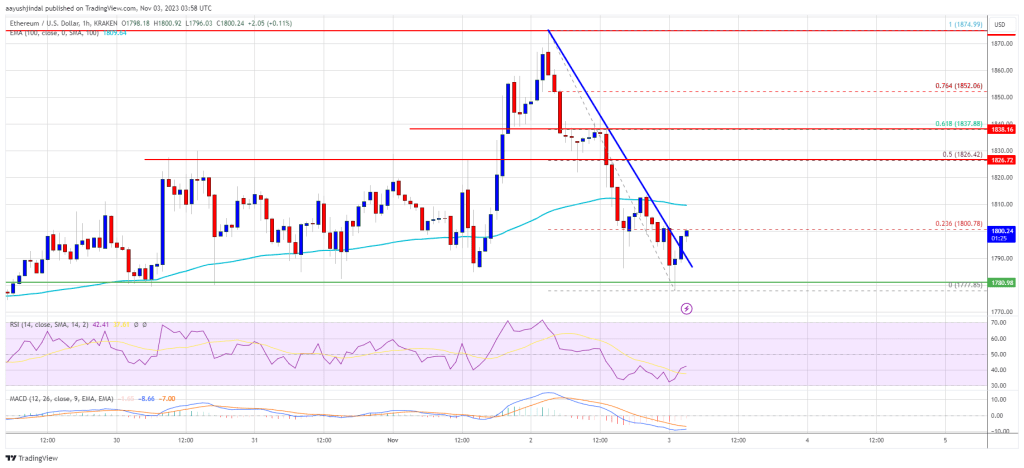
In light of these developments, the protocol’s token, CFX, currently ranked among the top 80 largest cryptocurrencies in the ecosystem, has experienced a retracement of over 2.9% in the past 24 hours, trading at $0,1619.
Nevertheless, the token retains significant gains of 277% in the year-to-date period, demonstrating its remarkable growth over the past year.
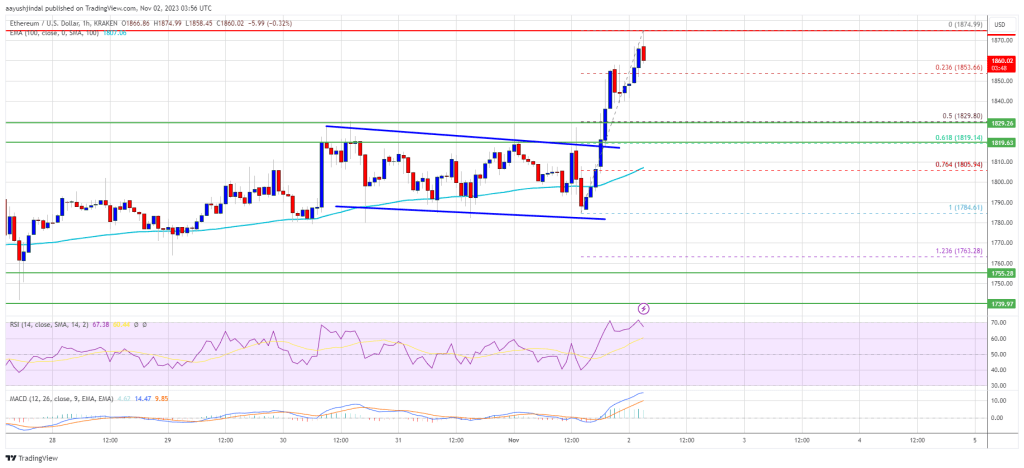
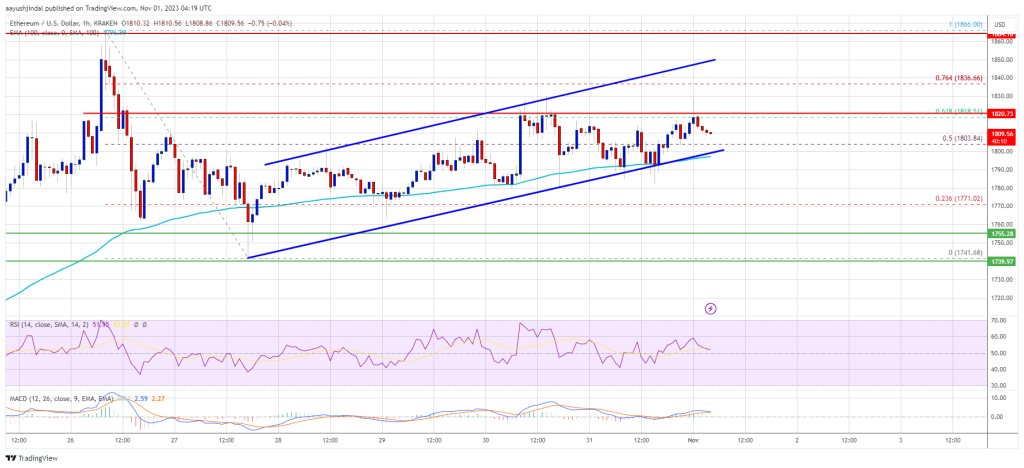
Featured image from Shutterstock, chart from TradingView.com