Is Bitcoin Headed For A Crash? Analysts Cite Possible Downtrend

Investors in the cryptocurrency space are eagerly awaiting the halving of Bitcoin in order to fuel future market growth. However, top cryptocurrency expert and trader Benjamin Cowen cautions that if the price of BTC follows a previous pattern, there may be a correction.

Bitcoin Halving Could Impact Price Negatively

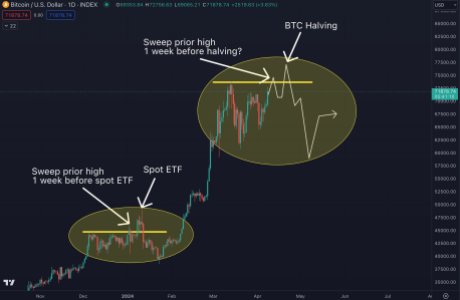
Cowen has highlighted a trend that could potentially lead to a significant decline in the crypto asset’s price when the Bitcoin halving event commences, which suggests that BTC could be poised for a decline in the coming days.

According to Cowen, should Bitcoin continue to follow the same trajectory as it entered the spot ETF during the halving, BTC may witness a trend toward the downside. The crypto expert advocates that these patterns typically do not repeat precisely. However, he believes putting the idea out there is crucial in case it happens again in a similar manner.

Bitcoin

In response, a pseudonymous user commented on Cowen’s post and reminded the expert that he forgot the arrow backup. Responding to the user, Cowen stated that he believes the outcome of the next phase will depend on whether or not ALT/BTC pairs have collapsed by then.

Furthermore, he affirms there could be a move on the upside if they have not broken down. Meanwhile, in the event that they have broken down, the pattern can transit to something new.

It is worth noting that the Bitcoin halving event is forecasted to take place within the next 11 days. Given Bitcoin’s halving previous significant impact on price, BTC could be positioned for a notable price surge in the coming days. However, if Cowen’s recent prediction manifests, it could paint a different picture for the crypto asset during the halving event.

The expert’s prediction has sent quite a frenzy in the crypto community, with analysts like Peter Brandt supporting his insights. Peter Brandt acknowledged Cowen’s projections noting that previous Bitcoin bull markets have exhibited a similar fundamental trend.

What To Expect During The Halving Event

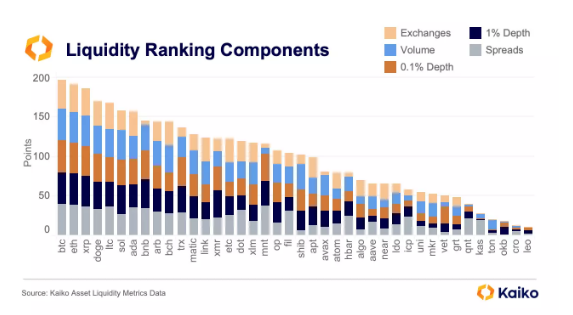
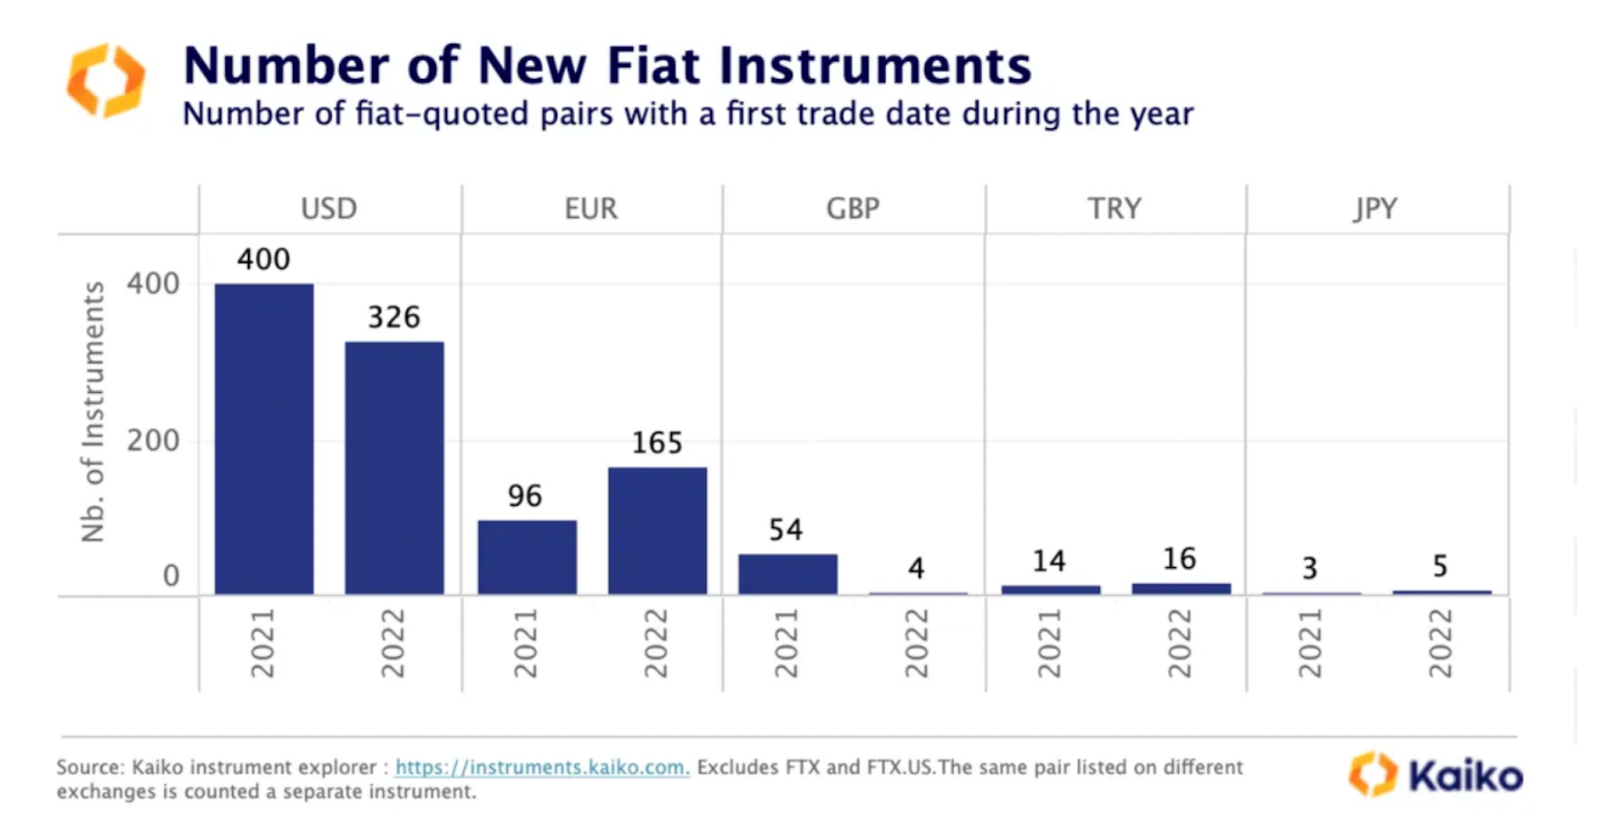
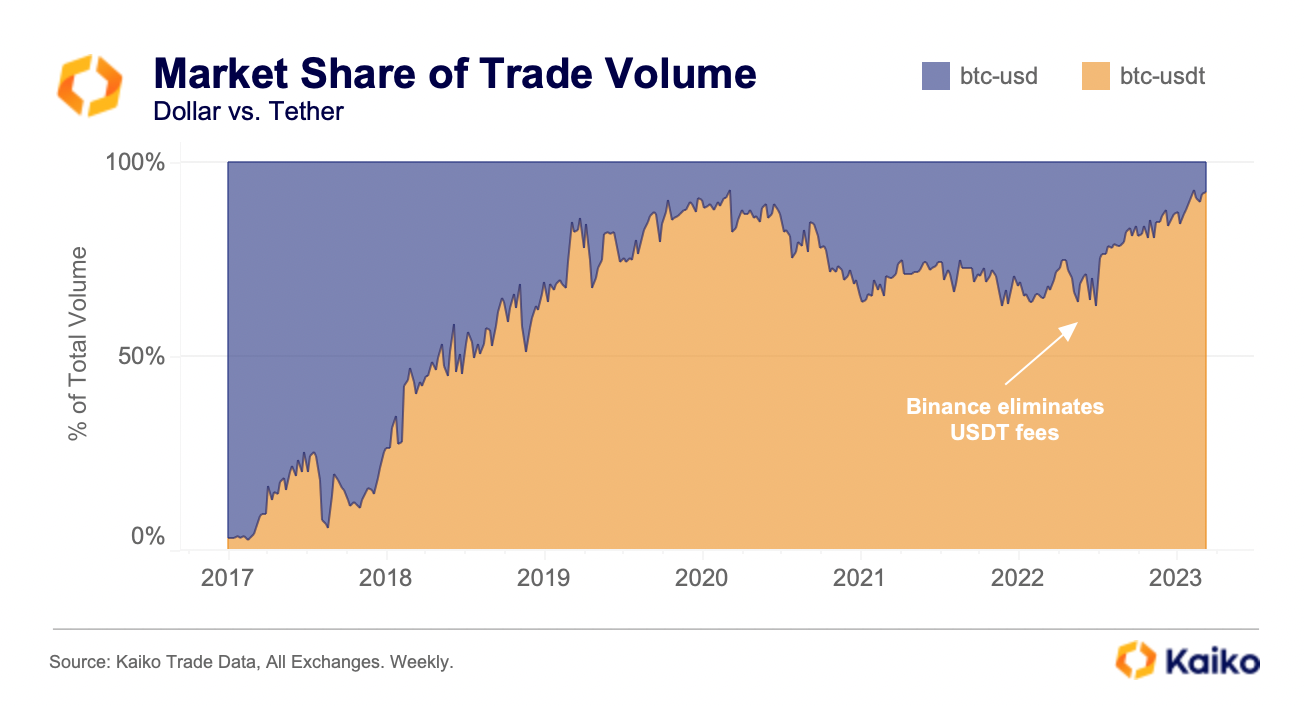
As the halving event approaches, the cryptocurrency data analytics platform Kaiko has laid out a perspective to watch out for. Kaiko’s perspective delves into the impact the halving has had on BTC’s price in the short term over the years.

According to the platform, in the past, the short-term price effect of Bitcoin halvings has been inconsistent. Nonetheless, historical data reveals that the coin tends to rise 9-12 months after halving, making it a generally bullish development.

At the time of writing, Bitcoin’s price was up by 8% in the past 7 days, valued at $70,770. Its overall market cap is down by over 2%, however, while its trading volume is up by over 8% in the past day.

Bitcoin

Dogecoin And XRP Beat Out Cardano And Solana To Secure New Milestone

Kaiko, a blockchain analytics platform, conducted an investigation that revealed the complexities of liquidity across the biggest crypto assets, with some lower market cap assets beating higher ones. According to its Q3 liquidity rankings, XRP and Dogecoin (DOGE) managed to beat out Solana and Cardano in liquidity rankings, coming in behind only Bitcoin and Ethereum. There were also some surprise numbers on the rankings, like BNB coming in 8th in terms of liquidity, and Litecoin also outperforming.  

Kaiko Analysis Highlights Liquidity For Crypto Assets

The vast number of crypto assets has always brought out the idea among investors to rank their valuation on a scale of some sort, with the most adopted being the market cap. However, according to Kaiko, liquidity, along with other metrics like volume and market depth is a better way to measure a token’s real value apart from its market cap. This was best demonstrated by FTX’s token FTT, whose market was bloated to reach a peak of nearly $10 billion without having enough liquidity on exchanges to back this up.

According to its latest rankings, Bitcoin took up the first spot in liquidity. This wasn’t surprising, as Bitcoin has always held a tight reign over the crypto industry since its inception. Ethereum followed in second place in terms of liquidity to reiterate its position as the king of altcoins. However, Kaiko’s liquidity rankings started to digress from the market cap at the third position, with BNB underperforming massively to come in at 8th place. 

Instead, XRP came in at 4th place, beating out the likes of Solana and Cardano (the Ethereum killers) on exchanges among traders. XRP’s liquidity boost in the quarter was thanks to the asset receiving regulatory clarity in the US. Dogecoin came in at 5th place, despite being 10th on market cap rankings, to solidify its position as the leader among meme coins. Litecoin came in at 5th place to complete the top five, despite being 18th in market cap rankings.

On the other hand, AVAX’s liquidity ranking dropped 11 places when compared to its market cap, while TON came in at 37th place despite being 9th by market cap during the quarter. Also, ATOM, UNI, APT, TON, SHIB, OKB, LEO, and CRO all fell more than five spots.

What Does Liquidity Say About Dogecoin And Crypto Assets?

Kaiko’s measure of liquidity included the spread and the average daily trading volume on different exchanges. The analytics platform also included two different market depth levels; 0.1% for higher frequency traders and 1% for longer-term holders.

In terms of trading volume, BTC came in first place while ETH and XRP followed suit. However, SOL beat DOGE in this metric with around $2 billion in the quarter.

The bottom line is that greater liquidity often precedes greater success over the longer term for cryptocurrencies. Q4 2023 should tell a strong tale in terms of crypto liquidity, as most cryptocurrencies registered new yearly highs in terms of market cap.

Featured image from Shutterstock

XRP Records Highest Average Daily Trade Volume Among Altcoins In August – Report

Prominent crypto research firm Kaiko reports that the XRP token recorded impressive trade volume strides across August 2023. This development comes amidst the token poor price performance in the said month. 

XRP Dominates Altcoin Market In Trade Volume Amidst Price Downtrend

According to the latest Data Debrief by Kaiko on September 4, the market research firm notes that XRP recorded an average daily trade volume of $462.8 million in August, representing the highest value of that metric in the altcoin market. 

Solana (SOL) followed in second place, with a trade volume of $128.4 million. Other altcoins that also experienced a significant average daily trade volume in August included Binance Coin (BNB), Dogecoin (DOGE), and Litecoin (LTC), among others.

XRP

As earlier stated, XRP’s surge in trading volume was accompanied by underwhelming market performance. Kaiko notes that the altcoin experienced a 25% price decline in August.

This negative price performance was in much contrast to July, during which XRP had recorded lofty gains following Ripple’s partial victory over the United States Securities and Exchange Commission (SEC).

Why Is The XRP Price Struggling? 

To explain the contrast between XRP’s negative price performance and its surging trade volume, Kaiko has provided some interesting, in-depth analysis.

According to the research firm, the court ruling in July led to a large demand for XRP by US traders, as was seen in the token’s price movement. Kaiko noted that the XRP average trade size on Coinbase, the largest US crypto exchange, experienced a significant boost, surpassing all top ten altcoins.

However, this massive XRP demand was only present in the US. Kaiko states there was high selling pressure on foreign exchanges, indicating that most investors sold off their tokens to capitalize on XRP’s gains from its court victory. 

In particular, Kaiko reported that the South Korean exchanges Upbit and OKX recorded the strongest XRP selling pressure for August. 

Kaiko notes that the XRP’s trading volume is higher on foreign markets than on US exchanges. The research firm reported:

Overall, the share of XRP traded on U.S. markets remains lower than on offshore exchanges. XRP is only the sixth most traded altcoin in the U.S. by cumulative trade volume, while it tops the list on offshore markets.

Therefore, the high demand for XRP in the US was overwhelmed by higher selling pressure on the global market, which explains why the XRP market price took a nosedive in August. 

At the time of writing, XRP trades at $0.503, having gone up by 0.17% in the last day based on data from CoinMarketCap. However, the fifth-largest cryptocurrency is still in the red zone and is down by 2.28% and 19.70% on the weekly and monthly charts. 

XRP

Why Is Bitcoin Price Down Today?

Today, Bitcoin took another dive, this time to its lowest level since June 21. A check on Bitfinex reveals a BTC price slump to $28,641. Coinbase, America’s largest crypto exchange, reported an even more drastic drop to $28,478. Although the price bounced back slightly to hover just below $29,000 (-1.4% in the last 24 hours), the downward trend sparks questions.

Why Is The Bitcoin Price On The Decline?

James V. Straten, a renowned on-chain analyst, recently tweeted: “Bitcoin drops below $29,000 as open interest spikes while funding rates go lower. As a result of the biggest long liquidation since 24th July.” As the analyst states, Bitcoin’s price trend can be majorly attributed to long liquidations. The liquidation data from Coinglass indicates that $23.6 million in BTC longs were liquidated, a relatively small amount but significant considering the market’s state.

Bitcoin liquidations

In an illiquid market, smaller orders can significantly sway the market. According to data from Kaiko, BTC and ETH have seen a decline in 90-day realized volatility this year, with volatility levels currently hovering around two-year lows.

Moreover, Kaiko’s data also reveals that Bitcoin’s correlation with the S&P 500 continued to decline in July, falling to just 3%. The last time it was this low was back in August 2021. This suggests that the traditional financial market’s influence on Bitcoin’s price is waning, an impulse much needed at the moment.

Analyst @52Skew noted that BTC Spot CVDs & Delta Retrospective were hinting at the downtrend. “There were clear signs of spot supply & sellers, especially on Coinbase. Aggregate Spot CVD indicated heavy supply prior to sell off: Price grinding higher into limit supply & market spot selling.”

Meanwhile, renowned trader @exitpumpBTC pointed out on Twitter: “Someone sitting with 400 BTC buy wall at $28,900 on Binance spot orderbook. Fully closed my short.” This buy wall might provide some support for Bitcoin’s price at the current level.

Bitcoin Market Sentiment Weighs On Price

The Bitcoin Market Sentiment, as represented by the Fear & Greed Index, is presently at 50 – neutral. However, the sentiment on the Bitcoin and crypto market is lukewarm, despite BTC being up 76% year-to-date. The fading momentum seems to be due to the Bitcoin and crypto market’s current “summer slumber.” The bullish news seems already priced in, and volumes on exchanges are dwindling.

Interestingly, despite some major bullish developments for the broader crypto market, including Blackrock’s filing for a spot ETF and the victory for XRP and Ripple, the retail and institutional interest remains low. This is reflected in the low liquidity and volatility in the market.

Remarkably, the crypto space has been rocked by an array of events recently. From the rise of liquidity absorbing meme coins to scam tokens, the market has seemingly descended into chaos. In the midst of all these, impending events such as the Curve (CRV) hack as well as fears of a potential DOJ action against Binance and Tether, continue to add anxiety to the market. In this uncertain state, there are no new investors to catapult the market upward.

At press time, BTC traded at $28,990.

Bitcoin price