The Global Financial Crisis reduced the depth of capital markets. Blockchain-based stablecoins can help fill the gap, say Christine Cai and Sefton Kincaid, of Cicada Partners.
Crypto Market Outlook 2024: ETFs Offer Tailwinds for Other Digital Assets
With the expected launch of a spot bitcoin ETFs in Q1 of 2024, crypto is coming of age, says CoinDesk Indices head of research, Todd Groth.
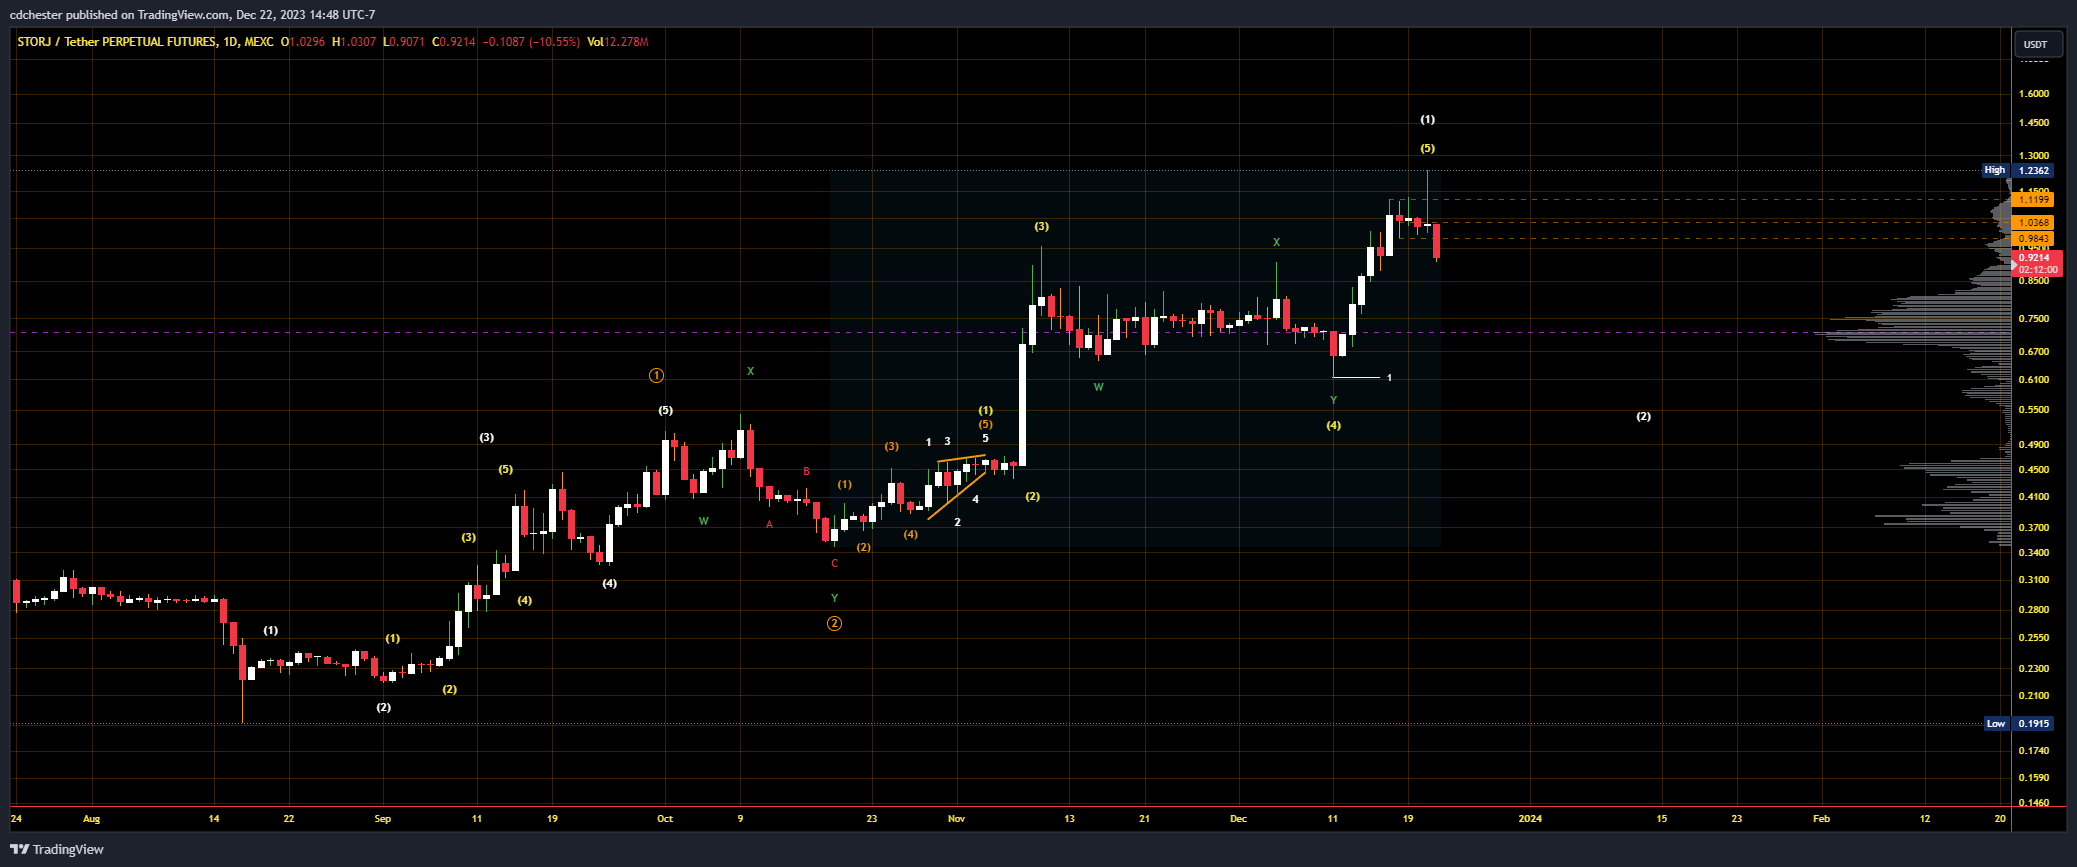
Storj (STORJ) Wyckoff Analysis (11 to 20 Dec 2023)
Wyckoff Analysis (WA) aims to understand why prices of stocks and other market items move due to supply and demand dynamics. It typically is applied to any freely traded market where larger or institutional traders operate (commodities, bonds, currencies, etc.). In this article we will apply WA to the cryptocurrency Storj ($STORJ) to make a forecast for approximate future events.

Link to the raw image: https://www.tradingview.com/x/BGsOkzGM
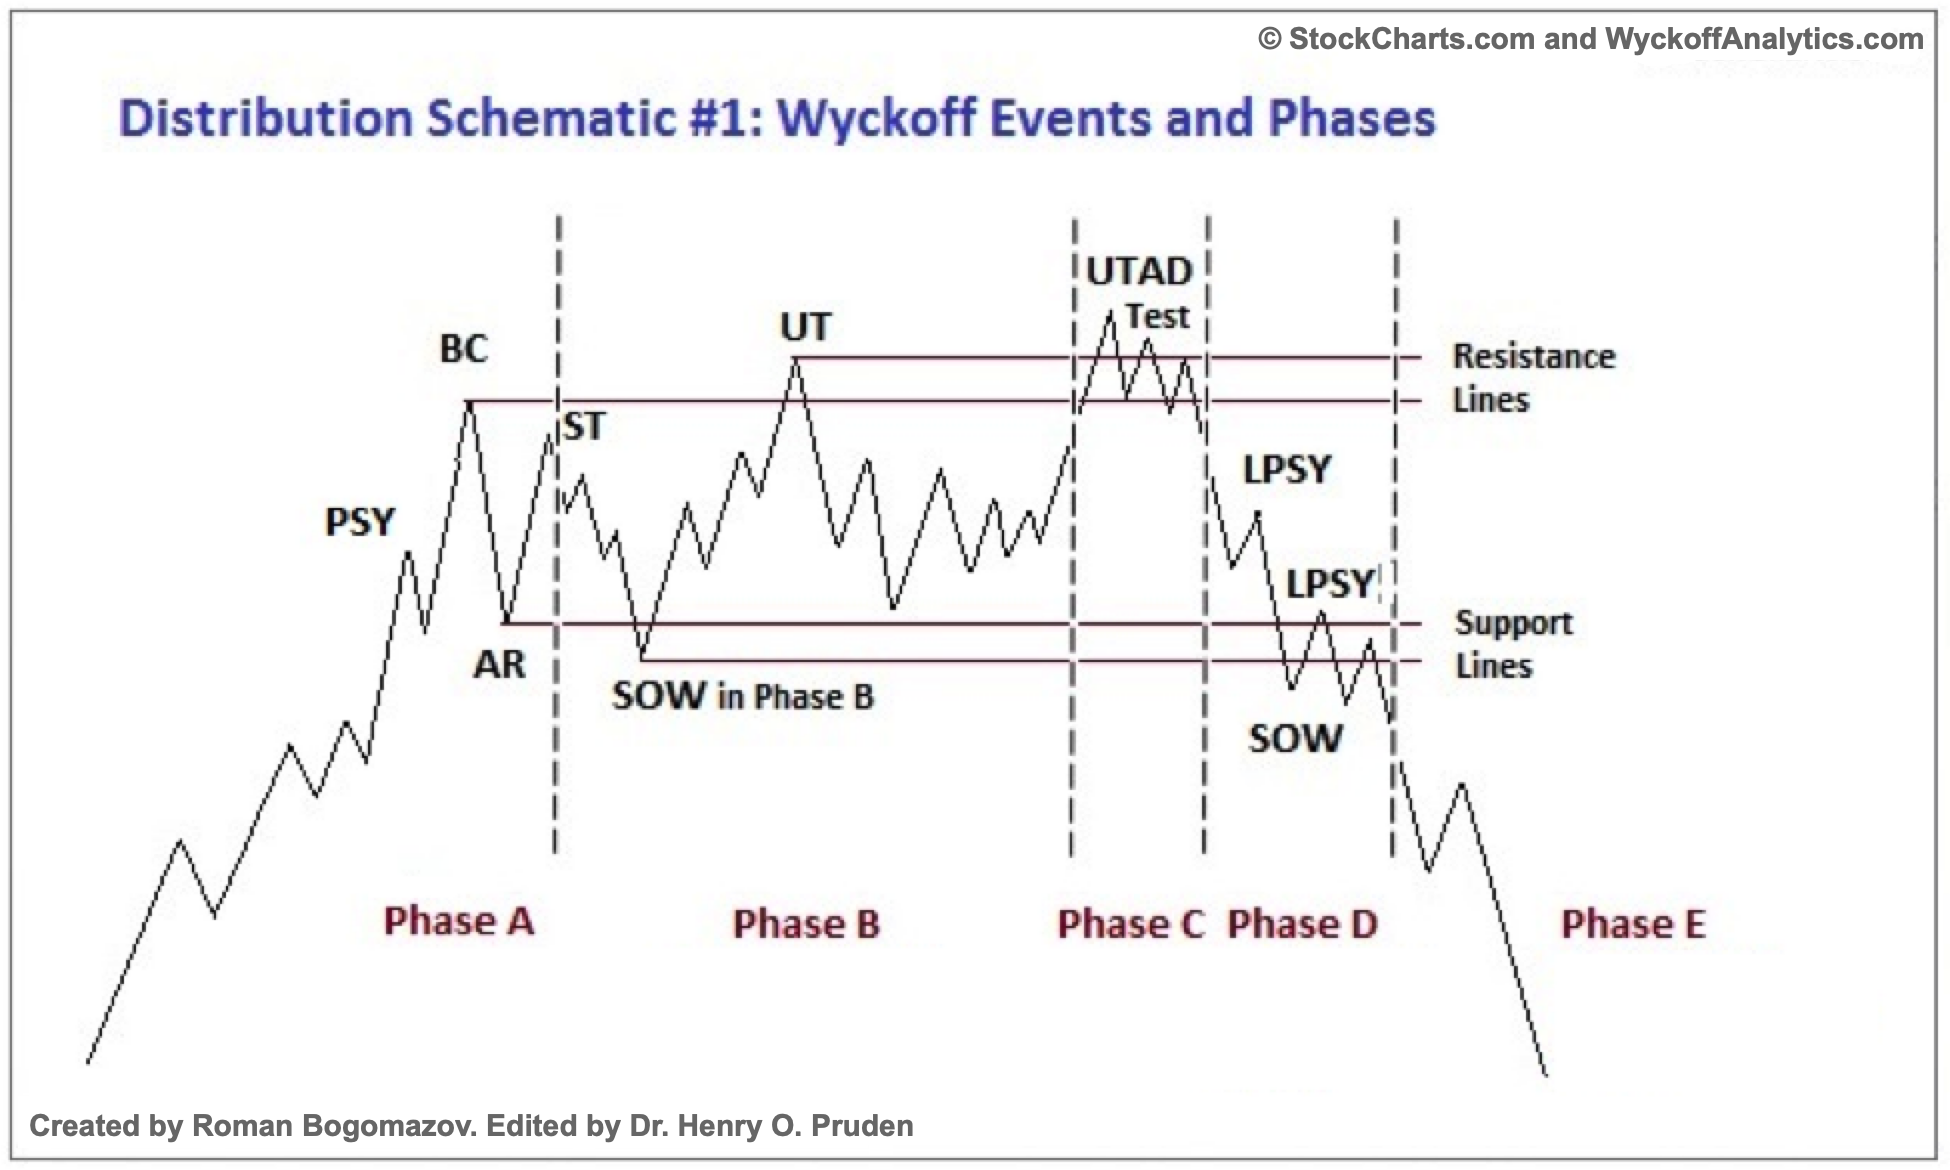
Storj is currently in Phase E of a Wyckoff Distribution Schematic #1. StockCharts says this about Phase E in their article on the Wyckoff Method:
Phase E depicts the unfolding of the downtrend; the stock leaves the TR and supply is in control. Once TR support is broken on a major SOW, this breakdown is often tested with a rally that fails at or near support. This also represents a high-probability opportunity to sell short. Subsequent rallies during the markdown are usually feeble. Traders who have taken short positions can trail their stops as price declines. After a significant down-move, climactic action may signal the beginning of a re-distribution TR or of accumulation.
The trading range for Storj was $1 – $1.12 and it has concretely fallen below that. From the picture below a major SOW has occurred, more so pointing to a Distribution occurring. This also coincides with our analyst’s Elliott Wave (EWT) view on Storj. They predict a small rally as Storj continues to fall in its Wave 2. The majority of the liquidity (per its relevant Volume Profile) is between the 38.2% and 61.8% LFR at $0.56 and $0.76 respectively. A liquidity cluster is typically expected between these LFRs in EWT leading us to the think a Wave 2 correction is happening. Additionally, the cluster is in the price range of the subwave 4, an EWT guideline.
Link to the raw image: https://www.tradingview.com/x/dD8hv9Aj
Below is the typical schematic for a Wyckoff Distribution Schematic #1.
Glossary
All quotes are from the first link in Supplemental Reading.
Preliminary Supply (PSY) – “where large interests begin to unload shares in quantity after a pronounced up-move”
Buying Climax (BC) – large operators selling their shares while the public buys them at a premium during a period of huge demand
Automatic Reaction (AR) – “With intense buying substantially diminished after the BC and heavy supply continuing, an AR takes place”
Secondary Test (ST) – when “price revisits the area of the SC to test the supply/demand balance at these levels”
Upthrust After Distribution (UTAD) – “a definitive test of new demand after a breakout above TR resistance”
Test – where larger traders “test the market for supply throughout a TR”
Sign of Weakness (SoW) – “a down-move to (or slightly past) the lower boundary of the TR, usually occurring on increased spread and volume”
Last Point of Supply (LPSY) – “exhaustion of demand and the last waves of large operators’ distribution before markdown begins in earnest”
Elliott Wave Theory (EWT)
“A theory in technical analysis that attributes wave-like price patterns, identified at various scales, to trader psychology and investor sentiment.”
Source: “Elliott Wave Theory: What It Is and How to Use It” by James Chen (2023)
Logarithmic Fibonacci Retracement (LFR) – A measured correction at certain Fibonacci ratios on a semi-log scale.
Logarithmic Fibonacci Extensions (LFE) – A measured rally at certain Fibonacci ratios on a semi-log scale.
Supplemental Reading
“The Wyckoff Method: A Tutorial” by Bogomazov & Lipsett
“Reaccumulation Review” by Bruce Fraser (2018)
“Jumping the Creek: A Review” by Bruce Fraser (2018)
“Distribution Review” by Bruce Fraser (2018)
“Introduction to Point & Figure Charts” from StockCharts
“P&F Price Objectives: Horizontal Counts” from StockCharts
“The Wyckoff Methodology in Depth” by Rubén Villahermosa (2019)
“Wyckoff 2.0: Structures, Volume Profile and Order Flow” by Rubén Villahermosa (2021)
“Elliott Wave Principle – Key To Market Behavior” by Frost & Prechter (2022)
Crypto for Advisors: Bitcoin Myth Busting
Kunal Bhasin, co-leader of KPMG Canada’s crypto asset and blockchain practice, debunks many of the bitcoin myths in the final Crypto for Advisors issue of the year.
Solana’s Scorching Rally Shows Ethereum Has a Serious Competitor
Crypto Had Reputational Issues This Year. 2024 Will Change That
Possible approval of bitcoin ETFs in 2024 is likely to change perceptions of digital assets following a year when the industry faced a backlash, Beth and Clay Haddock argue.
What to Expect From Bitcoin in 2024
Expectations that U.S. regulators will approve spot bitcoin ETFs next year are driving prices higher. History suggests we might see a slowdown as we approach the halving in April 2024, says Path Crypto’s David Liang.
Elections, SEC Cases, DOJ Cases: What Crypto Regulation May Bring in 2024
The CoinDesk policy team is scattered throughout the world; in the final edition of this newsletter, each member explains what they’re watching in 2024 in the world of crypto regulations. Happy holidays, and we’ll see you next year!
7 Real World Asset Trends in 2024 That Will Unlock the Future of Finance
Stablecoins, tokenized treasuries, decentralized private credit, physical-backed NFTs, DeFi in climate and regenerative finance – these are just some of the trends set to remake capital markets in the coming year.
The Unified Future of AI, Blockchain and Virtual Worlds in 2024
Convergence is more than just a blending of technologies: It is a harmonization that enhances, expands, and redefines our experience of the digital world, says the co-founder of Decentraland Foundation.
Is it Really ‘Up Only’ for Bitcoin?
With spot Bitcoin ETFs set to be approved, and a halving on the way in April, everyone expects bitcoin to rise in 2024. But history suggests that might not be the case, says Frank Corva.
How NFTs Will Make a Comeback in 2024
NFTs are poised to be a major driver of Web3 adoption in 2024 – but the successful projects will look very different from what’s come before.
Cosmos (ATOM) Wyckoff Analysis (May 2022 – Dec 2023)
Wyckoff Analysis (WA) aims to understand why prices of stocks and other market items move due to supply and demand dynamics. It typically is applied to any freely traded market where larger or institutional traders operate (commodities, bonds, currencies, etc.). In this article we will apply WA to the cryptocurrency Cosmos ($ATOM) to make a forecast for approximate future events.

Link to the raw image: https://www.tradingview.com/x/r8asKWOI
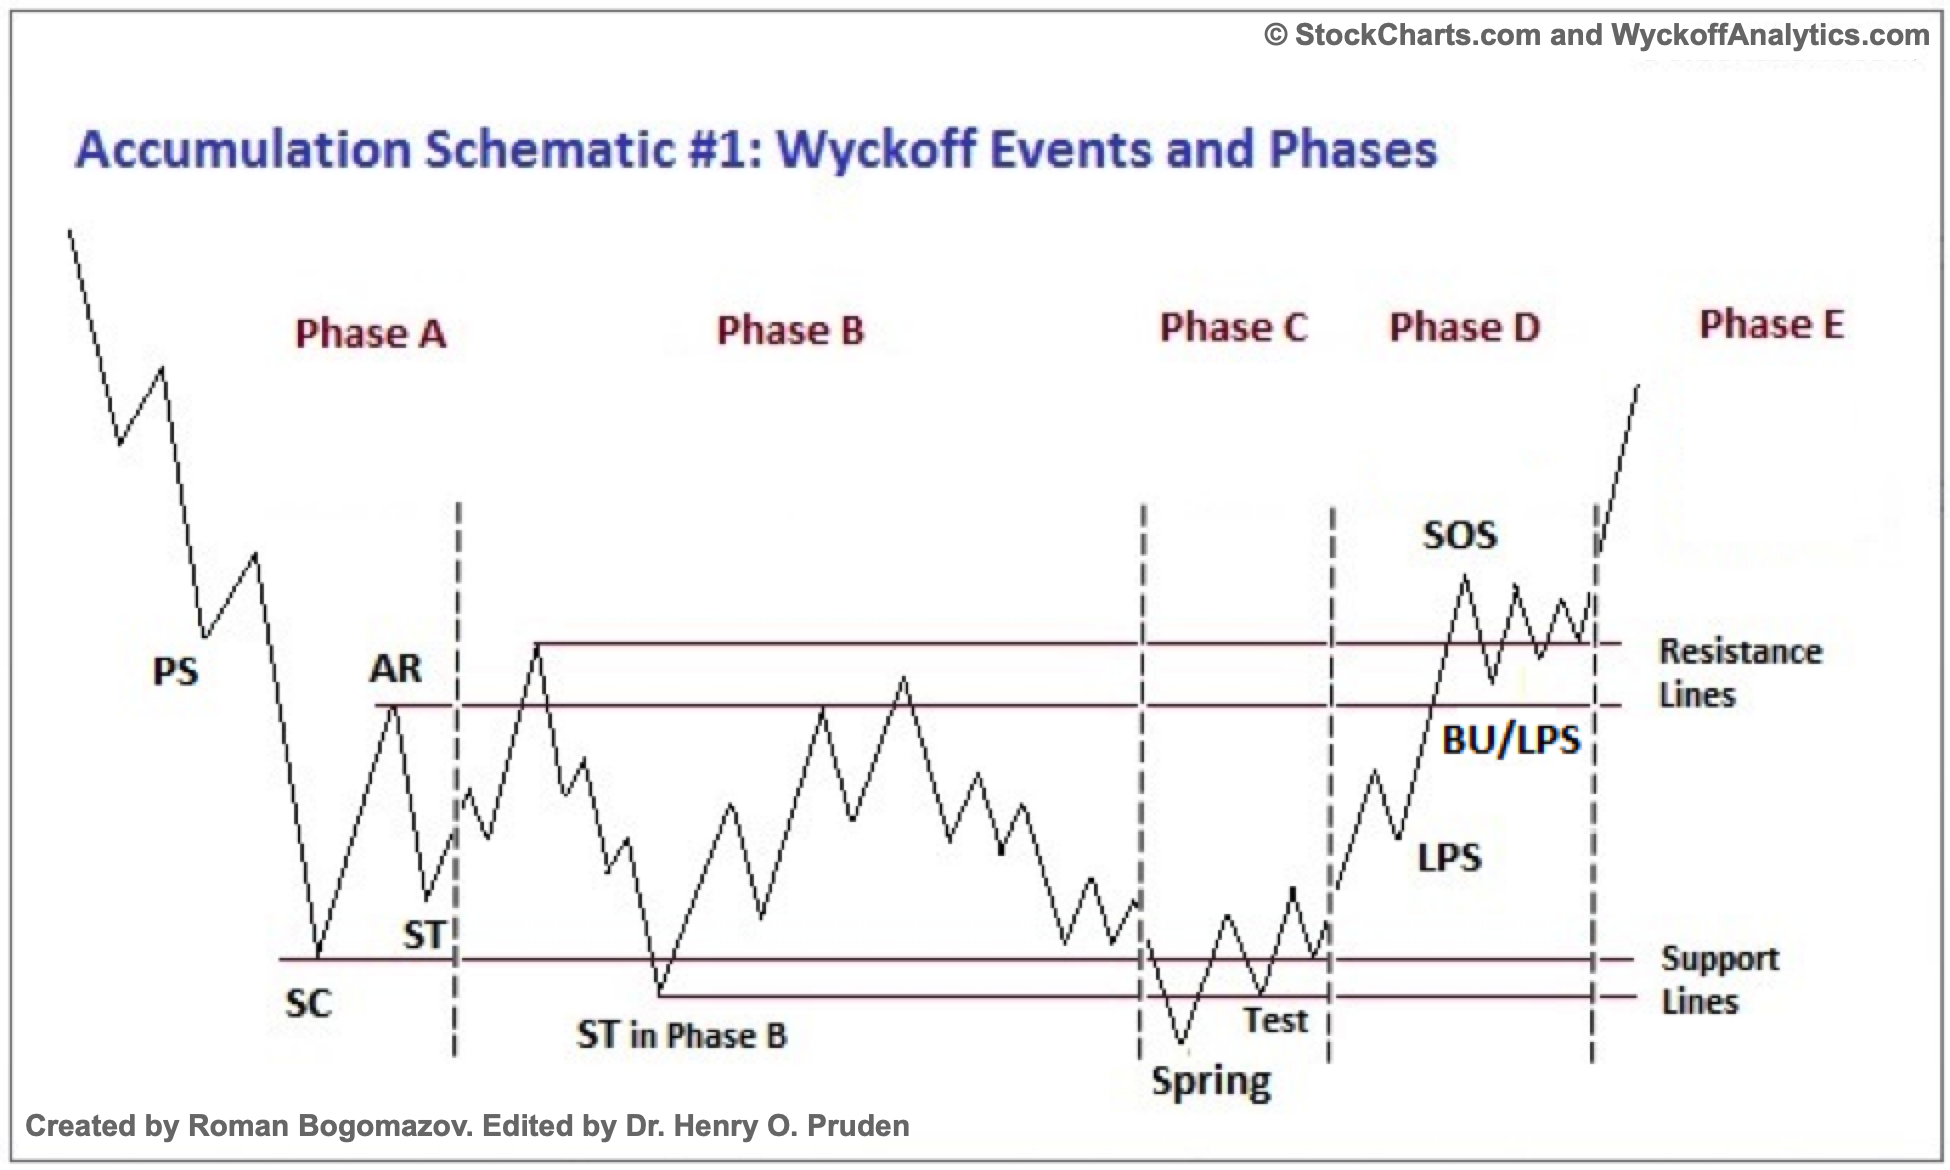
Cosmos $ATOM is currently in Phase D of a Wyckoff Accumulation Schematic #1. Note the volume spike near where I placed the SC and Spring. In Wyckoff Analysis these typically must align even if the overall form isn’t perfect. The only slight anomaly is that the ST dips sharply below the SC breaking the ICE (not labeled). There are Advanced Schematics that you can find online that accommodate many of these anomalous formations.
Phase D is where demand greatly overcomes supply leading the rallies on higher (or noticeably increasing) volume. When an LPS occurs that is typically a favorable (even optimal) place for a long position. It recently finished a Reaccumulation, to which it’s rallying sharply. Below are the typical schematics for both Wyckoff Accumulation Schematic #1 and a Reaccumulation for reference.

Cosmos Price Targets
The basic target (per the schematic) is the top of the trading range. In this case it’s at $18, but $15 is a preliminary target it must concretely clear first. Doing some more work using the Horizontal Count method with PnF charts yields different results. My settings are currently a $0.25 box size and a three box reversal on a High-Low lookback.
When using the Horizontal Count method Extended Congestions need to be accounted for differently. The main thing is finding the relevant column in and out to create the Congestion Box. In our case that’s from 13 to 20 December 2023 spanning 7 bars. Since this is a Reaccumulation “breakout” we will need to add the value from the formula the Horizontal Count uses.
7 x $0.25 x 3 = $5.25
The relevant low to add this to is $10.25 so the PnF target is $15.5.
Glossary
All quotes are from the first link in Supplemental Reading.
Preliminary Support (PS) – “where substantial buying begins to provide pronounced support after a prolonged down-move”
Selling Climax (SC) – “the point at which widening spread and selling pressure usually climaxes and heavy or panicky selling by the public is being absorbed by larger professional interests at or near a bottom”
Automatic Rally (AR) – “occurs because intense selling pressure has greatly diminished”
Secondary Test (ST) – when “price revisits the area of the SC to test the supply/demand balance at these levels”
Spring – “allow the stock’s dominant players to make a definitive test of available supply before a markup campaign unfolds”
Test – where larger traders “test the market for supply throughout a TR”
Sign of Strength (SoS) – “a price advance on increasing spread and relatively higher volume”
Last Point of Support (LPS) – “a pullback to support that was formerly resistance, on diminished spread and volume”
Back Up (BU) – “a common structural element preceding a more substantial price mark-up, and can take on a variety of forms, including a simple pullback or a new TR at a higher level”
Supplemental Reading
“The Wyckoff Method: A Tutorial” by Bogomazov & Lipsett
“Reaccumulation Review” by Bruce Fraser (2018)
“Jumping the Creek: A Review” by Bruce Fraser (2018)
“Distribution Review” by Bruce Fraser (2018)
“Introduction to Point & Figure Charts” from StockCharts
“P&F Price Objectives: Horizontal Counts” from StockCharts
“The Wyckoff Methodology in Depth” by Rubén Villahermosa (2019)
“Wyckoff 2.0: Structures, Volume Profile and Order Flow” by Rubén Villahermosa (2021)
2024: The Revenge of Bitcoin
Next Year Crypto Will Wash Away the Stains of the ICO Boom
SEC Chair Gary Gensler: ‘Far Too Many Frauds and Bankruptcies’
Earlier this month, I had the opportunity to speak with U.S. Securities and Exchange Commission (SEC) Chair Gary Gensler, recognized by CoinDesk as one of the most influential figures in the crypto industry over the past year, about how he views his agency’s role in the digital asset world.
Cosmos (ATOM) Elliott Wave Summary (2019 – 2023)
Cosmos ($ATOM) is the coin that powers the entire Cosmos ecosystem. It consists of a variety of projects from different spheres such as finance, decentralized exchanges (DEX), and cloud computing. The earliest price data I can find for $ATOM is from Kraken, starting in April 2019. Using this price data, the remainder of the article represents my best efforts to apply Elliott Wave Theory (EWT) to isolate its placement in market structures. I will assume that you have some knowledge of EWT to understand the terms, but I have also included a small glossary at the bottom for reference.
EWT Summary

A link to the raw image since it might be hard to see all the details: https://www.tradingview.com/x/jIKwljmV.
Cycle Wave 0 – Mar 2020 – $1.1151
Primary Wave 1 – $2.4794
Primary Wave 2 – $1.8482 (38.2% LFR)
Primary Wave 3 – $32.2433 (3.618 LFE)
Primary Wave 4 – $7.872 (50% LFR)
Primary Wave 5 – $44.7383 (1.236 LFE)
Cycle Wave 1 – Sep 2021 – $44.7383
Primary Wave A – $20.2221 (Contracting, Leading Diagonal)
Primary Wave B – $33.2641 (Contracting Triangle)
Primary Wave C – $5.5409 (Impulse)
Cycle Wave 2 – Jun 2022 – $5.5409 (50% LFR)
Primary Wave 1 – ONGOING
Primary Wave 2 – TBA
Primary Wave 3 – TBA
Primary Wave 4 – TBA
Primary Wave 5 – TBA
Cycle Wave 3 – ONGOING
Exploring Further
EWT uses ratios to create price targets. The main target being the 1.618 LFE, however there are the minimum, lower, and much higher LFE’s to watch out for. For $ATOM we first need to find the beta multiple to scale the targets off of. This is accomplished by taking Wave 1 and dividing it by Wave 0. In this case for the Cycle Wave Degree it’s approximately 40.12. Then we raise this multiple to various numbers defined by EWT to create a table of targets. In order below are the LFE Price Targets:
0.618 – $54.26
1 – $222.3
1.236 – $531.3
1.618 – $2,176.84
Therefore, if we expect $ATOM to be a Diagonal then $54.26 – $222.3 is the preferred price box.
If we are looking for the typical price box then it’s: $531.3 – $2,176.84.
However, due to the nature of the next estimated bull run only the Intermediate Degree Wave 3 of the Cycle Wave 3 should play out. The next bull run is estimated by many traders and institutions to peak around late 2024 to early 2026. Benner Cycle Theory also puts a market peak around 2026. You can see the full layout for Benner’s Cycle Theory here. As such, the Intermediate Wave 1 and 2 are: $17.2656 and $6.17. The beta multiple for the Intermediate Degree is approximately 3.116. Then as we did for the Cycle Wave Degree the relevant typical price box is: $25.14 – $38.81. The higher price boxes are all above the ATH for $ATOM. The current price action for $ATOM is overwhelmingly bullish, so the higher price boxes are definitely a possibility.

A link to the raw image since it might be hard to see all the details: https://www.tradingview.com/x/FQhUSWST.
Conclusion
Given the next bull run peak for crypto is likely late 2024 to early 2026 the relevant LFEs to use for $ATOM are at the Intermediate Wave Degree . The typical price targets for the Intermediate Degree Wave 3 are $25.14 – $38.81. The price as I write is $11.3 so the next peak is a rough 2 to 3.5x from here. If the Wave 3 is heavily extended and possibly goes to the 2.618 or 3.618 LFE then a new ATH is possible. That would mean a minimum of a 4x from here to the next peak. The Primary Wave 1 of Cycle Wave 3 is likely due in late 2026 to 2030 using Fibonacci Time Ratios.
Glossary
Elliott Wave Theory (EWT)
“A theory in technical analysis that attributes wave-like price patterns, identified at various scales, to trader psychology and investor sentiment.”
Source: “Elliott Wave Theory: What It Is and How to Use It” by James Chen (2023)
Logarithmic Fibonacci Retracement (LFR)
A measured correction at certain Fibonacci ratios on a semi-log scale.
Logarithmic Fibonacci Extensions (LFE)
A measured rally at certain Fibonacci ratios on a semi-log scale.
Supplemental Reading
“Elliott Wave Principle – Key To Market Behavior” by Frost & Prechter (2022)
“Visual Guide to Elliott Wave Trading” by Gorman & Kennedy (2013)
“How to Calculate Logarithmic Retracements and Extensions” by C. D. Chester (2023)
2023: A Critical Juncture for the Global Stablecoin Market
Moody’s Senior Director Yiannis Giokas said adoption accelerated this year, despite many destabilizing trends.
Ethereum Emerges as a Key Blockchain for Tokenized Real-World Assets
The pace of real world asset tokenization picked up steadily in 2023. That’s likely to increase next year, with Ethereum well placed to benefit, says Cristiano Ventricelli, of Moody’s.
Crypto for Advisors: The 2024 Year Ahead
Advisors now have a better – but still nascent – array of investment options to help avoid the pitfalls of early-adopter risk and exploit a generational opportunity in 2024.


