U.S. regulatory efforts are likely to focus on stablecoin regulation, the report said.
Morgan Stanley: Falling Stablecoin Issuance Is Negative Sign for Crypto Trading

Cryptocurrency Financial News
U.S. regulatory efforts are likely to focus on stablecoin regulation, the report said.
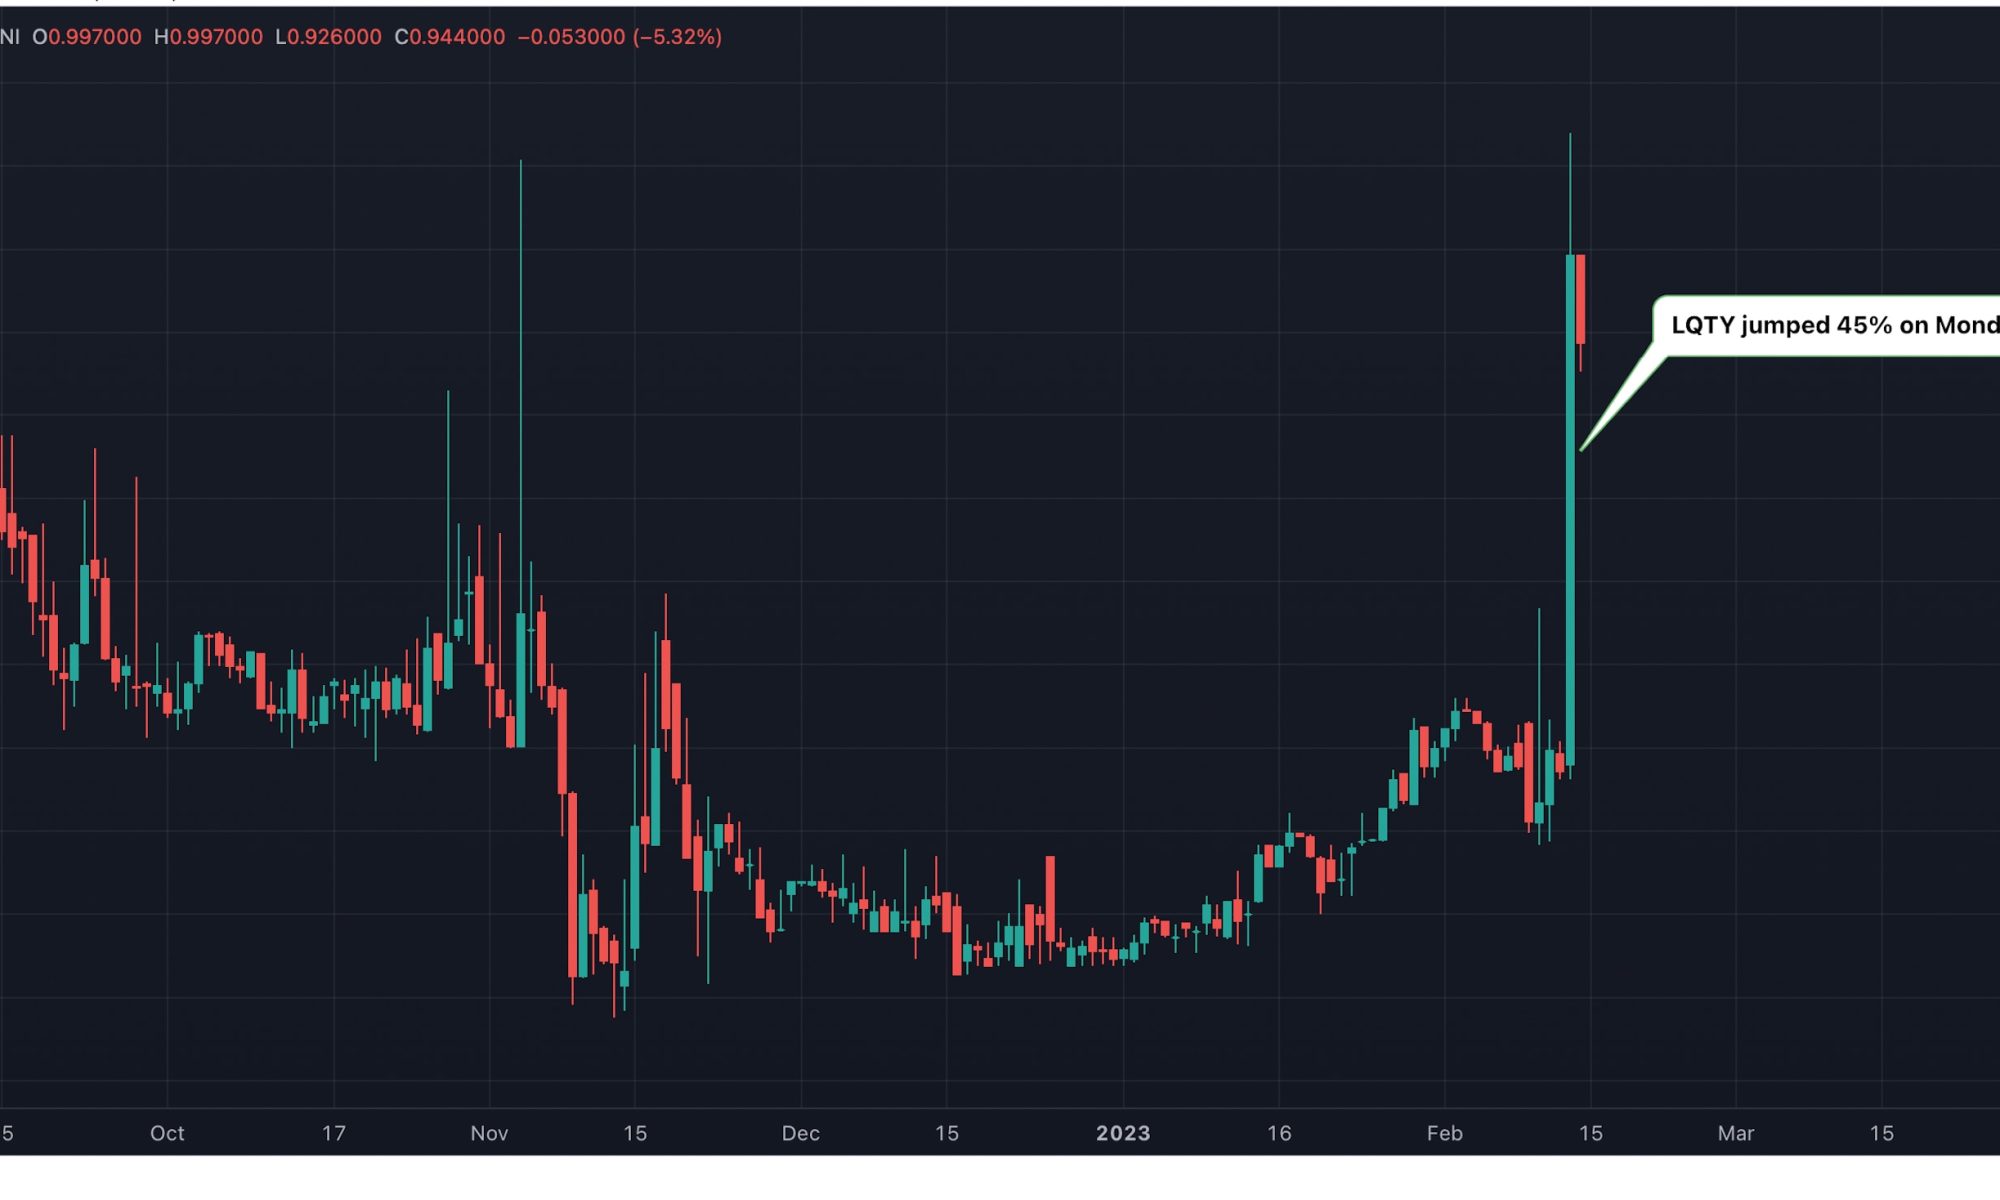
Traders look more closely at decentralised censorship-resistant stablecoin lending protocols like Liquity in the wake of regulatory action on Paxos’ centralized dollar-pegged cryptocurrency BUSD.


If a majority of the five-member SEC panel votes in favor of the draft proposal, it will proceed to the next stage, which will be reviewed by other members of the SEC.


Crypto financial service Matrixport’s head of research believes regulators are not targeting all stablecoins with the regulatory crackdown on BUSD issuer Paxos.


The bank for central banks is expanding its CBDC research while developing a platform to monitor stablecoin balance sheets.


Circle has released its reserve report for December 2022 highlighting over-collateralized asset holdings currently backing 44.5 billion USDC tokens in circulation.


A SWIFT-style system for bank-issued and regulated digital currencies was launched by a firm with a tenure building China’s national blockchain project.

The current BTC price boost may not be a natural phenomenon any longer, new research says.

A stablecoin is a cryptocurrency that is pegged to a certain fiat currency. It provides stability for investors of crypto, making transactions easier. USDD, a stablecoin created by the founder of the Tron Blockchain, Justin Sun, has been losing its peg to the U.S. dollar.
According to Coingecko, USDD is currently trading at $0.9805. Although USDD was designed to be pegged to the dollar like other stablecoins, its value has fluctuated between $0.9806 and $0.9798 during the past week.
As this developed, Sun’s crypto exchange, Huobi Global, joined the ranks of crypto companies that started this year with job cuts.
Adding to the pressure is the fear, uncertainty and doubt surrounding the Huobi exchange itself. Recent social media posts regarding the exchange shows that Huobi has higher withdrawals than deposits which strengthened fears of a possible halting of withdrawals.

USDD is an algorithmic stablecoin which uses complex arithmetic to keep the price pegged to a dollar. According to Tron DAO’s blog post about the inner workings of USDD, the stablecoin is not considered de-pegged by the system when it drops lower or goes higher than $1.
Looking at the charts, the stablecoin is consistently testing its 3% leeway set by the system. Although the system itself does not consider USDD depegged, this consistency is worrying as any further drop might cause more troubles – or eventually led to the fate that befell UST when it crashed.
With investors skeptical of USDD since its inception, Sun has not done anything as of now. This is clearly because of the current situation at Huobi, leaving the reins to the system that govern USDD.
Justin’s $1.1B withdrawal:
– It was speculated that this was used to fund Huobi’s operations
– Likely untrue, the amount is way too large to cover burn rate
– Even Twitter running at its most wasteful state only burns at $4mil/month
– Whispers of him cashing out— Rock
(@DataaRocks) January 6, 2023
Sun, who is advisor to Huobi, has been said to be withdrawing more than a billion dollars which further strengthened the FUD surrounding the exchange. Speculators, however, believe that the withdrawn funds would be used for the operations of Huobi.
This might be true, as the exchange might be burning through its liquidity as withdrawals continue to mount up due to recent negative developments. Any negative news on Huobi might have an effect on the peg of USDD and USDJ.
Not to mention that both stablecoins are limited in where they can be bought and sold. According to CoinCodex, USDD is tradable on 11 exchanges while USDJ is tradable on three. Both can be traded on Huobi and Poloniex.
At @HuobiGlobal, we believe that the key to success in the world of cryptocurrency is to “Ignore FUD and Keep Building.”
— H.E. Justin Sun
(@justinsuntron) January 6, 2023
With Sun being one of the shady characters in the crypto, it remains to be seen whether his “ignore the FUD” strategy will work. But with Huobi’s worsening FUD, the exchange becoming the next FTX would definitely devastate many investors and send shockwaves to the entire crypto space.
-Featured image by PortalCripto
Stablecoin adoption has grown immensely, observed especially following the collapse of Terra.
USDC and USDT have seen sizeable growth, but USDT has a lot of keeping up to do with its value plunging as of press time.
The transfer volume of stablecoins is seeing impressive growth, including USDC, but USDT needs to catch up and gain more traction.
Overall, stablecoins are enjoying a spike in trading volume, having reached roughly $7.5 trillion which is a huge price pump.
According to CoinMarketCap, USDT (Tether) is trading at $0.09999 or 0.00% as of this writing.
As of press time, USDC has been acing its rival in terms of value and transaction volume. Tether’s transaction volume has significantly slipped by 200 billion from 2021 to 2022.
USDT falters in the social media department or visibility, which could account for its steady decline. Its social engagements have dropped tremendously by as much as 24.2%, and social mentions have dipped by 13.7% since November.
In comparison, other stablecoins have been actively engaged on social media, padding their popularity.
USDT has had prevailing negative sentiment since early December, but it has improved, and the weighted sentiment is now looking a little positive.

The value of transactions is another region in which the stablecoin has been supplanted. Dune Analytics found that USDC has outperformed its competitor in this area as well.
As of this writing, the total value of all USDT transactions was $710 million, whereas all USDC transactions were worth $4.4 billion.

Despite some good news regarding positive sentiment and market cap, USDT is faltering in terms of network growth, especially in the Optimism, Polygon, and Ethereum networks which signals a decrease in the transfer of USDT happening in the networks.
In other news, the 31 crypto exchanges under Japan’s Financial Services Agency (FSA) have implemented a ban on trading with stablecoins that include USDC and USDT on June 2022, but they seem to want to reconsider for 2023.
According to recent news reported on December 26, the FSA of Japan will be removing the ban imposed on the distribution and trading of stablecoins come 2023.
In line with this announcement, Japan will now allow the local crypto networks to perform activities like trading and distribution of stablecoins to ensure speedy and affordable international remittances.
But, stablecoin distribution in the country will adopt regulations connected to Anti-Money Laundering activities.
The on-chain data for the stablecoin redemptions during the recent price plunge could suggest there aren’t many Bitcoin holders selling anymore.
As pointed out by an analyst in a CryptoQuant post, large stablecoin redemptions have usually accompanied major declines in the Bitcoin price during this bear market. A stablecoin is said to be “redeemed” when an investor exchanges the token for fiat through the issuer of said coin.
Investors usually use stablecoins when they want to escape the volatility associated with tokens like Bitcoin. Thus, redemptions of them can be a sign that investors are exiting the market currently. The “stablecoins redeemed supply” is an indicator that measures the total amount of such redemptions happening across the market of all types of stables.
Another metric that keeps track of these withdrawals is the “stablecoins redeem event count,” which, as its name already implies, measures the total number of redemptions taking place in the market rather than the total sum of their value.
Now, here is a chart that shows the trend in both these stablecoin redemptions indicators over the past year:
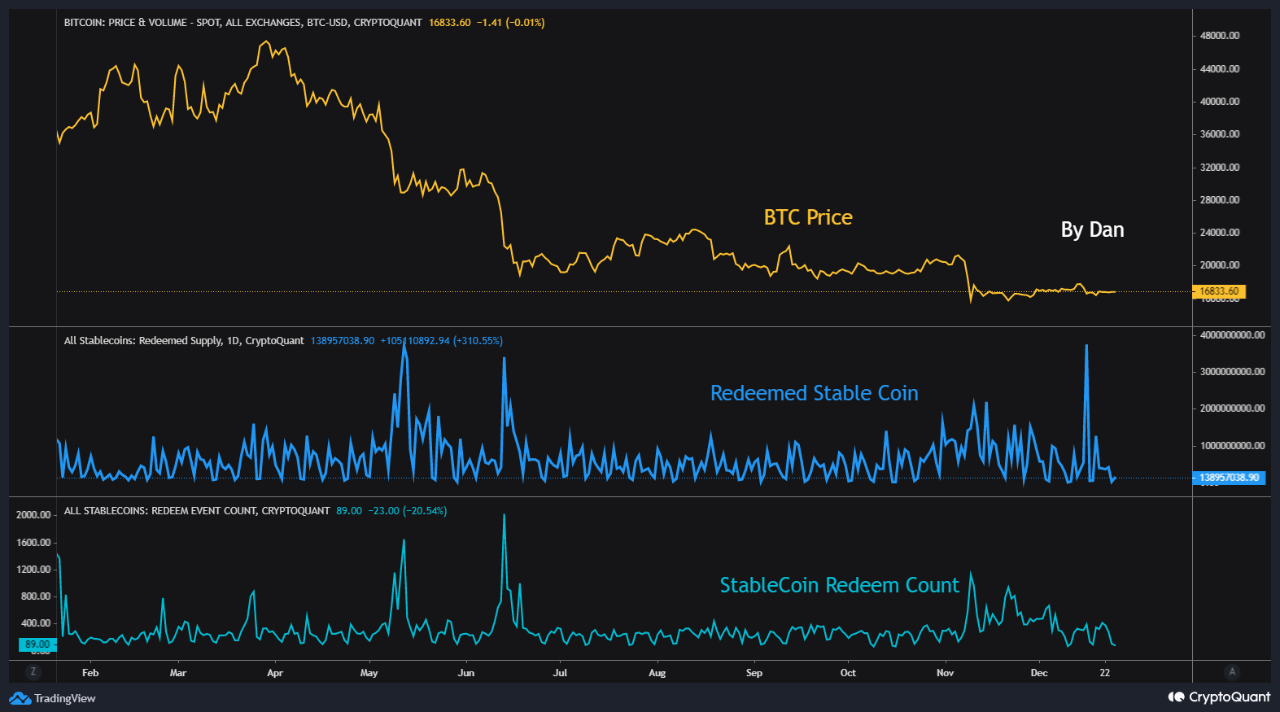
As the above graph displays, during the large declines in the price of Bitcoin in this bear market so far, the stablecoins redeemed supply has usually registered high values. This trend makes sense as investors would be converting to stables to sell off during the crash, and then redeeming them for fiat.
The stablecoin redeem count also observed spikes during such dumping events, except for the most recent one. This implies that in the price plunges before the latest one, many investors always took part in stablecoin redemptions, showing that the market had a uniform and more natural selling appetite.
In the most recent decline where Bitcoin went from above $18k to below $17k, however, the redeemed count has stayed low while the redeemed supply has still observed very high values. This means that only a few whales were involved in this dumping event, a possible sign that largescale selling pressure may be getting depleted in the market.
At the time of writing, Bitcoin’s price floats around $16,800, up 1% in the last seven days. Over the past month, the crypto has gained 2% in value.


Crypto needs to move on from the LUNA crash and start trusting algorithmic stablecoins again.

The move comes in response to a wave of mainstream media attacks and FUD, primarily from the Wall Street Journal.


Brazil is set to launch a Central Bank Digital Currency (CBDC) in 2024, a move that could contribute to its status as an economic leader in South America.
A Bitcoin on-chain metric still hasn’t formed the same condition as in the previous bottom, suggesting that the current low may not be in yet.
As pointed out by an analyst in a CryptoQuant post, the top 10 stablecoin exchange inflows saw a rise during the July 2021 bottom.
The “stablecoin exchange inflows (top 10)” is an indicator that measures the sum of the ten largest stablecoin transactions that are heading towards exchanges. The metric includes data of all types of stablecoins.
Since the top ten transfers are usually from the whales, this indicator can tell us whether whales are active on exchanges or not.
Usually, investors shift to stables when they want to escape the volatility associated with most other cryptos. Once these holders feel that the prices are right to re-enter these markets, they buy into other coins using their stablecoins, thus providing a buying pressure to them.
When the value of the top 10 stablecoin exchange inflows is high, it means whales could be sending large amounts of stables to exchanges for buying other coins. Such a trend could therefore be bullish for the prices of cryptos like Bitcoin.
Now, here is a chart that shows the trend in this on-chain indicator over the last few years:

Looks like the value of the metric has been muted in recent days | Source: CryptoQuant
As you can see in the above graph, the stablecoin inflows (top 10) to spot and derivative exchanges have been displayed separately, since spot platforms are what investors use for converting their coins.
It seems like when the Bitcoin bottom formed back in July 2021 during the mini-bear period of the time, the spot exchange version of the metric sharply rose up.
This implies that whales participated in some heavy buying during that time with their stablecoin reserves, paving way for a bullish reversal in BTC.
In recent weeks, the top 10 stablecoin inflows to spot exchanges haven’t shown any significant movements, which means whales aren’t providing any significant buying pressure yet.
If the past trend is anything to go by, this could be an indication that the current Bitcoin bottom still hasn’t formed.
At the time of writing, Bitcoin’s price floats around $16.8k, down 2% in the last week. Over the past month, the crypto has lost 18% in value.
The below chart shows the recent trend in BTC:

The value of the crypto seems to have declined during the last couple of days | Source: BTCUSD on TradingView
Featured image from Kanchanara on Unsplash.com, charts from TradingView.com, CryptoQuant.com


Regulatory pressure continues to limit each upside breakout, but data shows some compelling reasons for an eventual crypto market rally.


The chief economist said the Supervisor of Financial Service Providers and the Israel Securities Authority should be granted more powers to oversee the industry.

On-chain analytics show that ETH and stablecoins have been flowing out of centralized exchanges in the aftermath of FTX’s collapse.
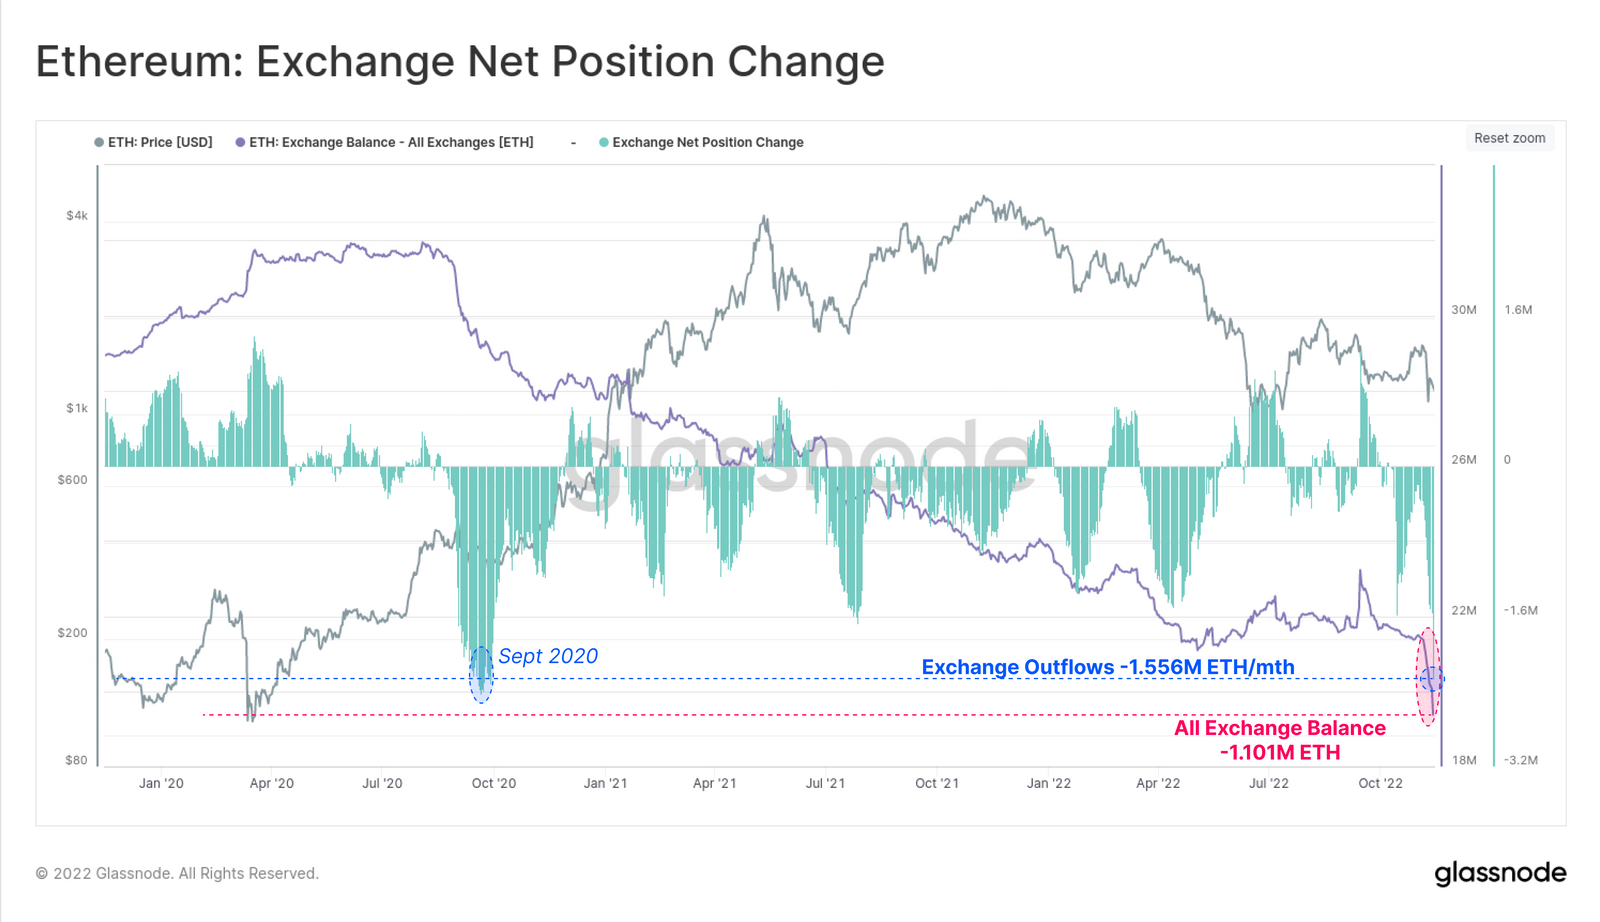

Investors piled into stablecoins following FTX’s collapse and an uptick in DEX activity suggests a rising interest in self-custody options.

CEO Marszalek says the firm has recovered much of the funds and has less than $10M in exposure to FTX.


