The EU’s comprehensive crypto guidance does not introduce entirely new regulations for fiat backed stablecoins, former central banker Jón Egilsson writes. Instead it affirms existing rules that many current issuers are not yet following.
Treasury Secretary Yellen Says U.S. Needs Better Stablecoin Regulation
“A federal regulator should have the ability to decide if a stablecoin issuer should be barred from issuing such an asset,” she told lawmakers on Tuesday.
Treasury Secretary Janet Yellen Warns of Crypto Risks
U.S. Treasury Secretary Janet Yellen is set to tell Congress that the crypto industry poses several potential hazards to the financial system, including the dangers of stablecoins, runs on crypto platforms and volatile prices, according to a brief portion of her testimony posted Monday.
Stablecoin Tether’s Increasing Dominance Is Bad for Crypto Markets, JPMorgan Says
Other stablecoins such as USD Coin may benefit from the coming regulatory crackdown and gain market share, the report said.
Stablecoins Surge: USDT Leads $400 Million Inflows, Signaling Investor Confidence
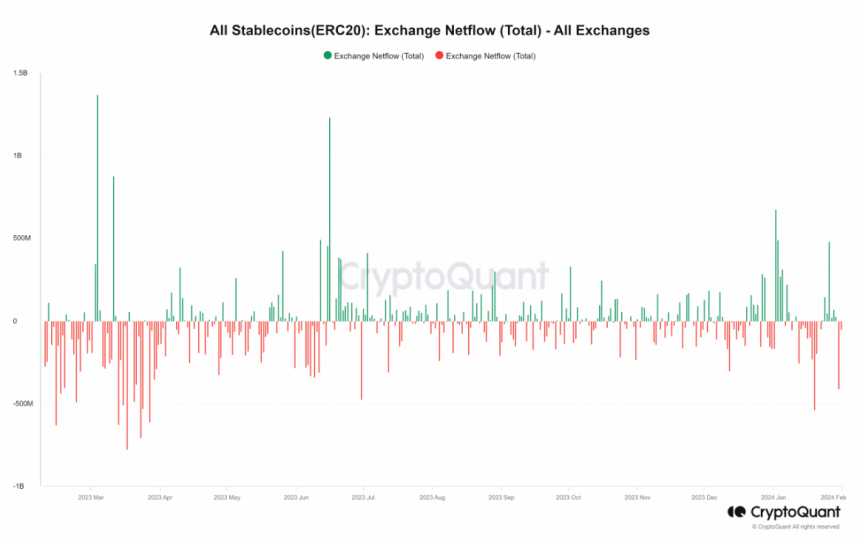
The cryptocurrency industry has witnessed a significant change in the movement of stablecoins, offering valuable observations into the evolving dynamics of the market. Recent data from IntoTheBlock and CryptoQuant has shown a surge in stablecoin inflows into exchanges, reaching record highs in January.
Notable inflows were observed on January 2nd ($478 million), January 3rd ($489 million), and January 26th ($673 million). However, this trend has since reversed, with outflows dominating the market.
On January 30th, there was a substantial outflow of $412 million, marking the second-highest daily outflow recorded in the month, following the $541 million outflow on January 19th.
USDT Leads Stablecoin Rally, But Caution Persists In Crypto Market
An analysis of the 24-hour trading volume of the top stablecoins on CoinMarketCap reveals that Tether (USDT) and USD Coin (USDC) collectively accounted for approximately 90% of the total volume. Tether, in particular, has been dominant in terms of flows, with a 24-hour trading volume exceeding $42 billion, while USDC’s volume stood at around $6 billion.
Taking a closer look at the flow of USDT through CryptoQuant, it was found that there was a substantial inflow of $373 million on January 26th, followed by a prevailing trend of outflows, with over $83.4 million observed at the time of writing.
Experts suggest that the rise in stablecoin inflows onto exchanges, particularly the $478 million on January 2nd, could indicate traders’ and investors’ readiness to participate in the market or their desire to safeguard their funds during uncertain times.
Conversely, the shift towards outflows may signal caution or preparation for potential market volatility. Additionally, the substantial inflow of stablecoins, especially USDT, could indicate increased buying power and intentions to establish positions in the cryptocurrency space.
Stablecoins Surge, Signal Investor Preparation
The increase in stablecoin inflows onto exchanges can be interpreted in two ways. Firstly, it may indicate that investors and traders are preparing to enter the market. By moving their funds into stablecoins, they can quickly transition into other cryptocurrencies when they perceive favorable opportunities. This suggests a readiness to participate and take advantage of potential market movements.
Secondly, the rise in stablecoin inflows may also reflect a desire to keep funds in a secure manner, particularly during uncertain times. Stablecoins offer stability by being pegged to a specific asset, such as the US dollar, which can be appealing to investors seeking to protect their capital in times of market volatility. This cautious approach can be seen as a way to safeguard funds and mitigate risks in an unpredictable market.
Tether Records Nearly $3 Billion Profit
Meanwhile, Tether announced a “record-breaking” $2.85 billion in quarterly profits as the market capitalization of its main token, USDT, approached $100 billion.
According to a blog post by Tether, the interest gained on the company’s enormous holdings in US Treasury, reverse repo, and money market funds—which support the USDT stablecoin—account for around $1 billion of the earnings in the most recent quarterly attestation report that was released on Wednesday. Everything else was “mainly” due to the growth of Tether’s other assets, like gold and bitcoin (BTC), the stablecoin issuer said.
Featured image from Wccftech, chart from TradingView
Tether Reports Record $2.85B Profit as Biggest Stablecoin Nears $100B Market Cap
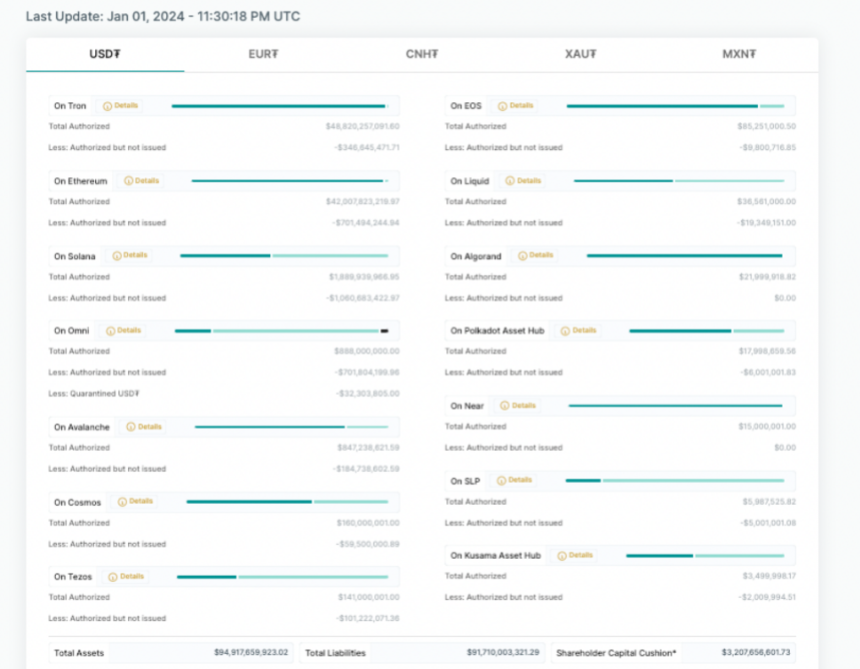
The USDT stablecoin issuer held over $5.4 billion in excess reserves as of 2023 year-end, according to its latest attestation.
Bitcoin Rally Still Has Some Legs Left, Santiment Explains Why
The analytics firm Santiment has explained that the current Bitcoin rally could still have some legs left, based on this on-chain trend.
Bitcoin & Ethereum Leave Exchanges, While Tether Sees Deposits
In a new post on X, Santiment has discussed the recent trends in the Supply on Exchanges for the three largest assets in the cryptocurrency sector: Bitcoin (BTC), Ethereum (ETH), and Tether (USDT).
The “Supply on Exchanges” here refers to a metric that keeps track of the percentage of the total circulating supply of any given coin that’s currently sitting in the custody of the centralized exchanges.
When the value of this metric goes up, it means that the investors are depositing their coins to these platforms currently. On the other hand, a decline implies net withdrawals are occurring on the exchanges right now.
What these trends suggest for the given asset and the sector as a whole depends on the type of cryptocurrency it is in question. In the case of volatile coins like Bitcoin and Ethereum, net deposits can be a sign that investors are looking to sell these assets, which can naturally have a negative impact on their prices.
Since the altcoins generally only see a rotation of capital through these largest cryptocurrencies, a bearish trend for them can have a domino effect on their prices as well.
Withdrawals for these volatile coins, on the contrary, can be bullish for the market, as they imply the investors are perhaps looking to hold onto their tokens for extended periods.
Now, here is a chart that shows the trend in the Supply on Exchanges for Bitcoin and Ethereum over the past year:
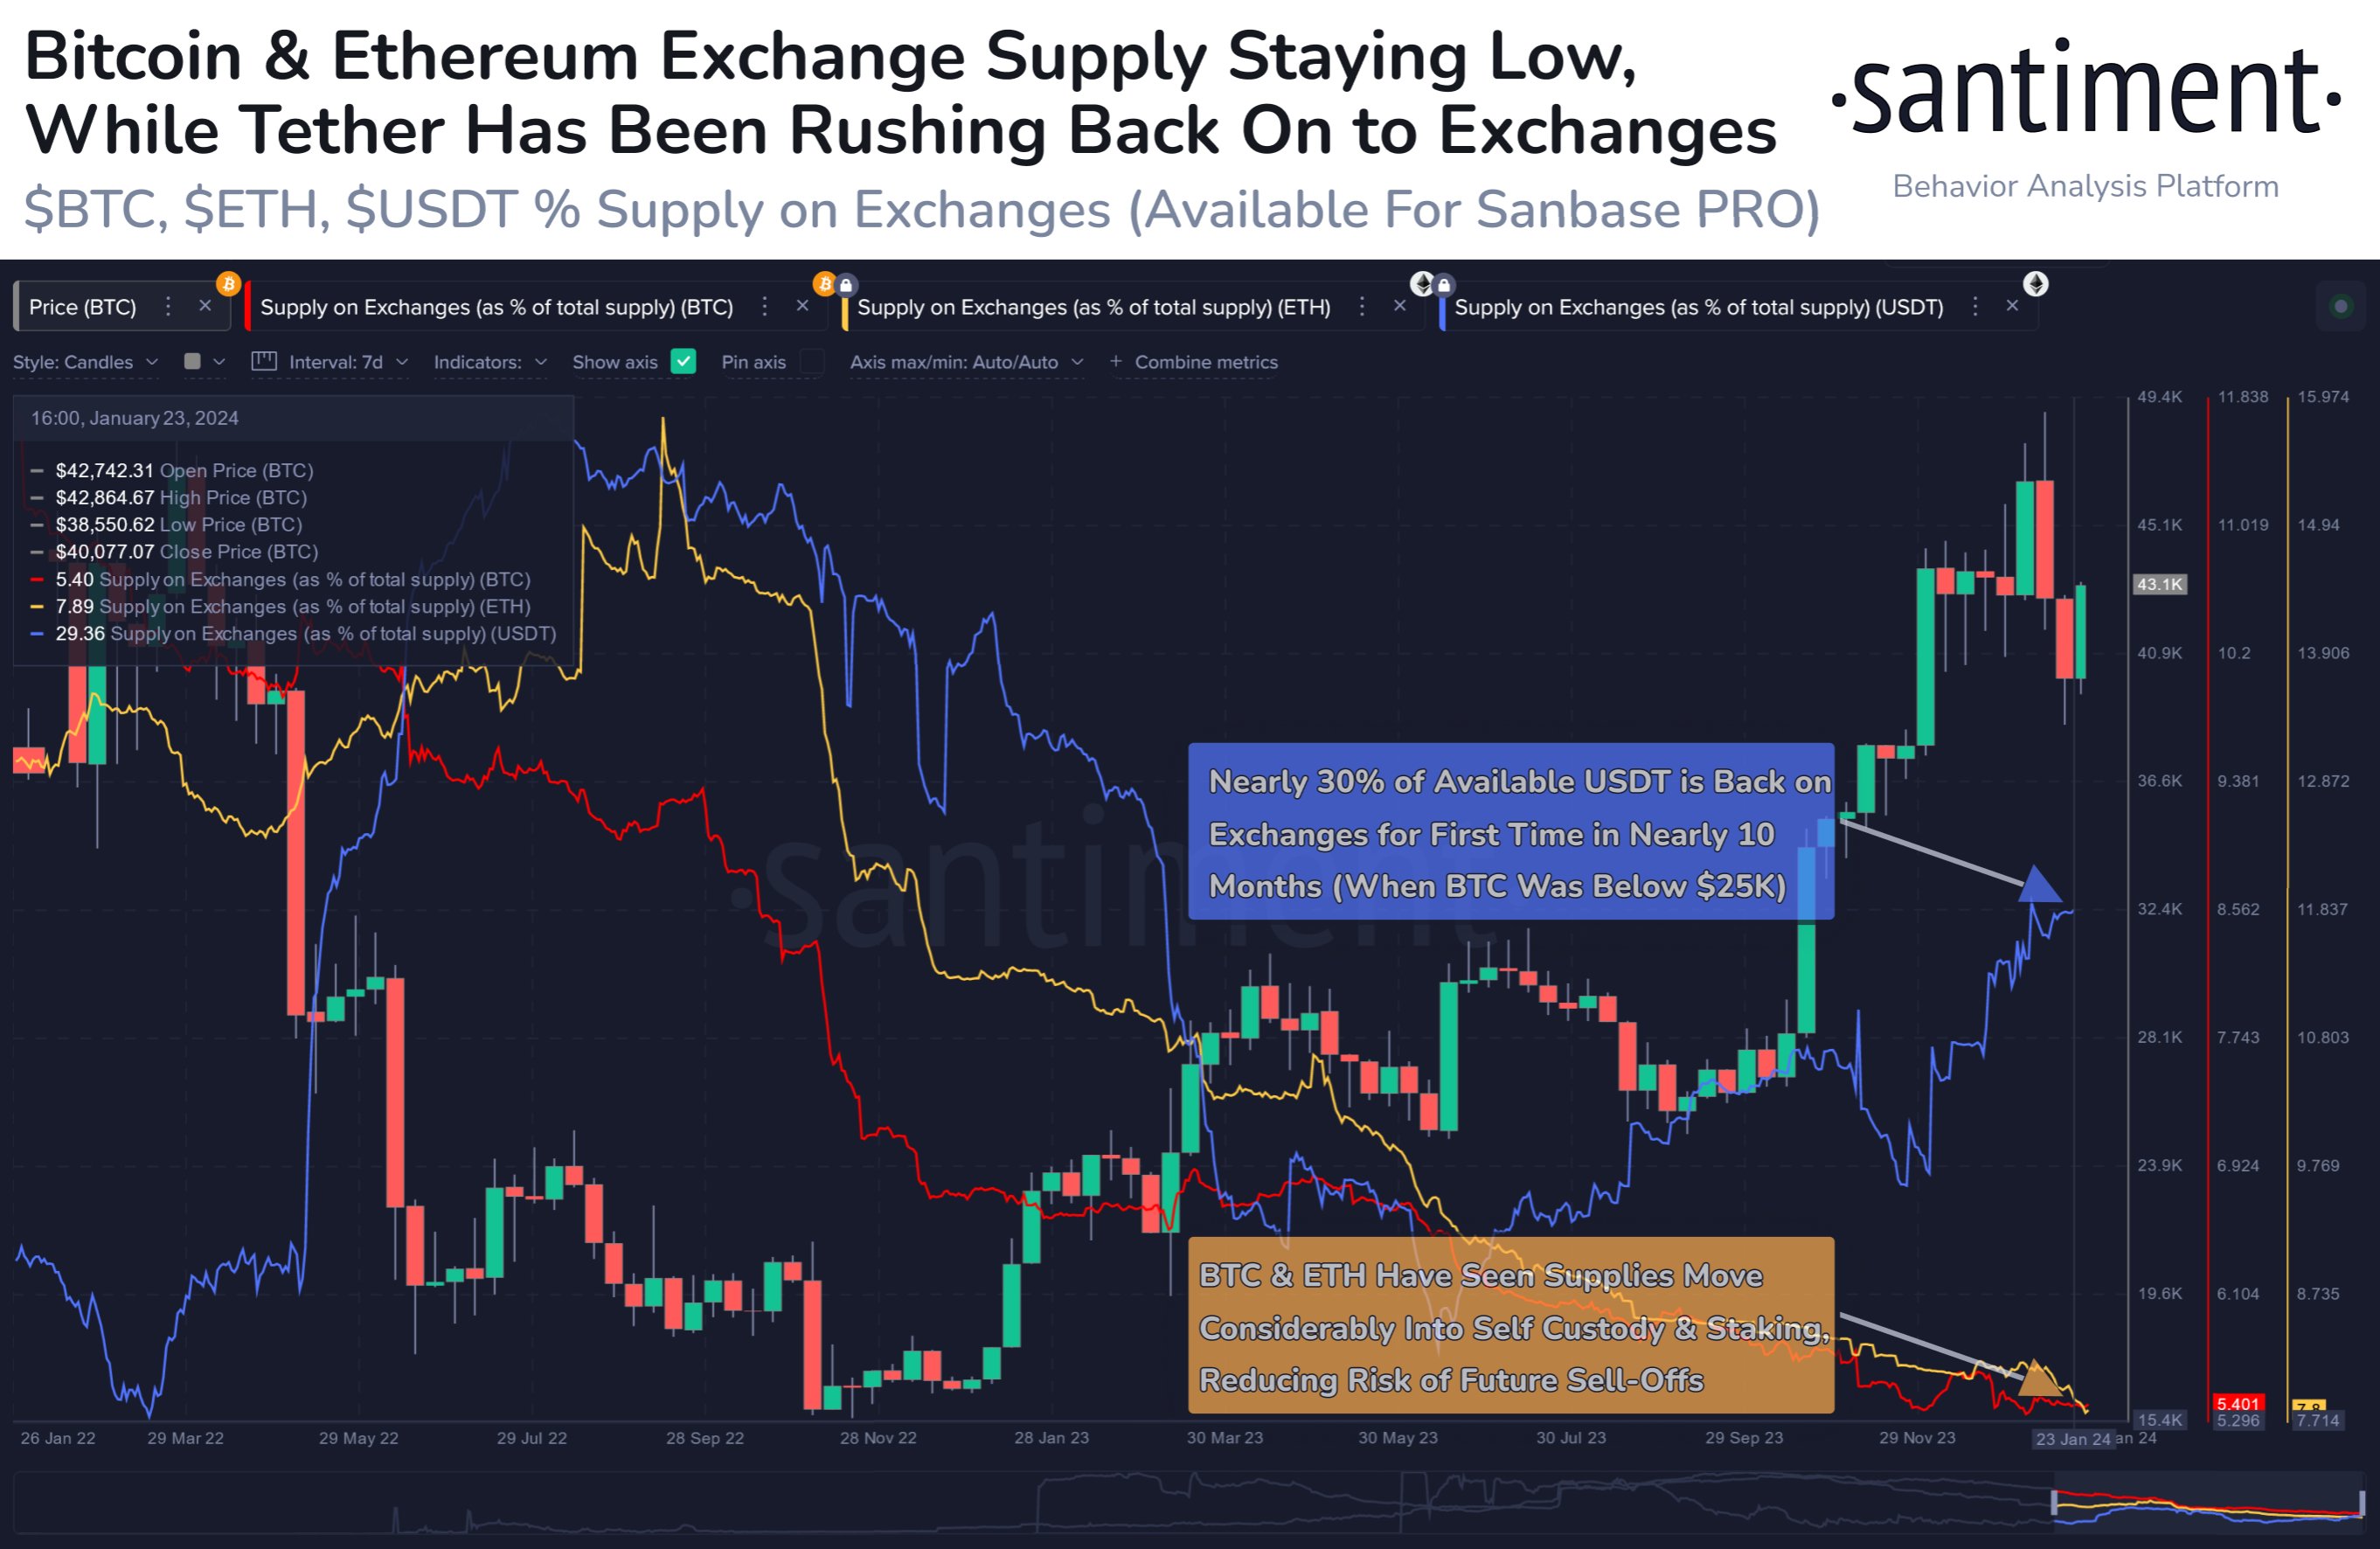
As displayed in the above graph, the Bitcoin and Ethereum Supply on Exchanges have continued their downtrend following the spot ETF approvals for BTC a few weeks back.
In the same chart, Santiment has also attached the data of the indicator for Tether. It would appear that while BTC and ETH have seen supply move off exchanges, USDT has observed net deposits.
The largest stablecoin in the sector has witnessed around 4% of its entire supply shifting to these platforms over the last five weeks, which has taken the indicator’s value to the highest point in almost ten months.
Investors use stablecoins whenever they want to escape the volatility associated with assets like BTC and ETH. Such holders who seek safe haven in these fiat-tied tokens instead of fiat itself, though, usually plan to return back to the volatile side of the cryptocurrency sector eventually.
Deposits of stablecoins can, therefore, be a sign that these investors want to buy back into Bitcoin and others. As such, the sector could see a bullish effect from this dry powder being deployed by the stablecoin holders.
“The increase in buying power implies that the mid-term 3+ month #bullcycle (starting back in October) could still have some legs, particularly with just 79 days until the #Bitcoin halving, estimated to occur on April 18th,” notes the analytics firm.
BTC Price
Bitcoin has made some notable recovery over the last few days as its price has now broken back above the $43,300 mark.
Circle to Issue Its Stablecoin USDC on Celo Network to Boost RWA Capabilities
Celo, which is in the midst of transforming into an Ethereum layer 2 network, increasingly positions itself as a blockchain for real-world assets.
A Backdoor Regulatory Option Haunts U.S. Crypto
After the 2008 global financial meltdown, Congress set up a round table of regulators who could wield a unique tool against the next emerging threats. The Financial Stability Oversight Council (FSOC) can tag companies with systemic-risk labels that saddle them with tremendous new restrictions, and the crypto sector has the council’s attention.
Hong Kong Gets Spot-Bitcoin ETF Application, Stablecoin Interest From China’s Harvest Global: Reports
Venture Smart Financial Holdings is also aiming for a spot-bitcoin ETF and is involved in the discussions about the stablecoin sandbox.
Solana Stablecoin Volume Reaches Record High Of $300 Billion In January
According to the latest on-chain data, the Layer-1 network Solana has hit a significant milestone in terms of the transfer volume of stablecoins this month.
Solana Overtakes Tron In Stablecoin Transfer Volume
Data from the blockchain analytics platform Artemis shows that the stablecoin transfer volume on Solana has already surpassed $300 billion in January. This is the largest transfer volume recorded by stablecoins on the Layer-1 blockchain in a single month.
To put this figure into context, the Solana network registered $297 billion in stablecoin volume in the entire December. Meanwhile, the blockchain’s stablecoin transfer volume was about $11.56 billion in January 2023, reflecting an over 2,500% growth in the past year.
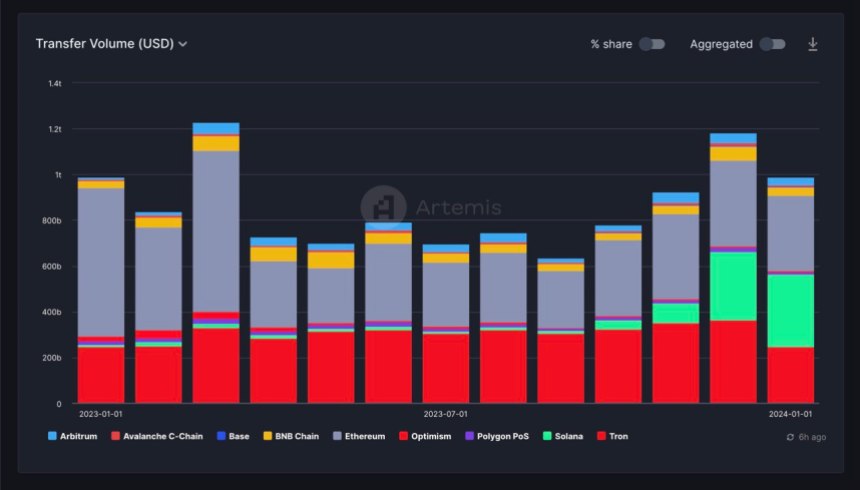
From the chart above, it is clear that Solana’s stablecoin activity has been on a steady rise since October, increasing by more than 650% in the past few months. This growth has also impacted the network’s share in the stablecoin market, with Solana now boasting about 32% market share.
Unsurprisingly, Ethereum leads the market for stablecoins, with its transfer volume already reaching almost $317 billion in January. Meanwhile, the Tron network trails Solana in third place, with a stablecoin volume of roughly $240 billion.
On Thursday, January 18, Paxos revealed the launch of its regulated stablecoin, USDP, on the Solana network. According to DefiLlama data, USDC remains the dominant stablecoin on the Layer-1 network, with a market cap of over $1 billion.
Paxos is thrilled to share our regulated stablecoin USDP is now live on the @solana blockchain! This integration makes it easier for anyone to access and use the safest, most reliable stablecoins in the market. Learn more here: https://t.co/0j4Kj0yyPk pic.twitter.com/1doexKvVmY
— Paxos (@Paxos) January 18, 2024
SOL Price Overview
Despite Solana’s burgeoning network activity, the price performance of its native token SOL has somewhat dampened in the past few weeks. As of this writing, the Solana token is valued at $92, reflecting a 0.6% decline in the last 24 hours.
This sluggish performance in the past day underscores the altcoin’s challenges since the turn of the year. After reaching a multi-month high of $124 at the end of 2023, the SOL price has largely struggled to hold above the $100 mark.
According to data from CoinGecko, the Solana token is down by more than 5% in the past week. Meanwhile, the coin has declined by about double that figure since the beginning of 2024.
Nevertheless, SOL maintains its position as the fifth-largest cryptocurrency in the sector, with a market capitalization of more than $40 billion.
In Search of Financial Freedom: The Answer Lies With Bitcoin, Not Stablecoins
Does Howard Lutnick Know ‘the Truth’ About Tether?
Speaking at Davos, the Cantor Fitzgerald CEO says the stablecoin issuer has the money to back USDT. Maybe it’s time we all started to believe in Tether, despite the “truthers”?
Big Wall Street CEO Addresses Controversy Around Tether’s Stablecoin Assets: ‘They Have the Money’
Cantor Fitzgerald CEO Howard Lutnick vouched for stablecoin issuer Tether’s legitimacy on Tuesday, addressing what has been one of the big questions in crypto over the years as its stablecoin, USDT, has grown into a behemoth: Does Tether have the money it says it does.
Stablecoin Takeover? Record Tether 71% Dominance Raises Questions About Crypto Future
Tether, the issuer of the ubiquitous USDT stablecoin, cemented its dominance in 2023, ballooning its market share to a staggering 71%. This explosive growth, however, comes with a chilling undercurrent: a United Nations report linking USDT to a surge in cybercrime and money laundering in Southeast Asia.
Glassnode data paints a stark picture of Tether’s ascent. Its market capitalization reached a record $95 billion in January 2024, fueled by a 40% increase in USDT supply over the past year. Meanwhile, competitors like Circle’s USDC saw their market share shrink, with USDT now commanding over 7 times the circulation of its nearest rival.
Tether Market Dominance Soars
Paolo Ardoino, Tether’s new CEO, has prioritized cooperation with U.S. law enforcement. The company boasts of freezing wallets linked to sanctions lists and recovering over $435 million in illicit funds.
However, the UN report casts a shadow on these efforts, detailing how USDT facilitates “sextortion,” “pig butchering” scams, and underground banking across Asia.
While Tether has proactively banned over 1,260 addresses linked to criminal activity, the sheer volume of illicit transactions raises concerns about the effectiveness of these measures.
Critics point to Tether’s opaque reserve backing as a breeding ground for misuse, calling for greater transparency to combat money laundering.
Tether’s Reign At Risk: Regulatory Challenges
The stablecoin market, once touted as a bridge between traditional finance and the crypto world, now faces a reckoning. Tether’s dominance is undeniable, but its association with criminal activity threatens to erode trust and trigger stricter regulations.
Meanwhile, Circle’s recent IPO filing hints at a potential shift in the landscape. With regulatory scrutiny intensifying, Tether’s future hinges on its ability to address concerns about transparency and combat illicit activity.
Can it clean up its act and maintain its crown, or will the tide turn towards its more transparent rivals? Only time will tell if Tether’s reign as the king of stablecoins will weather the storm of controversy.
With its historic 71% market share, Tether’s reign over the stablecoin realm is undeniable. Yet, the shadow of illicit activity threatens to eclipse its success.
As regulators sharpen their focus and competitors like Circle step into the ring, the question looms: will Tether clean house and retain its crown, or will this be the tipping point for a stablecoin revolution, reshaping the future of crypto itself?
Only time will tell if Tether’s dominance signals a bright new era for digital currencies or serves as a cautionary tale, paving the way for a more transparent and accountable crypto landscape. The gloves are off, and the fight for the future of stablecoins is just beginning.
Featured image from Shutterstock
Hong Kong Regulators Propose Mandatory Licenses for Fiat-Backed Stablecoin Issuers
The Hong Kong Monetary Authority (HKMA) and the Financial Services and the Treasury Bureau (FSTB) are also planning a sandbox to provide guidance on compliance.
2023: A Critical Juncture for the Global Stablecoin Market
Moody’s Senior Director Yiannis Giokas said adoption accelerated this year, despite many destabilizing trends.
S&P’s Stablecoin Report Is a Vote of Confidence for Crypto
Stablecoins are “something we’re putting strong resources towards, because we know it’s a growing area both in traditional and new financial areas,” a leading S&P analyst said.
Bitcoin Deja Vu: Capital Inflows Mirror Pre-2021 Bull Run Momentum
On-chain data shows the cryptocurrency capital inflows currently look similar to December 2020, right before Bitcoin rallied from $18,000 to $65,000.
Bitcoin & Ethereum Are Getting $19.7 Billion In Capital Injections Currently
As explained by analyst Ali in a new post on X, Bitcoin and Ethereum are receiving a large amount of capital inflows currently. To showcase these positive flows, the analyst has referred to the “BTC + ETH Net Position Change” indicator from the on-chain analytics firm Glassnode.
What this metric does is that it keeps track of the 30-day change taking place in the combined realized cap of these top two cryptocurrencies. The “realized cap” here basically refers to the total amount of capital (in USD) that investors have used to purchase a given asset.
As such, the metric’s net position change could provide hints about whether the total money invested into the coin in question has gone up or down during the past month.
Now, here is a chart that shows the trend in this indicator for Bitcoin and Ethereum over the past few years:
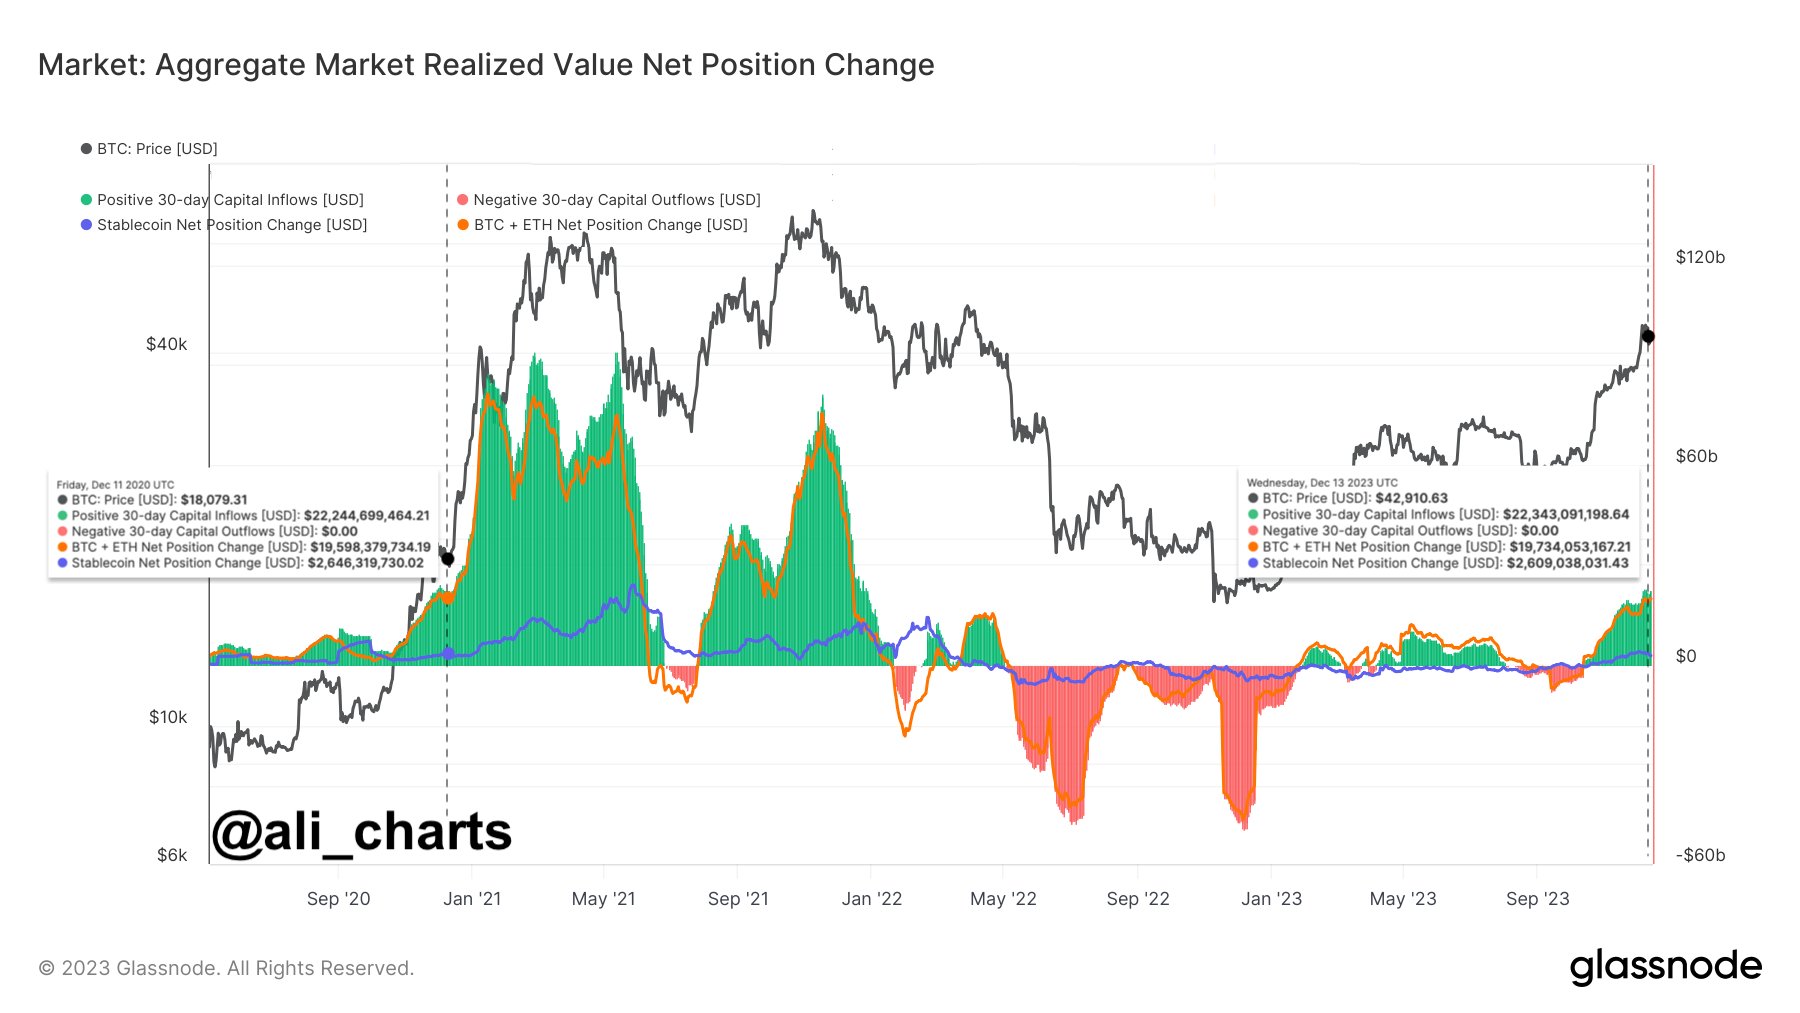
As displayed in the above graph, the Bitcoin + Ethereum Net Position Change has been inside the positive territory recently and has only been climbing up. The trend naturally makes sense, as both of the assets have registered some sharp rises during the past month.
Currently, the indicator has a value of $19.7 billion. As Ali has pointed out, “This is around the same capital inflow we saw back in December 2020 before BTC surged from $18,000 to $65,000!”
In the same chart, data for two other metrics is also shown. The first is the “Stablecoin Net Position Change,” which, as its name suggests, keeps track of the monthly inflows and outflows for the major USD stablecoins in the sector.
Unlike Bitcoin and Ethereum, though, this metric doesn’t make use of the realized cap, but simply the supply of the stables. This is obviously due to the fact that these coins have mostly the same value at all points, so the realized cap wouldn’t be any different from the market cap (which itself is equivalent to the supply as the price is $1).
From the chart, it’s visible that the stablecoins have also enjoyed positive inflows recently. This means that all three major asset classes in the sector, Bitcoin, Ethereum, and the stables, are receiving capital injections currently.
Most of the capital inflows and outflows towards the cryptocurrency sector happen through these three. The altcoins only receive their capital through a rotation from these core assets.
Thus, the stablecoins and top two cryptocurrencies simultaneously enjoying positive inflows have historically been a very bullish combination for the sector as a whole. This constructive combination didn’t form for most of this year but finally has during this latest leg in the rally.
The last indicator on the chart keeps track of the net incomings and outgoings from the sector as a whole by simply summing up the netflows for BTC + ETH and the stables. As is apparent, this metric also has a value similar to December 2020 at the moment.
Looking at Bitcoin’s historical performance following December 2020, it could mean that the BTC price is set for another price surge going forward.
BTC Price
Bitcoin had recovered above the $43,000 level just earlier, but it appears the coin has seen a setback as it’s now once again trading below the mark.


