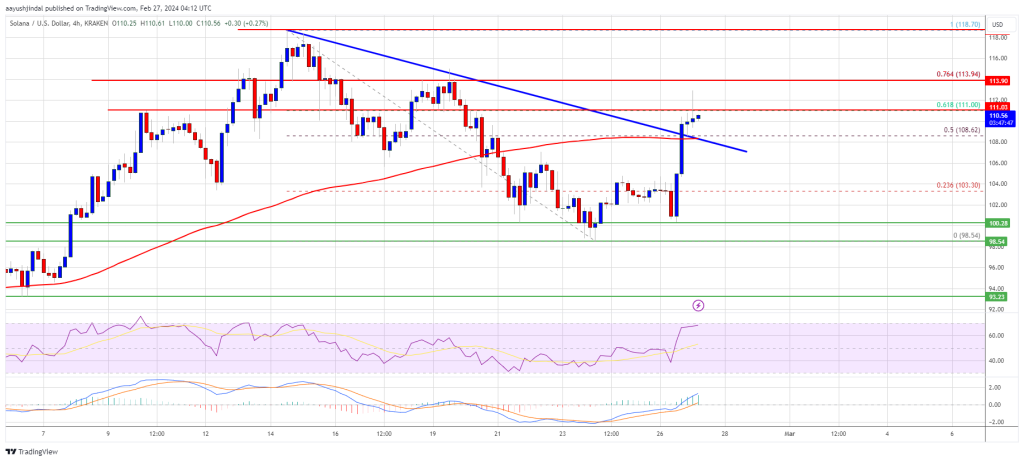
Solana tumbled and declined toward $110. SOL price is now correcting losses above $140 and facing hurdles near the $160 resistance zone.
- SOL price gained bearish momentum and declined below $150 against the US Dollar.
- The price is now trading below $160 and the 100 simple moving average (4 hours).
- There is a key bearish trend line forming with resistance at $160 on the 4-hour chart of the SOL/USD pair (data source from Kraken).
- The pair could continue to recover if it clears the $150 and $160 resistance levels.
Solana Price Starts Recovery
Solana price started a major decline below the $180 and $160 support levels. SOL declined over 20% and even tumbled below the $150 level. Finally, the bulls appeared near $110.
A low was formed at $115.04 and the price is now attempting a recovery wave like Bitcoin and Ethereum. There was a decent increase above the $125 and $132 levels. The price cleared the 23.6% Fib retracement level of the downward move from the $204 swing high to the $115 low.
Solana is now trading below $150 and the 100 simple moving average (4 hours). Immediate resistance is near the $150 level. The next major resistance is near the $160 level.
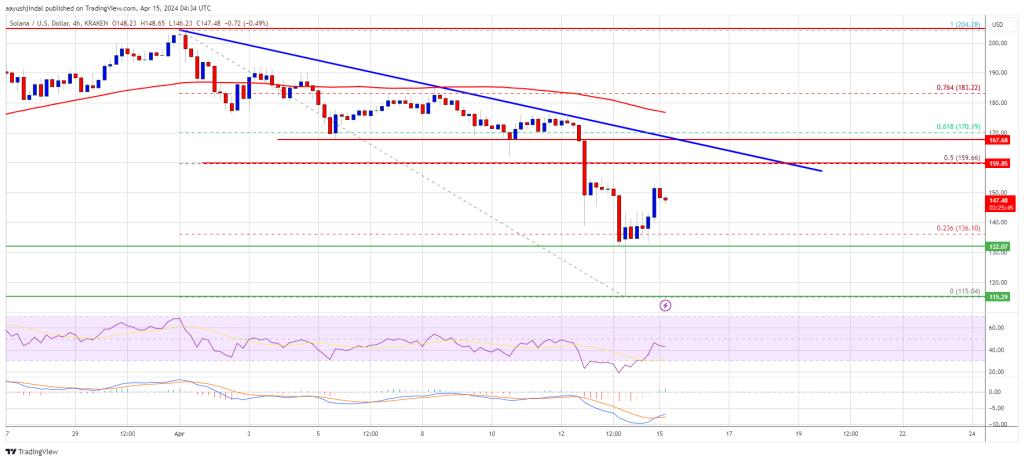
Source: SOLUSD on TradingView.com
There is also a key bearish trend line forming with resistance at $160 on the 4-hour chart of the SOL/USD pair. The trend line is near the 61.8% Fib retracement level of the downward move from the $204 swing high to the $115 low. A successful close above the $160 resistance could set the pace for another major increase. The next key resistance is near $182. Any more gains might send the price toward the $200 level.
Are Dips Supported in SOL?
If SOL fails to rally above the $160 resistance, it could start another decline. Initial support on the downside is near the $140 level.
The first major support is near the $132 level, below which the price could test $125. If there is a close below the $125 support, the price could decline toward the $115 support in the near term.
Technical Indicators
4-Hours MACD – The MACD for SOL/USD is gaining pace in the bullish zone.
4-Hours RSI (Relative Strength Index) – The RSI for SOL/USD is below the 50 level.
Major Support Levels – $140, and $132.
Major Resistance Levels – $150, $160, and $182.