The meme coin frenzy seems to have catalyzed higher volumes on the Solana blockchain, which also boasts greater capital efficiency than Ethereum.
Solana Meme Coin Slerf Clocks Higher Trading Volume Than All of Ethereum
Some professional traders have termed SLERF a “blue chip meme” – a nod to blue chip stocks – for reasons ranging from its fair distribution among holders to perceived future demand.
Bitcoin ETF Listings Will Be Quick but Money Flows Could Take Months: 21Shares Co-Founder
Ophelia Snyder says it is impossible to conceptualize the changes in bitcoin trading volumes likely through ETF inflows.
OKX NFT platform tops Blur and OpenSea in daily trading volume

OKX NFT recorded a 24-hour trading volume of $50 million on Dec. 18, surpassing its competitors in the NFT space.
THORChain becomes third largest DEX as Rune surges 50% in a week

THORChain $1.32 billion in trading volume over the last week only trails Uniswap and PancakeSwap among non-centralized exchanges.
Coinbase narrows loss while crypto trading volumes fall in Q3

Despite seeing falling trading volumes, Coinbase said they were “pleased” with how the quarter played out.
Will Bitcoin price hold $26K ahead of monthly $3B BTC options expiry?

Bitcoin trading volumes at a five-year low and the S&P 500 reaching its lowest levels in over three months could spell trouble for BTC bulls.
What The Drop In Spot And Derivatives Volumes Means For The Price Of Bitcoin
It has been a quiet week of caution for Bitcoin traders in terms of price action. This caution has trickled into trading volume in particular, as volumes on major crypto exchanges for both spot Bitcoin trading and Bitcoin derivatives have fallen far below their levels at the beginning of the year.
On-chain data from CryptoQuant charts have shown the daily spot and derivatives trading volume of Bitcoin has been steadily declining since the first quarter of the year. The question is, what does this collapse in trading volumes mean for the future price of Bitcoin?
Decline In Trading Volumes
Trading volumes this year have declined significantly from their highs in March during the Silicon Valley Bank fiasco. Since this period, the derivatives or futures market has fallen 96% and the spot market has fallen 98%.
Bitcoin trading in particular, has been down by a significant margin the past week. Data from CoinMarketCap has shown Bitcoin spot trading volume has decreased by 33.67% in a 24-hour timeframe. Similarly, the spot exchange trade volume was shown by CryptoQuant data to be 9,627, down 81% from 50,692 at the beginning of the week.
The situation looks even more glaring when you consider falling derivatives volumes as well. On-chain data collected by CryptoQuant indicates that the derivatives trade volume is currently at 108,852. This represents a decrease of 88% from the volume of 950,331 at the beginning of the week.
What Does This Mean For The Price Of Bitcoin?
When activity in these markets dwindles, it signals a lack of interest from institutional traders and retail investors. With interest seeming to wane, the next few weeks could determine Bitcoin’s near-term direction. As the largest cryptocurrency in the world, this could also determine the direction of the majority of the crypto market.
At the time of writing, Bitcoin is trading at $26,556. Without much trading activity to drive prices up, Bitcoin could continue trading sideways or even face downward pressure. The next major support for Bitcoin is at $25,000, and a fall below this price could indicate a prolonged bearish trend with increased selling pressure.
Another way this could go is the lower price eventually leading to higher volumes again as investors see an opportunity to buy. According to a social media post by crypto analyst Captain Faibik, Bitcoin could reach as low as $23,000 in October before breaking out to reach $34,500 by early next year.
Similarly, Didar Bekbauov, founder and CEO of Bitcoin joint mining business Xive, stated that the price of Bitcoin could soar past the year-to-date (YTD) price of $31,700 while speaking to Bitcoinist.
(This site’s content should not be construed as investment advice. Investing involves risk. When you invest, your capital is subject to risk).
Featured image from iStock
Binance’s Bitcoin Trading Volume Plunges 57% as Regulatory Pressure Mounts
As legal challenges against Binance mount, the average spot BTC trading volume on the platform has decreased 57% since Sep. 1
Crypto Spot Market August Trading Volume Hits 4.5-Year Low as Volatility Fails to Spur Activity
Volatility following the Grayscale’s court victory over the SEC failed to translate into trading volumes on centralized exchanges, CCData said.
XRP Records Highest Average Daily Trade Volume Among Altcoins In August – Report
Prominent crypto research firm Kaiko reports that the XRP token recorded impressive trade volume strides across August 2023. This development comes amidst the token poor price performance in the said month.
XRP Dominates Altcoin Market In Trade Volume Amidst Price Downtrend
According to the latest Data Debrief by Kaiko on September 4, the market research firm notes that XRP recorded an average daily trade volume of $462.8 million in August, representing the highest value of that metric in the altcoin market.
Solana (SOL) followed in second place, with a trade volume of $128.4 million. Other altcoins that also experienced a significant average daily trade volume in August included Binance Coin (BNB), Dogecoin (DOGE), and Litecoin (LTC), among others.
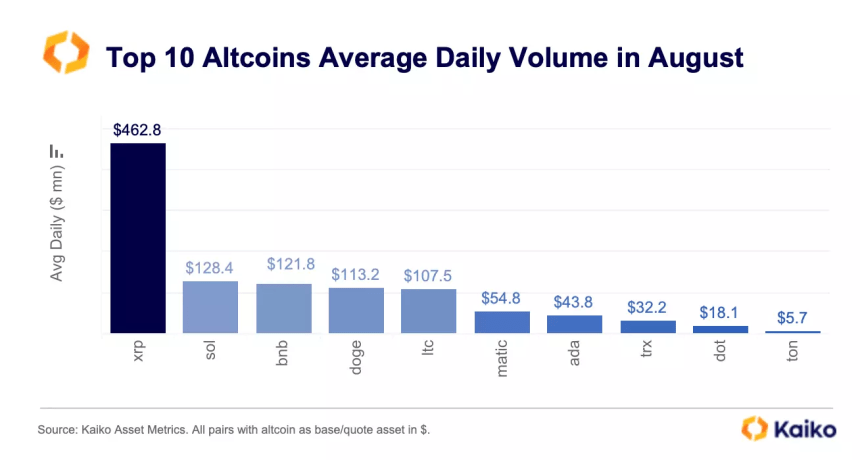
As earlier stated, XRP’s surge in trading volume was accompanied by underwhelming market performance. Kaiko notes that the altcoin experienced a 25% price decline in August.
This negative price performance was in much contrast to July, during which XRP had recorded lofty gains following Ripple’s partial victory over the United States Securities and Exchange Commission (SEC).
Why Is The XRP Price Struggling?
To explain the contrast between XRP’s negative price performance and its surging trade volume, Kaiko has provided some interesting, in-depth analysis.
According to the research firm, the court ruling in July led to a large demand for XRP by US traders, as was seen in the token’s price movement. Kaiko noted that the XRP average trade size on Coinbase, the largest US crypto exchange, experienced a significant boost, surpassing all top ten altcoins.
However, this massive XRP demand was only present in the US. Kaiko states there was high selling pressure on foreign exchanges, indicating that most investors sold off their tokens to capitalize on XRP’s gains from its court victory.
In particular, Kaiko reported that the South Korean exchanges Upbit and OKX recorded the strongest XRP selling pressure for August.
Kaiko notes that the XRP’s trading volume is higher on foreign markets than on US exchanges. The research firm reported:
Overall, the share of XRP traded on U.S. markets remains lower than on offshore exchanges. XRP is only the sixth most traded altcoin in the U.S. by cumulative trade volume, while it tops the list on offshore markets.
Therefore, the high demand for XRP in the US was overwhelmed by higher selling pressure on the global market, which explains why the XRP market price took a nosedive in August.
At the time of writing, XRP trades at $0.503, having gone up by 0.17% in the last day based on data from CoinMarketCap. However, the fifth-largest cryptocurrency is still in the red zone and is down by 2.28% and 19.70% on the weekly and monthly charts.
Nifty News: Trader nabs 800 ETH by baiting a bot, NFT thefts slow and more

A trader walked off nearly $1.5 million richer after tricking a bot copying his trades to buy a slew of NFTs at a markup.
First Mover Asia: Bitcoin Teases $30K While the Long Wait for an ETF Continues
Trading volume is down, but all signs point to a break-out around the corner.
South Korean Exchange Upbit Surpasses Coinbase, OKX in July Trading Volume to Take No. 2 Spot for First Time
The exchange bucked the general market trend that saw a decline in trading volume for most centralized exchanges.
July Was a Terrible, No Good, Very Bad Month For NFTs, DappRadar Report Shows
NFT trading volume declined 29% and the number of sales dropped 23% from June, while Yuga Labs collections’ dominance slipped.
NFT Trading Volume Is Sinking, But It’s Not Stopping Developers From Entering Web3
According to Alchemy’s Q2 Web3 Development Report, while NFT trading volume fell 41%, almost six million smart contracts were deployed across chains including Ethereum and Polygon.
XRP Trading Volume Surges 1,351% as Major Crypto Exchanges Embrace the Token
The spike in trading activity came after a partial win in a lawsuit against the SEC.
Bitcoin Ordinals volume hits $210M in Q2 – DappRadar

The advent of Bitcoin Ordinals NFT inscriptions led to more $210 million in trading volume through the first half of 2023.
Crypto Trading Volumes Rise for First Time in 3 Months Amid ETF Optimism
Even so, spot trading volumes are at historically low levels.
Robinhood Sheds Jobs for Third Time Since April 2022: WSJ
Trading platform Robinhood (HOOD) has cut 7% of its full-time staff, about 150 employees, in the third round of layoffs since April 2022.


