David Chaum Rolls Out Privacy-Protecting CBDC Technology

Cryptocurrency Financial News

Member of Parliament Lisa Cameron’s cross-party group for digital assets is working to ensure crypto regulations remain apolitical amid all the changes in leadership.


On Nov. 9, the GBTC closed at a record discount of 41% with a one-share price standing at $8.76.


Miners face an impossible situation if prices stay this low, which could result in a sell-off accompanied by a BTC price macro low.

Justin Sun offered a “way forward” for embattled exchange FTX earlier.

FTX founder Sam Bankman-Fried transferred at least $4 billion in FTX funds.

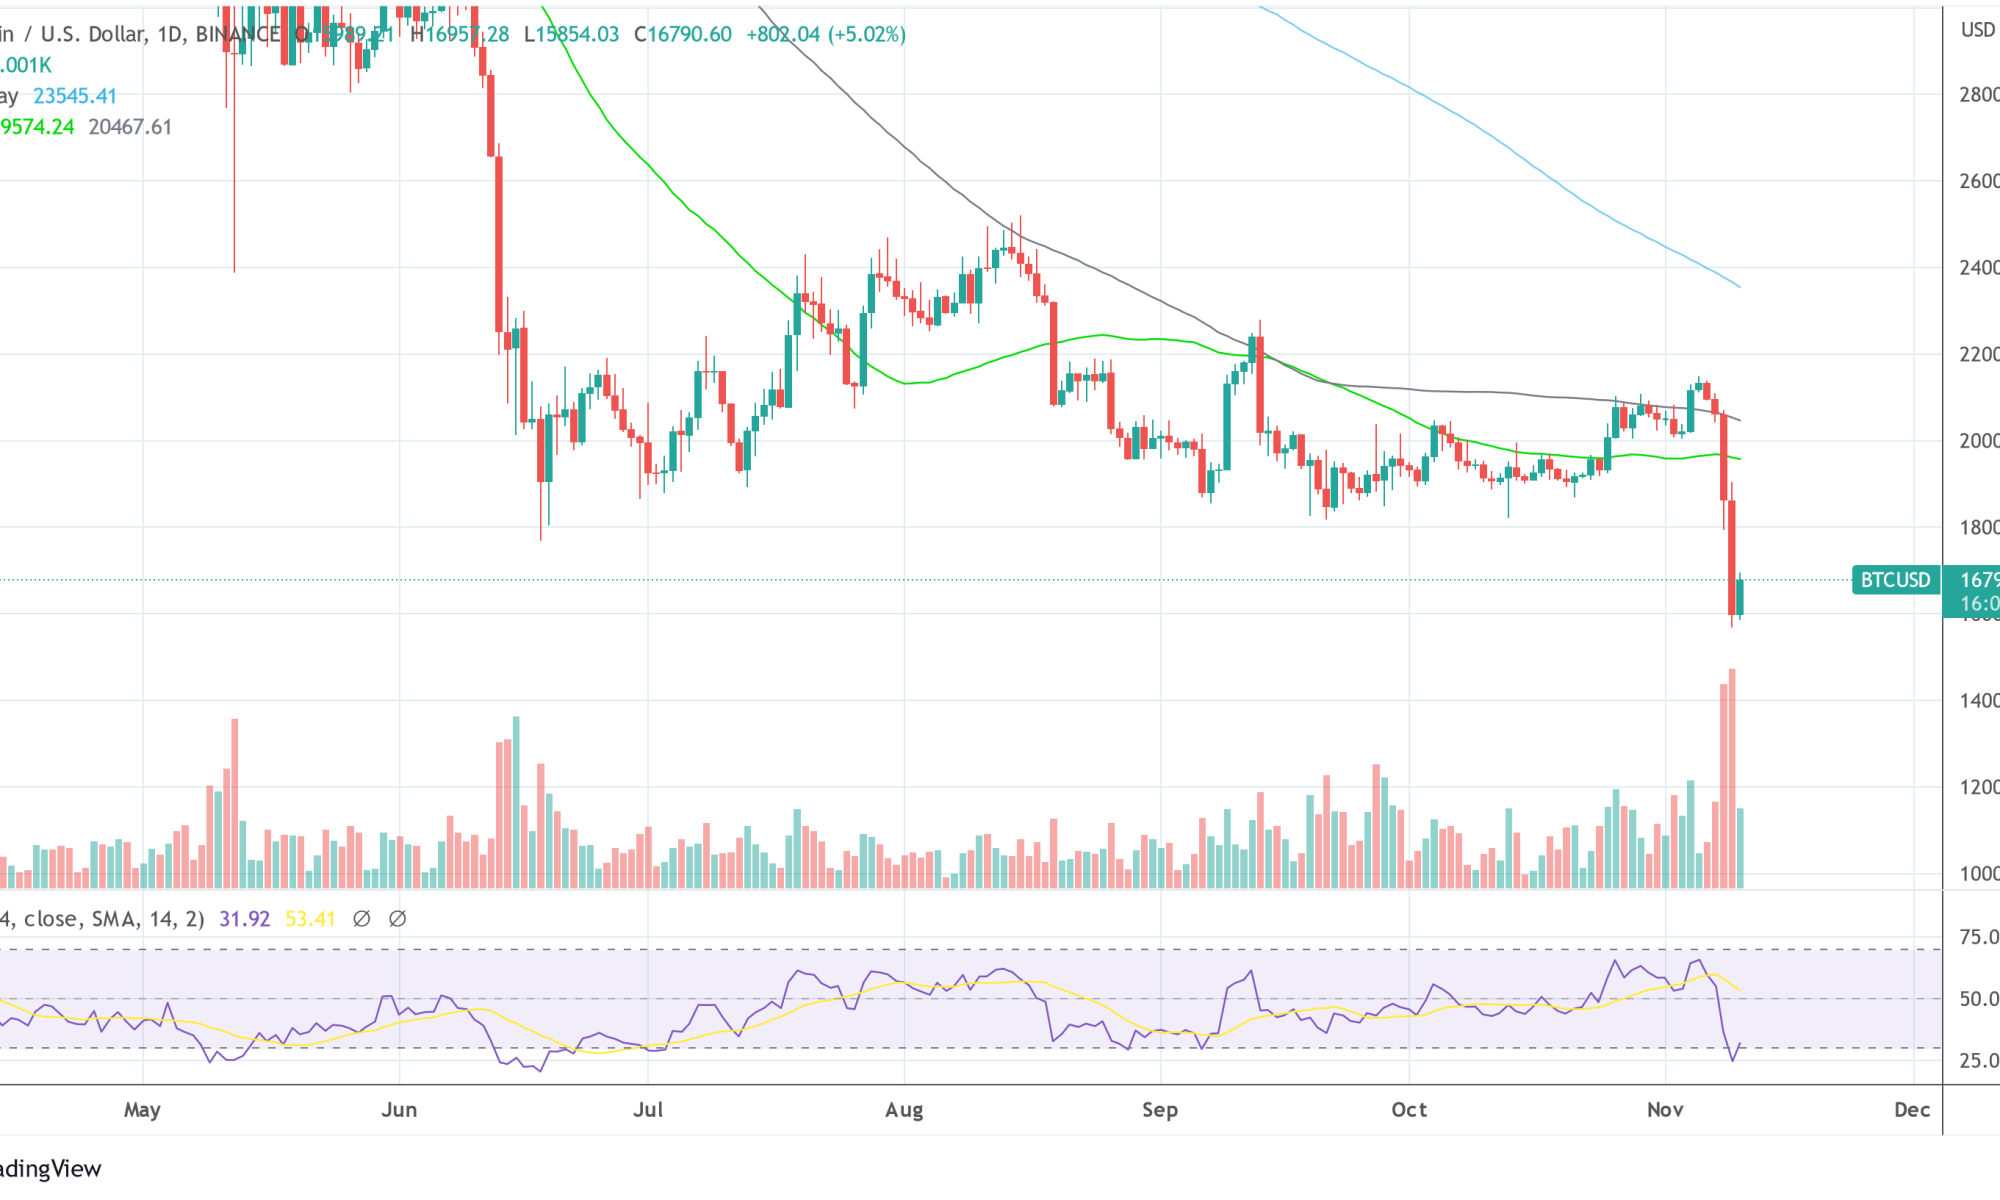
In the last two days, the crypto market has been erratic, with the price of many altcoins, including Bitcoin (BTC), battling for survival after the news came out that Binance would not be taking over FTX after conducting due diligence. Previous weeks saw the price of Bitcoin (BTC) perform well, rallying from a low of $19,200 to a high of $21,800. Most altcoins trend higher as many produced gains of over 200%, including DOGE rallying from a region of $0.55 to a high of $0.15, with many hoping for more recovery bounce. Still, these expectations were cut short by the uncertainty surrounding the crypto market. (Data from Binance)
The previous week saw many altcoins produced over 200% gains over the past 7 days of breaking out of their range-bound movement, as many believe more hope is returning to the crypto space.
The new week has yet to look like the previous as the week has looked choked with FUD (Fear of uncertainty and doubt), leading to many altcoins being affected negatively in price as major coins have been struggling to stay afloat from what looks like a crypto purge.
The news of Binance rescuing the situation by taking over FTX was good. Still, after conducting their due diligence, Binance decided it would not take over FTX as this has affected the market negatively, sending the price of BTC on a spiral movement to $15,700 after losing its all-time support of 2017 at $18,500.
The price of BTC has continued to look bearish after breaking below its all-time high support, which has served as support as a good demand zone for major plays holding off sell-offs. According to speculations, there are more chances of the price revisiting $14,000.
Weekly resistance for the price of BTC – $17,500.
Weekly support for the price of BTC – $15,500.

The price of BTC remains considerably weak in the daily timeframe as the price trades above $15,500 support after bouncing off that region to a high of $16,600, holding off the price from trending lower.
If the price of BTC breaks below the temporary support formed at $15,500, we could see the price of BTC trading to a region of $14,000.
Daily resistance for the BTC price – $17,000.
Daily support for the BTC price – $14,000.
Featured Image From zipmex, Charts From Tradingview
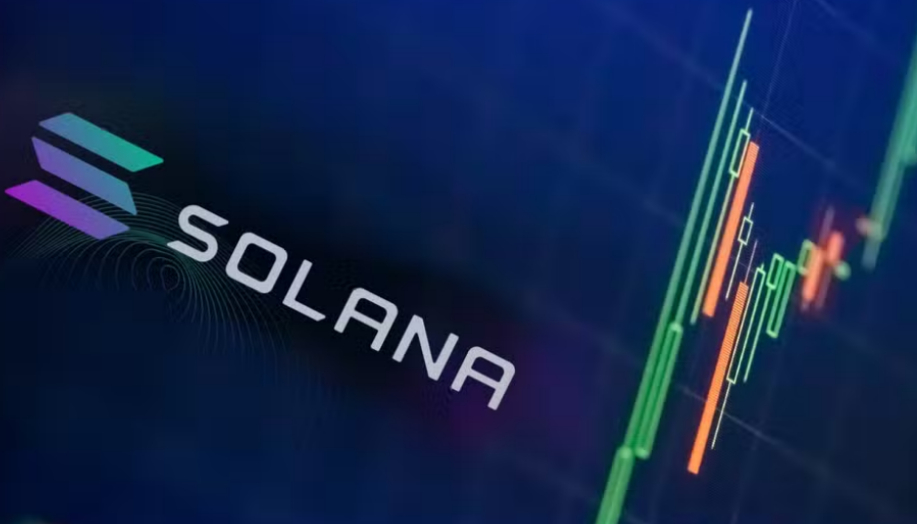
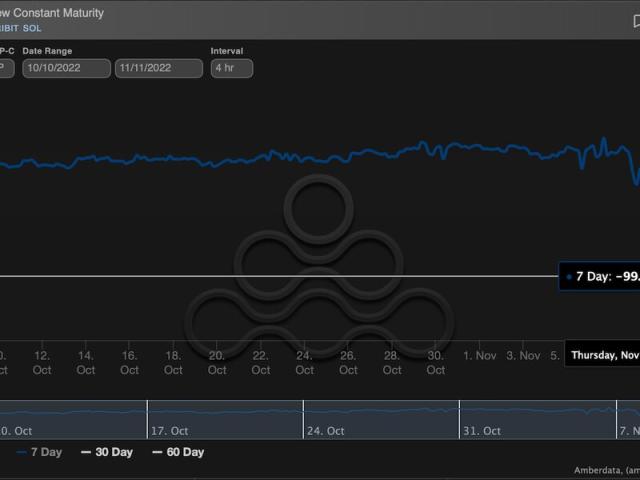
Solana (SOL) has been one of the tokens hit by the FTX decline in the last few days. Given FTX’s exposure to the token and the fact that they hold a sizable position, it has suffered a massive decline in tandem with the FTT token. The token has already lost more than 50% of its value since the weekend. However, the bloodbath may not be over for SOL holders as some developments come to light.
Even with the market already being oversaturated with sell-offs, there is more SOL scheduled to be put into circulation. Previously the Solana Epoch 370 was scheduled to release about 90 million SOL into the market before the team intervened, but there is still a sizable amount of tokens left to be unlocked.
In less than 10 minutes from now, Epoch 370 shows a deactivating stake of around 30 million SOL to be unlocked. Once this happens, it will flood the market with tens of millions of tokens into a space with already diminished demand.

30 million SOL set to be unlocked | Source: Solana Compass
Now, previously, the whales whose token unlocks have happened would re-stake some or all of the tokens, but that was when the price of SOL was still high and the market remained strong. With so many shorting the market and SOL prices expected to fall lower, it is likely that the owner of these tokens would sell their tokens instead of staking them once more.
The impact of this unlock could be catastrophic for the price of the digital asset. Think single-digit SOL prices for the first time in more than a year. The bears will likely continue to hold the market hostage, dragging the price of SOL and others down with it.
SOL price falls to $16 | Source: SOLUSD on TradingView.com
Solana has already been kicked out of the top 10 largest cryptocurrencies by market cap since it began its decline. The token now sits at the 13th spot with a market cap of $5.5 billion. If these tokens being unlocked find their way to the open market, it could be another red day for the digital asset.
SOL price is down 24% in the last 24 hours and 10% in the last hour. On a 7-day period, its price is already down 55% to be trading at $14.11 at the time of this writing, according to data from Coinmarketcap.
Featured image from Crypto News, chart from TradingView.com
Follow Best Owie on Twitter for market insights, updates, and the occasional funny tweet…
Amidst the drama surrounding the busted deal between FTX and Binance, banking giant JP Morgan has commented on the current state of Bitcoin and the broader crypto market. If FTX does file for bankruptcy, the contagion could be massive.
As Bitcoinist reported today, FTX CEO Sam Bankman-Fried confirmed in a call with his investors shortly before Binance dismissed his bailout that the hole in the balance sheet is $8 billion.
An anonymous source leaked that the troubled exchange is seeking bailout funding in the form of debt, equity or a combination of both. With Singaporean state-owned Temasak and TRON founder Justin Sun, there are currently at least two small sparks of hope.
The looming insolvency of FTX continues to weigh heavily on the Bitcoin price at the moment. At press time, Bitcoin was trading at $17,767, down 9% over the last 24 hours and down 19% over the last seven days.
Exactly one year ago, on November 10, 2021, BTC reached its previous all-time high of $69,045.00, which represents a price drop of around 75% at the current rate.

However, according to the latest report from JP Morgan, it could go even lower as the market faces a “cascade of margin calls.” According to JPMorgan strategists led by Nikolaos Panigirtzoglou, the Bitcoin price could fall as low as $13,000.
Moreover, the analysts warn in the report that the cascade effect could be amplified due to the current conditions of the market:
What makes this new phase of crypto deleveraging induced by the apparent collapse of Alameda Research and FTX more problematic is that the number of entities with stronger balance sheets able to rescue those with low capital and high leverage is shrinking” in the crypto sphere.
According to JP Morgan, a renewed miner capitulation deems a major risk factor. In particular, the U.S. banking giant believes Bitcoin could fall below its production cost, currently averaging around $15,000.
At the moment, this production cost stands at $15,000, but it is likely to revisit the $13,000 low seen over the summer months.
As a result, more miners like Core Scientific recently may be forced to sell their Bitcoin holdings, putting additional selling pressure on the market.
Riot Blockchain, one of the largest publicly traded Bitcoin miners, recently released its latest quarterly report, revealing the state of its finances and operations.
As Jaran Mellerud of Hashrate Index discussed, nothing is more important in a bear market than a healthy balance sheet. Riot has a solid balance sheet with minimal debt, which is reflected in their low debt-to-equity ratio. The majority of the top 10 listed Bitcoin miners boast similarly good or even better numbers.
Nothing is more important in a bear market than having a healthy balance sheet.
Riot has a solid balance sheet with minimal amounts of debt. pic.twitter.com/viWEVUErbP
— Jaran Mellerud (@JMellerud) November 9, 2022
However, with Hive, Spere 3D, DMG and CryptoStar, there are also four miners that have higher debt-to-equity ratios.

The bankrupt lender filed the motion so that it has more time to submit its reorganization plan.


The NFT marketplace has clarified its stance on creator royalties after receiving significant public backlash from an earlier post.

The NFT marketplace has clarified its stance on creator royalties after receiving significant public backlash from an earlier post.
The CEOs of Coinbase, Ripple and Circle called for clearer policy framework in a tweet thread started by Senator Elizabeth Warren.
Bitcoin is down nearly 10% to $16,622 as FTX’s liquidity crisis continues to rattle the markets.


The venture capital firm assured partners it ran a rigorous due diligence assessment when it invested in FTX, finding the exchange to generate $1 billion in revenue and $250 million in operating income.

XRP price started a major decline from the $0.50 resistance against the US Dollar. The recent collapse of FTX and FTT sparked a sharp move towards the $0.32 support.
In the past 3-4 days, the crypto market saw a major decline. Bitcoin, ethereum, ftt, bnb, and sol saw a substantial decline. Ripple’s XRP price also faced the heat and declined heavily from the $0.50 resistance zone.
There was a clear move below the $0.450 and $0.40 support levels. Besides, there was a break below a major contracting triangle with support at $0.455 on the daily chart of the XRP/USD pair. The pair dropped below the $0.350 support and tested a crucial support at $0.320.
A low is formed near the $0.320 level and the price is now consolidating losses. XRP is now trading well below $0.4000 and the 100-day simple moving average.
An immediate resistance is near the $0.3650 level. It is close to the 23.6% Fib retracement level of the downward move from the $0.5099 swing high to $0.3200 low. The first major resistance is seen near the $0.380 level, above which the price might recover towards the $0.415 level and the 100-day simple moving average.
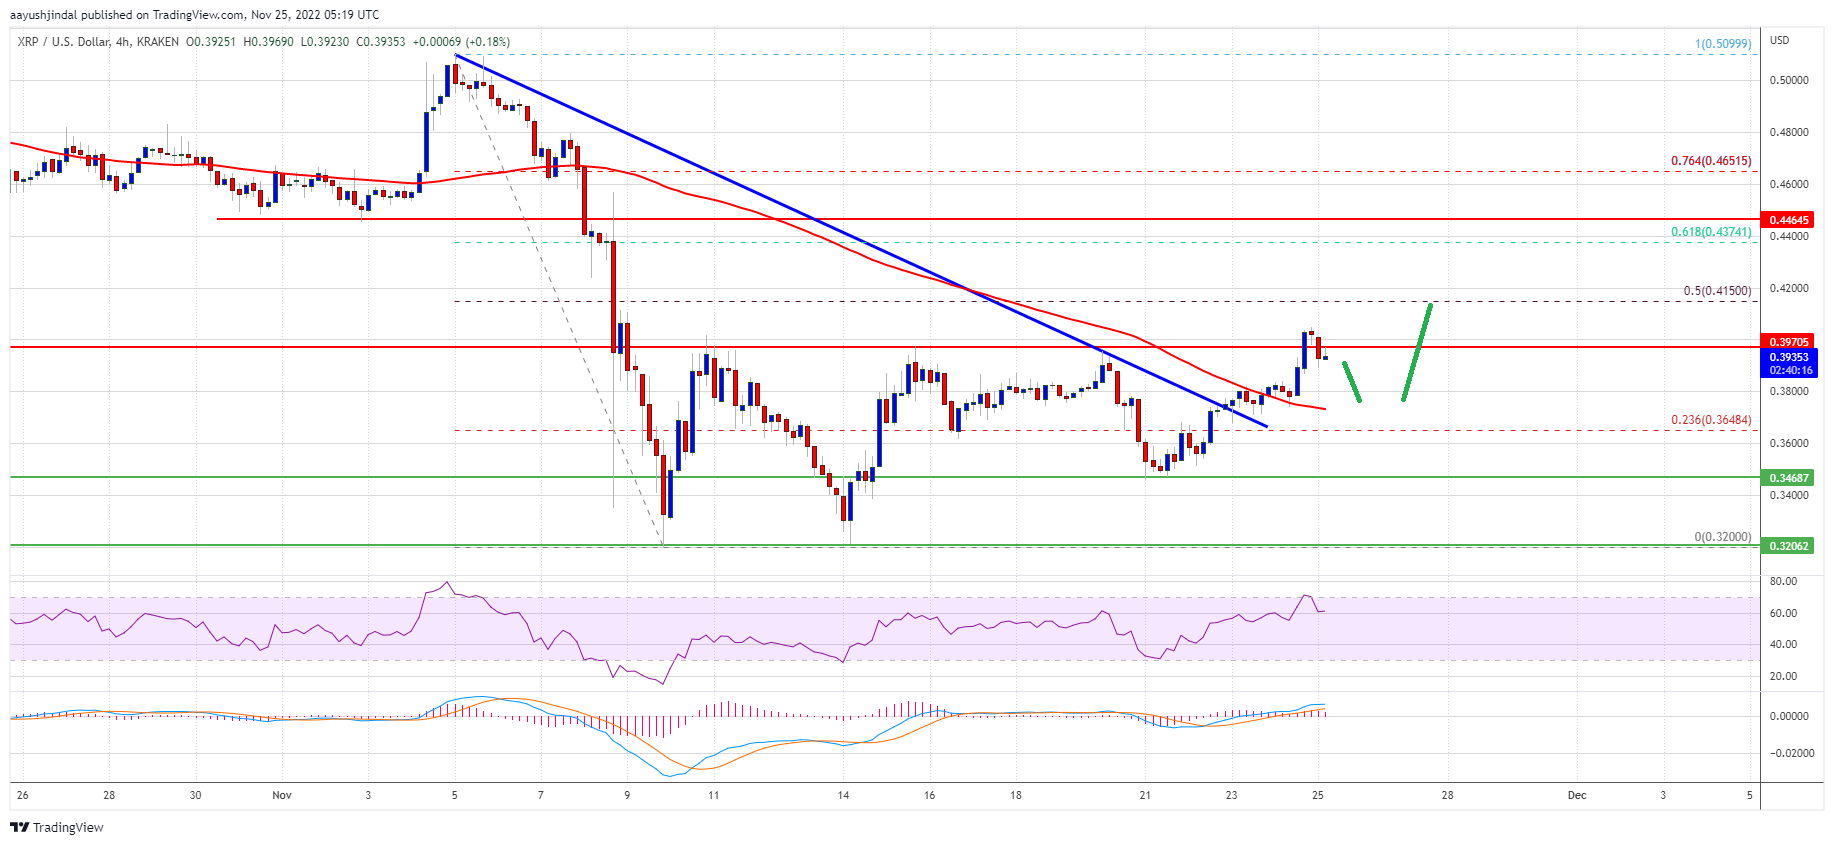
Source: XRPUSD on TradingView.com
The 50% Fib retracement level of the downward move from the $0.5099 swing high to $0.3200 low is also near $0.415. A clear break above the $0.415 resistance could open the doors for a sharp increase towards the $0.5000 resistance. The next major resistance above the $0.5000 level could be near the $0.5200 level.
If ripple fails to clear the $0.380 resistance, it could start a fresh decline. An initial support on the downside is near the $0.3400 level.
The main support could be near the $0.3200 level or the $0.3000 zone. If the price fails to stay above $0.3000, it could start another major decline.
Technical Indicators
Daily MACD – The MACD for XRP/USD is now losing momentum in the bearish zone.
Daily RSI (Relative Strength Index) – The RSI for XRP/USD is now below the 50 level.
Major Support Levels – $0.3400, $0.3200 and $0.3000.
Major Resistance Levels – $0.3650, $0.3800 and $0.4150.
An incoming supply deluge seems to have spooked investors in both the spot and derivatives markets.


Twitter’s new owner says they’ll be throwing a heap of new ideas at the platform over the coming months.

Ethereum extended losses below the $1,200 support against the US Dollar. ETH is consolidating and might even test the $1,000 support zone in the near term.
Ethereum remained in a bearish zone after it settled below the $1,500 level. ETH broke many important support zones near $1,300 to move further into a negative zone.
The price gained pace below the $1,300 and $1,250 support levels. It even settled below the $1,200 level and the 100 hourly simple moving average. Ether price traded as low as $1,070 and recently started an upside correction, similar to bitcoin.
There was a minor increase above the $1,120 resistance level. The price is now trading above $1,150 and facing many hurdles. An immediate resistance on the upside is near the $1,190 level. There is also a major bearish trend line forming with resistance near $1,200 on the hourly chart of ETH/USD.
The trend line resistance is near the 23.6% Fib retracement level of the recent drop from the $1,580 swing high to $1,070 low. The next major resistance is near the $1,240 level. A clear break above the $1,240 resistance could set the pace for a decent increase.
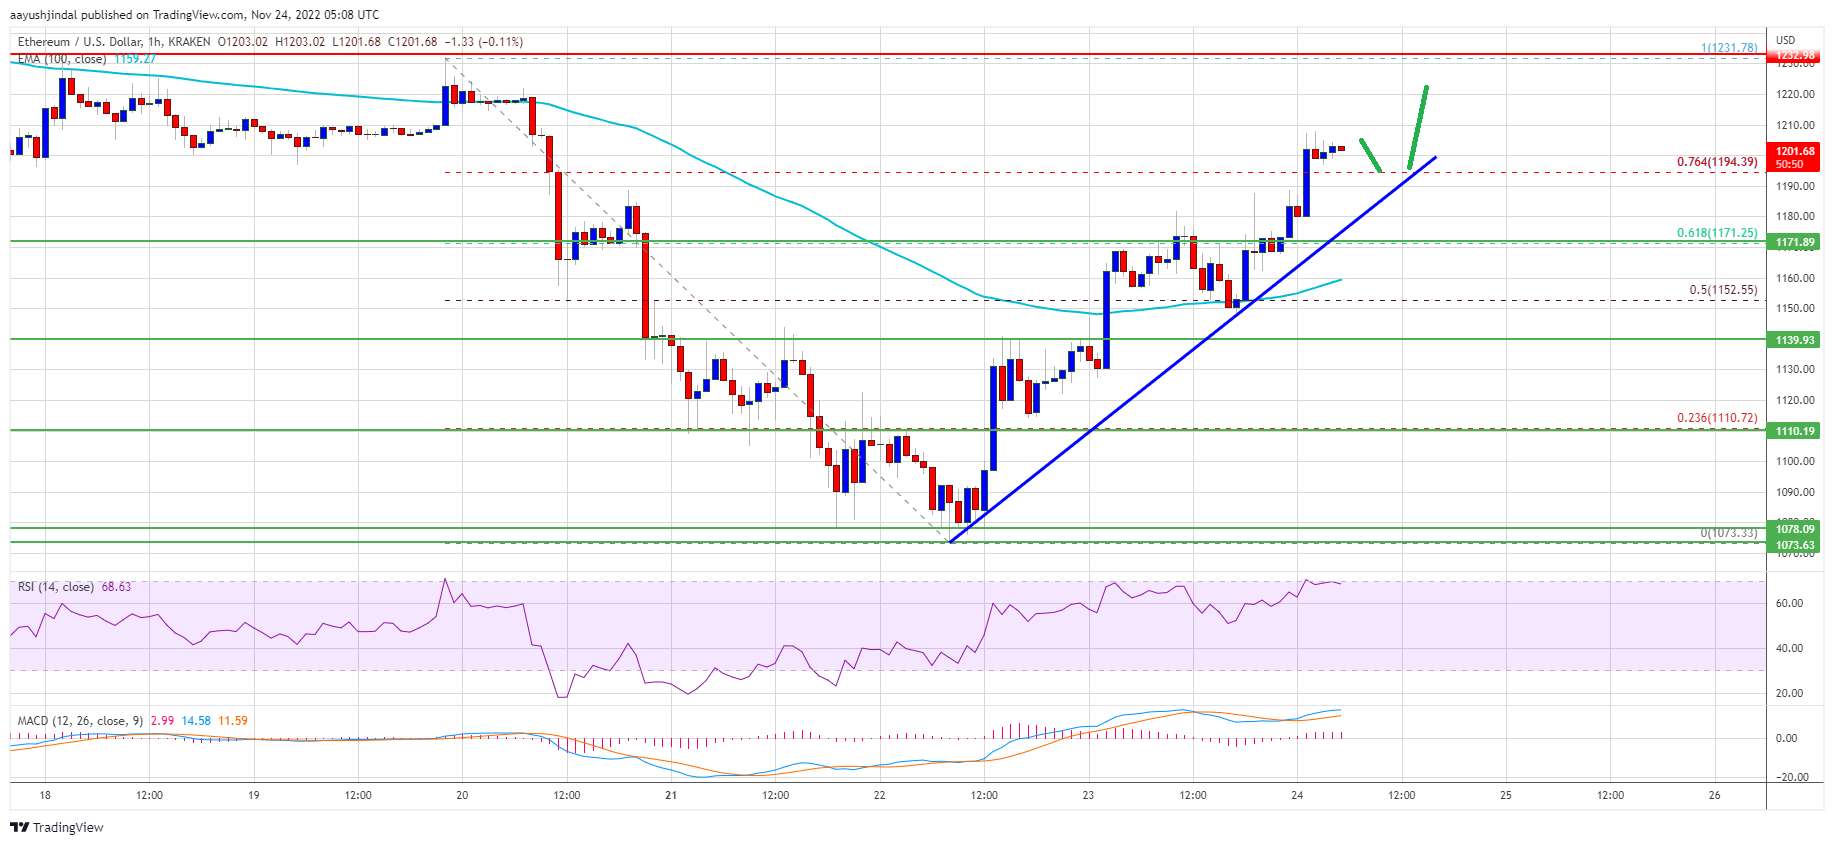
Source: ETHUSD on TradingView.com
In the stated case, the price could rise to the $1,320 level. It is near the 50% Fib retracement level of the recent drop from the $1,580 swing high to $1,070 low. Any more gains might send the price toward the $1,400 resistance zone.
If ethereum fails to climb above the $1,240 resistance, it could continue to move down. An initial support on the downside is near the $1,120 level.
The next major support is near the $1,070 level, below which ether price may perhaps extend losses. In the stated scenario, the price could decline towards the $1,000 support zone in the near term.
Technical Indicators
Hourly MACD – The MACD for ETH/USD is now losing momentum in the bearish zone.
Hourly RSI – The RSI for ETH/USD is now below the 50 level.
Major Support Level – $1,120
Major Resistance Level – $1,240

“We share the belief that it should be necessary for crypto platforms to publicly share proof of reserves,” the Crypto.com CEO said.


