
Officials from Ukraine were trained in tracing crypto transactions over different blockchains using specialized analytics software.
Cryptocurrency Financial News
Officials from Ukraine were trained in tracing crypto transactions over different blockchains using specialized analytics software.

With more than a month left before the end of 2023, the United States crypto industry has already spent $20 million on lobbying efforts.
Wall Street financial expert Linda Jones recently offered a detailed forecast regarding the potential Initial Public Offering (IPO) of Ripple. Speaking at a Fireside chat with Linqto, a pre-IPO investment platform, Jones outlined her insights into the expected timeline and factors influencing Ripple’s decision to go public.
Jones stated via X, “Here is my interview with Linqto today. We talked about when Ripple might go public, my back of the envelope calculation for what the stock might be worth and potential acquisition targets.”
Despite Ripple’s apparent lack of immediate need for IPO-related funds, Jones suggested that investor pressure might compel the company’s executives towards this path. She elaborated, “Well like I said, Ripple was founded in 2012, and I think their investors want the exit and Brad [Garlinghouse] will get pressure to do that even though they don’t need the money from the IPO.”
Her forecast hinges on a broader economic outlook, predicting a bull market spurred by decreasing inflation and interest rates, thereby creating a conducive environment for public offerings. “I do think we will go into this incredible bull market that will happen from the drop of inflation and interest rates that will lead to a very strong rise in stocks that will allow the IPO market to get very hot next year,” Jones added.
Jones pinpointed mid-May 2024, specifically around May 15, as the ideal window for Ripple’s IPO, contingent on favorable market conditions and company readiness. “I think there is an opportunity if Ripple wants to go public next year that mid-May would be an ideal time, right around May 15 would be an ideal time – that’s my first target that they might go public if everything – the stars, the Sun, and the Moon – lined up, and they wanted to go public,” she explained.
However, she also cautioned about the uncertainty of this timeline, indicating that if Ripple misses this window, the next viable opportunity might not arise until 2025. “If it doesn’t happen, then I think it probably won’t happen until 2025,” Jones remarked.
Further complicating Ripple’s path to an IPO is the ongoing legal conflict with the US Securities and Exchange Commission (SEC). Ripple CEO Brad Garlinghouse has acknowledged this challenge, noting that SEC approval for Ripple’s Form S-1 Registration Statement is necessary for an IPO. As long as the legal battle persists, this approval remains uncertain.
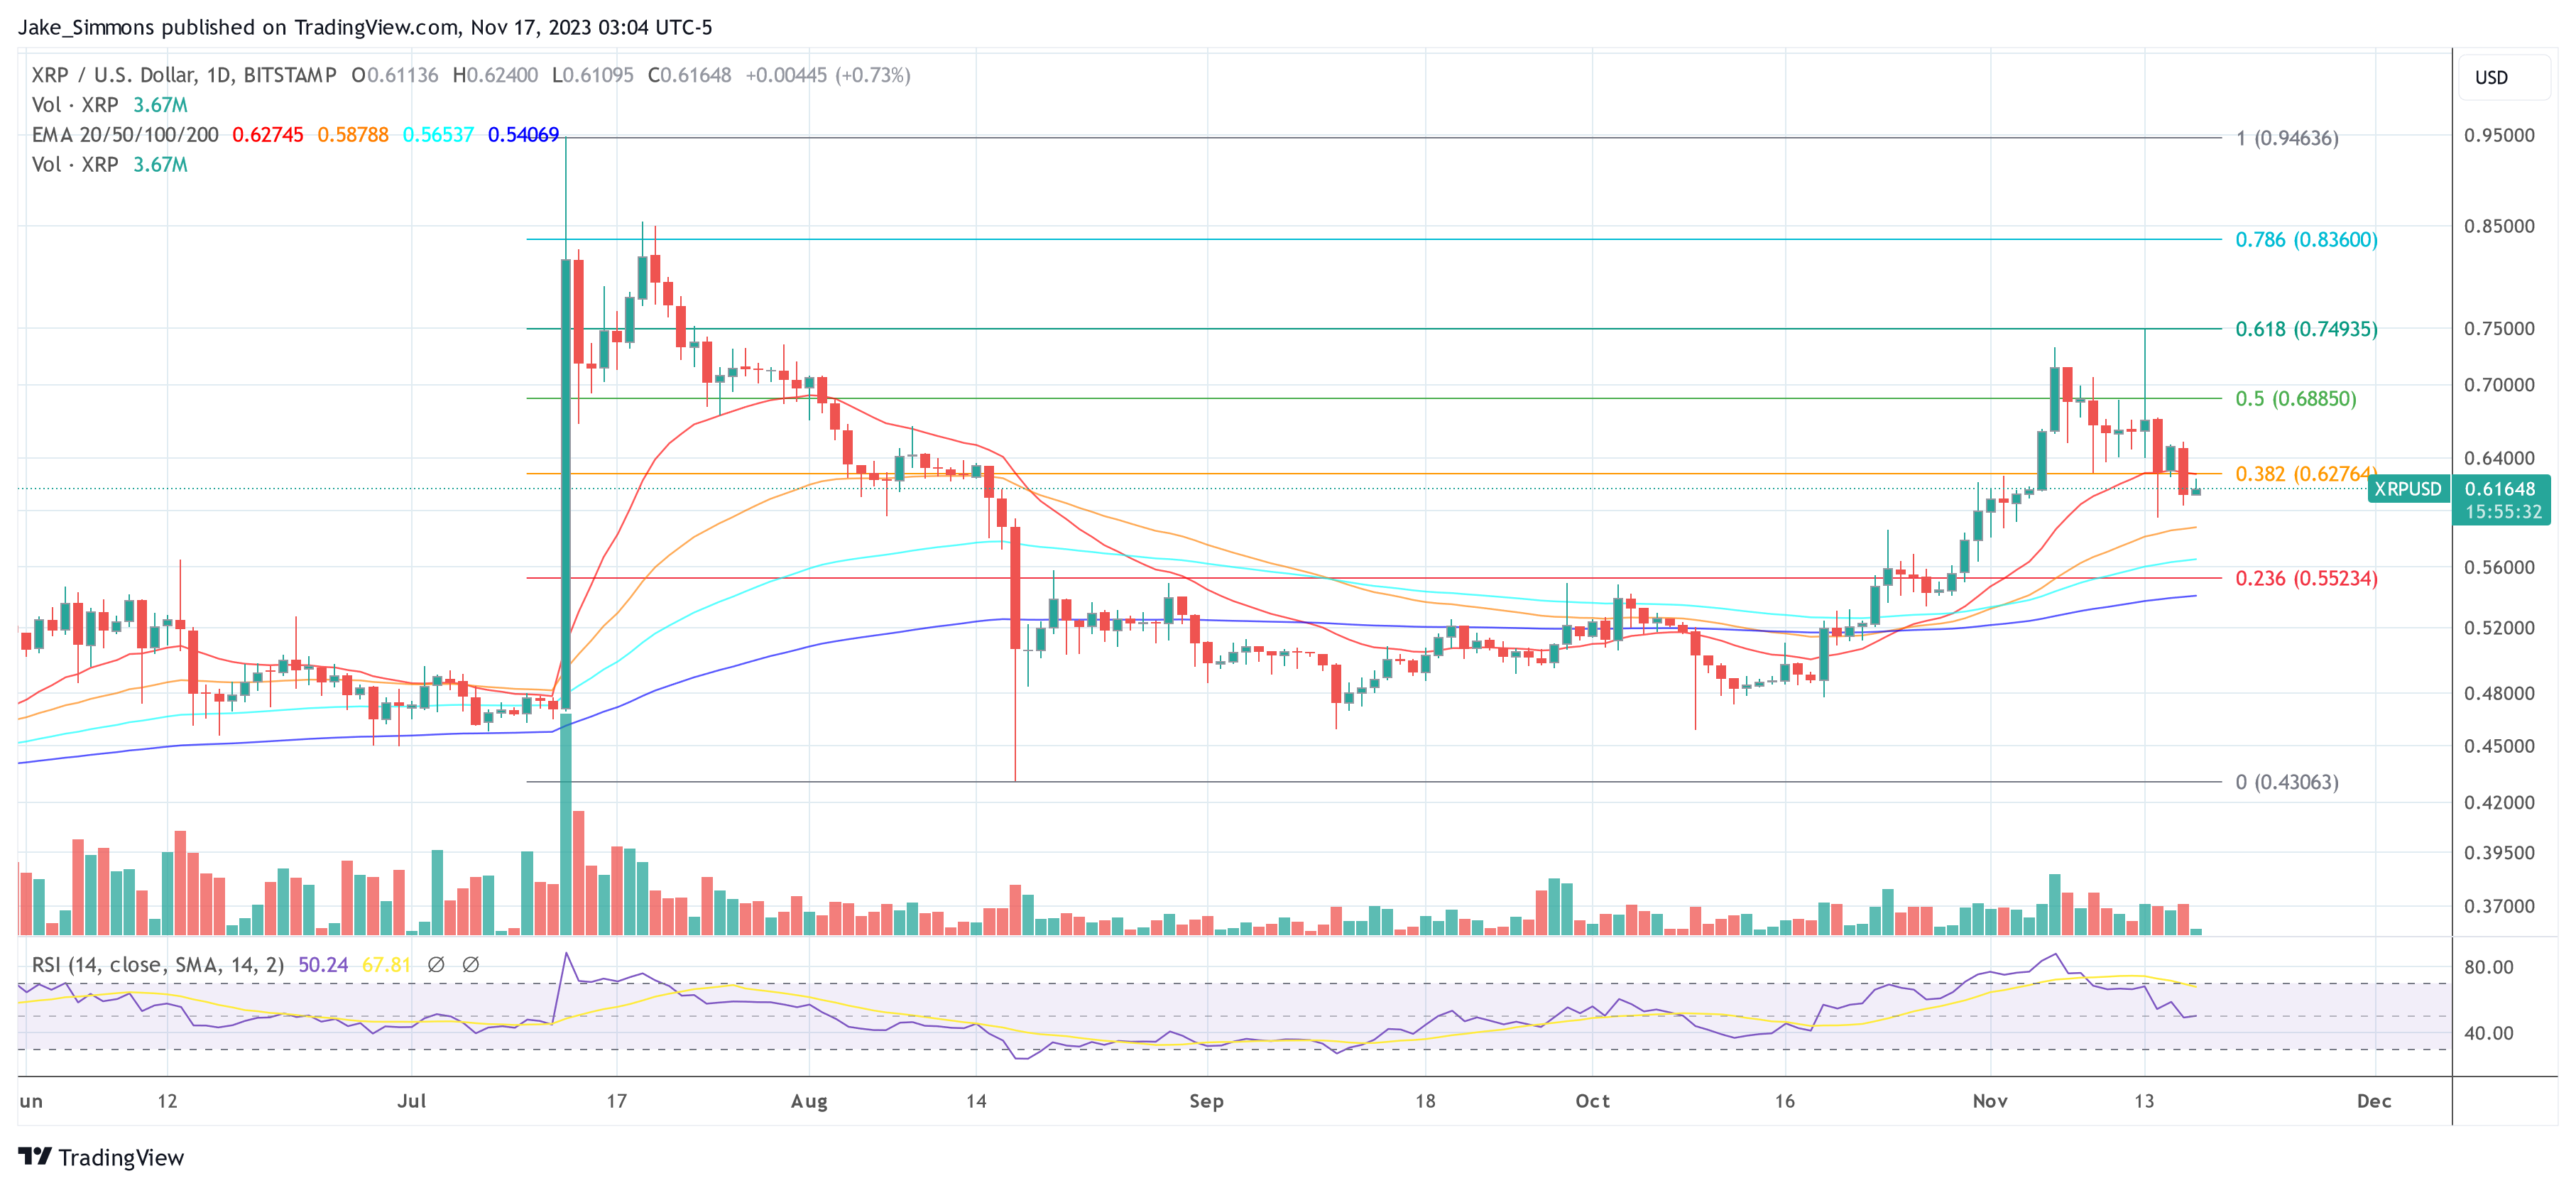
At press time, the XRP price traded at $0.6165 after dropping below the 0.382 Fibonacci retracement level.
The recommendations are meant to help establish a global regulatory response to the risks posed by crypto asset service providers.

The Canadian agency also noted privacy violations, social manipulation and bias among the concerns that AI raises.

Decentralized exchange Sushi will test native Bitcoin DeFi functionality that promises to allow users to swap BTC across 30 blockchain networks.
AVAX price rallied over 50% and climbed above $22.50. The price might correct lower but there could be more upsides above $25.
After forming a base above the $10.00 level, Avalanche’s AVAX started a major rally, outperforming Bitcoin and Ethereum. There was a clear move above the $15 and $20 resistance levels.
The price gained over 50% in the past few days and even cleared the $22.50 resistance. A new multi-week high was formed near $24.70 and the price is now consolidating gains. There was a minor decline below the $22.50 level.
The price declined below the 23.6% Fib retracement level of the upward move from the $15.59 swing low to the $24.70 high. However, the bulls were active above $20.00.
AVAX price is now trading above $22.00 and the 100 simple moving average (4 hours). There is also a key bullish trend line forming with support near $20.50 on the 4-hour chart of the AVAX/USD pair. On the upside, an immediate resistance is near the $24.50 zone.
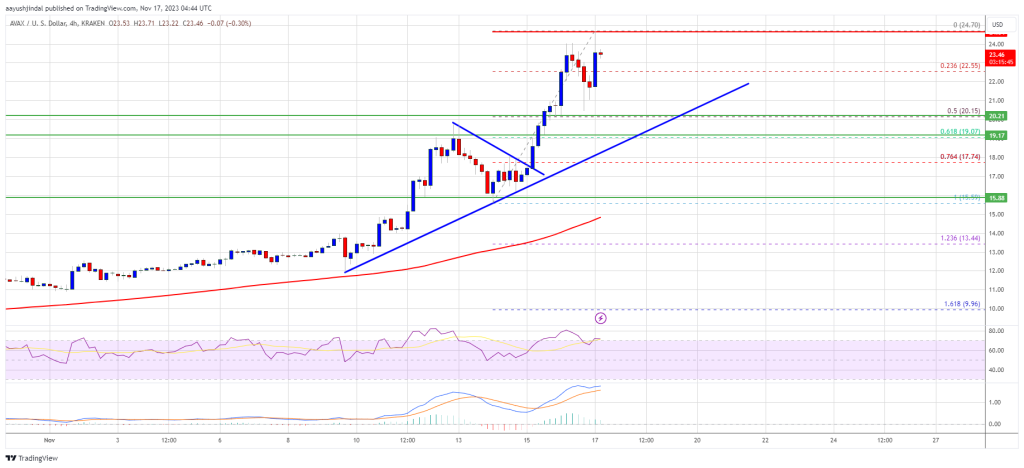
Source: AVAXUSD on TradingView.com
The next major resistance is forming near the $25.00 zone. If there is an upside break above the $24.50 and $25.00 levels, the price could surge over 20%. In the stated case, the price could rise steadily towards the $30 level.
If AVAX price fails to continue higher above the $24.50 or $25.00 levels, it could start a downside correction. Immediate support on the downside is near the $22.50 level.
The main support is near the $20.50 zone. A downside break below the $20.50 level could open the doors for a fresh decline towards $18. The next major support is near the $15.50 level.
Technical Indicators
4 hours MACD – The MACD for AVAX/USD is gaining momentum in the bullish zone.
4 hours RSI (Relative Strength Index) – The RSI for AVAX/USD is now above the 50 level.
Major Support Levels – $22.50 and $20.50.
Major Resistance Levels – $24.50, $25.00, and $30.00.

The Monetary Authority of Singapore has unveiled its plan to launch a live wholesale CBDC used for settlements by local banks.
AVAX is up 8% in the last 24 hours, while bitcoin is trading below $36,500.
AVAX is up 8% in the last 24 hours, while bitcoin is trading below $36,500.
Ethereum price corrected lower and tested the $1,935 support. ETH is likely forming a double-bottom and might start a decent increase.
After facing rejection near the $2,090 zone, Ethereum price reacted to the downside. ETH traded below the $2,050 and $2,020 support level to enter a short-term bearish zone, like Bitcoin.
There was also a break below a key contracting triangle with support near $2,025 on the hourly chart of ETH/USD. However, the bulls took a stand near the $1,935 support zone. It seems like Ether is likely forming a double-bottom pattern, while Bitcoin is forming a double-top near $38,000.
Ethereum is now trading above the 23.6% Fib retracement level of the downward move from the $2,092 swing high to the $1,935 low. Immediate resistance is near the $2,000 zone.
The first major resistance is near $2,020 or the 100-hourly Simple Moving Average. It is near the 61.8% Fib retracement level of the downward move from the $2,092 swing high to the $1,935 low. A close above the $2,020 resistance could start another strong increase.
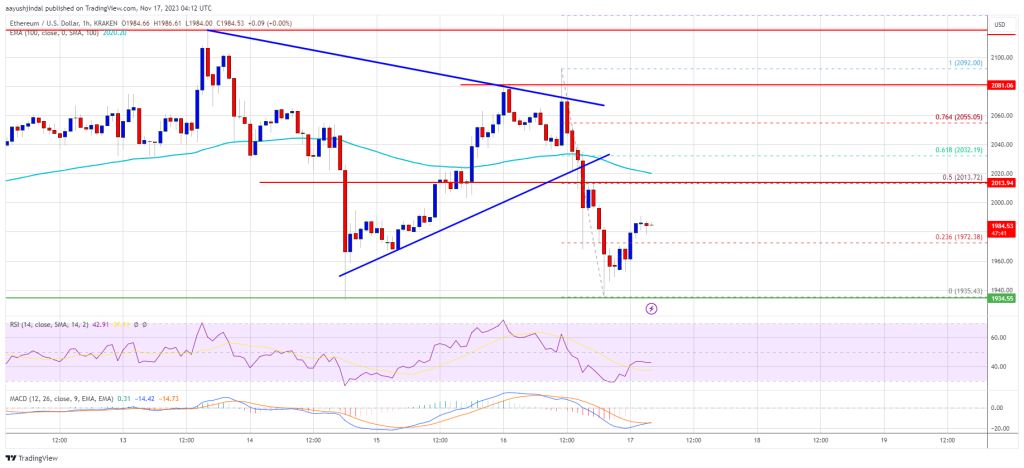
Source: ETHUSD on TradingView.com
The next resistance is near $2,090, above which the price could aim for a move toward the $2,120 level. Any more gains could start a wave toward the $2,200 level.
If Ethereum fails to clear the $2,020 resistance, it could start a fresh decline. Initial support on the downside is near the $1,950 level. The next key support is $1,935.
The main support is $1,920. A downside break below the $1,920 support might start a steady decline. In the stated case, Ether could drop toward the $1,850 support zone in the near term. Any more losses might call for a drop toward the $1,800 level.
Technical Indicators
Hourly MACD – The MACD for ETH/USD is losing momentum in the bullish zone.
Hourly RSI – The RSI for ETH/USD is now below the 50 level.
Major Support Level – $1,935
Major Resistance Level – $2,020
Bitcoin price again failed to clear the $38,000 resistance zone. BTC is likely forming a double top and might decline toward the $34,500 support.
Bitcoin price made another attempt to clear the $38,000 resistance. However, BTC failed to clear the $38,000 resistance and started a fresh decline. It seems like the price is forming a double-top pattern near the $38,000 zone.
There was a sharp move below the $37,200 and $37,000 levels. The price even spiked below the $36,500 level and the 100 hourly Simple moving average. Finally, the bulls appeared near the $35,500 level. A low was formed near $35,517 and the price is now correcting losses.
The price climbed above the 23.6% Fib retracement level of the downward move from the $37,950 swing high to the $35,517 low. Bitcoin is now trading below $36,750 and the 100 hourly Simple moving average. There is also a connecting bullish trend line forming with support near $36,250 on the hourly chart of the BTC/USD pair.
On the upside, immediate resistance is near the $36,700 level. The next key resistance could be near $37,000 or 61.8% Fib retracement level of the downward move from the $37,950 swing high to the $35,517 low.
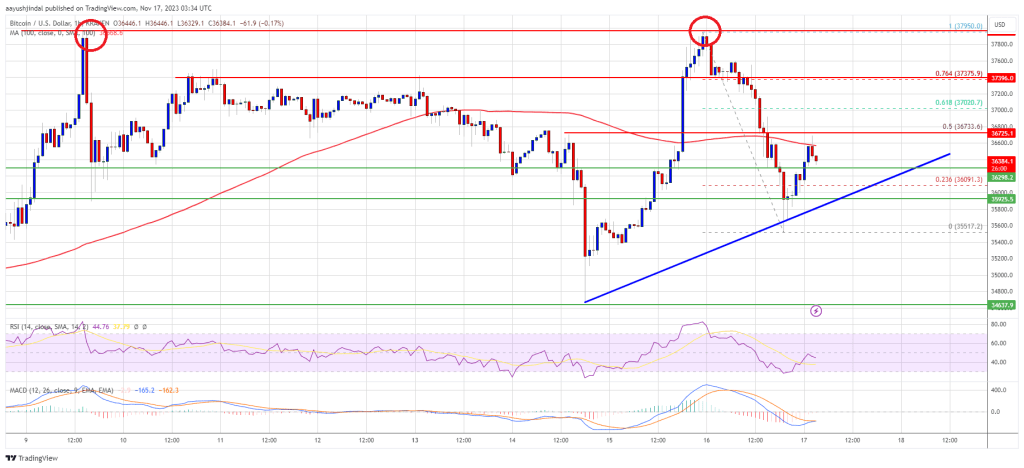
Source: BTCUSD on TradingView.com
A close above the $37,000 resistance could start a strong increase. The first major resistance is near $37,500, above which the price might accelerate further higher. In the stated case, it could test the $38,000 level. Any more gains might send BTC toward the $39,200 level.
If Bitcoin fails to rise above the $37,000 resistance zone, it could continue to move down to complete the double-top pattern. Immediate support on the downside is near the $36,200 level.
The next major support is $36,000. If there is a move below $36,000, there is a risk of more downsides. In the stated case, the price could drop toward the $35,500 support in the near term. The next key support or target could be $34,500.
Technical indicators:
Hourly MACD – The MACD is now losing pace in the bullish zone.
Hourly RSI (Relative Strength Index) – The RSI for BTC/USD is now below the 50 level.
Major Support Levels – $36,200, followed by $35,500.
Major Resistance Levels – $36,700, $37,000, and $38,000.

The deal comes as Bitcoin ETF applications in the U.S. are seemingly inching closer toward regulatory approval.

Using Web3 and NFTs to create another slate of millionaires isn’t a good use of the technology, says EndeavourXR CEO Amy Peck.
Ryan Sean Adams, a crypto investor and a vocal Ethereum supporter, notes that some ETH holders are panic selling and diversifying into layer-1 altcoins like Solana (SOL) or Cardano (ADA), primarily concerned that the coin may not outperform the market as it did in the last bull cycle when it soared to around $5,000.
In an X post on November 16, Adams said price action, despite these actions, might rapidly change even if ETH is no longer a 20-100X coin in the eyes of venture capitalists. The investor compares the current trading atmosphere to 2020, months before the second most valuable coin turned higher, surging to record levels.
Presently, Ethereum is trading below the $2,000 round number, pulling back from a recent higher but remaining within a bullish formation. Still, it appears the community is dissatisfied with this performance, especially with competitors, primarily SOL and ADA posting impressive gains.
As of writing on November 16, SOL has not only reversed losses of November 2022 when FTX filed for bankruptcy in the United States but has comfortably surged past key resistance lines, registering new 2023 highs of around $67. To quantify, SOL is up by over 200%.
At the same time, Cardano is firm, adding roughly 70% from October 2023 lows, looking at price action in the daily chart. By October, ADA had discouragingly sunk to as low as $0.25. However, the stellar recovery at the tail end of October sparked demand for the coin, driving it to present levels.
Cardano has been slugging in recent months despite the continuous ecosystem developments, including the refinement of the network’s performance during the Basho stage. Several enhancements, including pipelining, have been introduced to make the network more scalable and secure. Still, this didn’t reflect in ADA’s price action until the recent spike in October.
The difference in performance between Ethereum and competing altcoins, as price action reveals, could be due to project-related triggers but mainly the difference in market cap. Ethereum is the second most valuable project, only trailing Bitcoin, whose market cap is multiples higher than even the second largest smart contract platform by market cap, BNB Chain.
Subsequently, this makes ETH less volatile, forcing supporters, as Adam notes, to divest into other more volatile coins. These competing layer-1 altcoins have registered triple-digit gains in the last month alone. Nonetheless, even with ETH only adding 30% in the same period, Adams argues that the coin is a “fantastic asset” from a risk-adjusted basis for the average retail investor.

Gas fees on the Polygon network reached as high as $0.10 during a mad rush to mint an Ordinals-inspired token called POLS.
‘Dogecoin to the moon’ is a saying that anyone in the crypto community is familiar with. This is usually said figuratively in relation to the DOGE price actually surging. But Dogecoin is now actually headed to the moon – literally – after the official account confirmed the first DOGE space mission.
On Thursday, November 16, the official Dogecoin account on X (formerly Twitter, confirmed that a mission that will be taking the meme coin to the moon has now been confirmed. The mission is being orchestrated by Astrobotic Technology, a robotics company headquartered in Pennsylvania.
The details of the mission included in the post include the fact that a physical Dogecoin is being included in the DHL Moonbox via ULA’s Vulcan Centaur Rocket which is set to take off on December 24, 2023. The DHL Moonbox is a memento box that carries different keepsakes to take to the moon.
More info, with the physical dogecoin travelling in the “MoonBox” https://t.co/aS1zGvb0if pic.twitter.com/L7WUhg3aIj
— Dogecoin (@dogecoin) November 16, 2023
According to data from Astrobotic Technology, the DHL Moonbox headed to the moon in December has been filled with items from all around the world, including the United States, Germany, Canada, etc. Upon the completion of the mission, DOGE will be the first cryptocurrency to be sent to the moon, marking an important milestone for the meme coin.
The Dogecoin price is already in a position where it is expected to surge. But the confirmation of the Dogecoin on the moon mission has added fuel to the fire. Following the announcement, the DOGE price jumped above $0.83 for the first time in four years.
Crypto analyst Crypto Kaleo earlier shared an analysis of the Dogecoin price that puts it above $0.15. According to Kaleo, DOGE is expected to move very fast and will hit $0.09 to $0.1 first, before continuing on to the $0.15 target.
Kaleo bases his analysis on the DOGE/BTC chart where he says; “I’m just looking for a touch of HTF resistance on the BTC pair around 550 sats.” This is apparently the confirmation of the rally that the crypto analyst thinks could possibly push the price to $0.2.
Here’s my playbook for $DOGE:
Sometime in the next week or two, Dogecoin finally starts to move.
When DOGE starts moving higher, it usually moves pretty fast. I wouldn’t be surprised to see a daily from here to somewhere in the 9 – 10 cents range, chop there for a bit, then… pic.twitter.com/BN1AqSe8d2
— K A L E O (@CryptoKaleo) November 9, 2023
Dogeocoin’s daily volume is already up more than 50% in the last day alone, suggesting a higher level of interest from investors. Once sellers’ fatigue kicks in and demand rises, DOGE could clear the $0.09 level before the end of the day.
At the time of this writing, the DOGE price is sitting at $0.0804, with 7.86% gains in the last day. It is the 9th-largest cryptocurrency in the market with a market cap of $11.4 billion.
Ripple Labs has announced plans to integrate Automated Market Makers (AMMs) into the XRP ledger. The decision has left the XRP community feeling uneasy, as they ponder the potential long-term effects of AMMs on the XRP price.
Ripple, a global payments network provider has stated its intentions to incorporate AMMs into the XRP Ledger to help improve liquidity. The introduction of AMMs into the XRP Ledger is expected to further develop the Ripple ecosystem by providing enhanced trading efficiency and liquidity. The initiative also aligns with Ripple’s efforts to continue to optimize and innovate its blockchain infrastructure and network.
Although the announcement has been met with skepticism by the XRP community and the broader crypto space, Ripple has stated its desire to push forward its plans, looking at the bigger picture and potential success of AMMs in the ecosystem.
Many crypto community members have expressed their concerns about the impacts of AMMs integrated into XRPL. Some members believe that the XRP price may be affected and cause the token to become stable. Other members have welcomed the announcement with enthusiasm, anticipating the positive effects the initiative would have on the Ripple ecosystem.
An XRP community member and co-founder of Anodos Finance, Panos addressed concerns regarding the potential effect of AMMs on XRP’s price. He stated that AMMs could increase buying pressure and liquidity on XRP while also improving its efficiency and adoption.
“XRPL AMM will potentially add buying pressure on XRP as a significant number is expected to be locked on the AMM, which will also increase the liquidity of XRP and will attract even more traders and will make XRP more efficient for more use cases,” Panos stated.
Following the announcement of AMMs being introduced into the XRP Ledger, an X (formerly Twitter) influencer, Digital Perspectives PermaBull sparked a series of heated discussions in the XRP community regarding the effects of an AMM on XRP’s value.
The X influencer asked a series of controversial questions to the crypto community. One of the questions was if the introduction of AMMs and regulations established by the Bank for International Settlements (BIS) would end up transforming XRP into a stablecoin in the future.
“Are we watching XRP become a Stablecoin with the introduction of AMMs and the Prudential Treatment requirements from the BIS?” the X influencer stated.
He added, “XLS-30D passes and AMMs become an integral part of the XRPL, will it change the Characteristics of XRP and qualify as a Group 1b Asset for BIS and other Banks?”
In response to the growing concerns, XRPL advocate Panos reassured community members who had begun worrying about the potential impacts of AMMs on XRP. Panos affirmed that the fundamental characteristics of XRP would never change even with the inclusion of an AMM.
“The characteristics of XRP can NEVER change. It will always remain the native coin of the XRP Ledger, a decentralized digital asset that anyone can trade freely. XRP can never become a stablecoin for that reason, it’s technically not possible and makes no sense whatsoever,” Panos stated.

Chinese court knocks back civil lawsuit over “illegal” crypto, Hong Kong exchanges gain momentum, The Block gets $60M from Singapore firm.
The Bitcoin open interest can often be an indication of where the BTC price might be headed next depending on whether or not the metric is rising or falling. This time around, the Bitcoin open interest has risen drastically, hitting 19-month highs in the process. Using historical data, it is possible to extrapolate what this means for the crypto’s price, especially as investors remain very bullish.
In an interesting turn of events, the Bitcoin open interest has been rising quickly across various exchanges. In the last 24 hours alone, this metric rose by a cumulative 7.89% across all exchanges in the space, bringing the total open interest to 454,150 BTC worth a staggering $17.04 billion.
For now, most of the Bitcoin open interest is concentrated across the CME, Binance, and ByBit exchanges. But perhaps what is even more interesting is that these open interest levels represent a 19-month high.
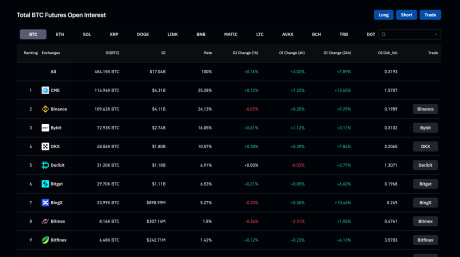
According to the data presented on the CoinGlass website, the last time that the Bitcoin open interest moved in this fashion and to this high was back in March 2022, before the historical Terra LUNA crash that sent the market into a prolonged bear market stretch.
This means that the last time that the Bitcoin open interest rose this much was during a time when investors were still very much in the throes of bull run euphoria. As such, the historical performance of the BTC price back then in relation to the open interest could serve as a guide to what might happen to the digital asset’s price next.
Similar to the current trend, the Bitcoin open interest had surged from around 38,000 BTC to over 44,000 BTC in the space of a month, and the BTC price followed quickly. This trend saw the price rise in March 2022 from $38,700 to over $47,000 before the month was over.
Going by this historical performance and assuming Bitcoin sticks to this trend, the rally may be far from over. The BTC price is also sitting at a similar price point at $37,500 and a similar surge could bring its price toward $45,000 before the month is over.
However, there is also the possibility that the open interest could peak at this level and begin to decline. Once this happens, then in the same fashion as in April 2022, the BTC price could begin to decline as the open interest drops. A similar crash would send the price back down toward $27,000.


