Vitalik Buterin called the early Ethereum scaling solution Plasma “underrated” and a “significant security upgrade” for chains that would otherwise be validiums.
Cryptocurrency Financial News
Vitalik Buterin called the early Ethereum scaling solution Plasma “underrated” and a “significant security upgrade” for chains that would otherwise be validiums.
The aim of the project was to allow wealth managers to tokenize funds and to be able to purchase and rebalance positions in tokenized assets across multiple interconnected chains.
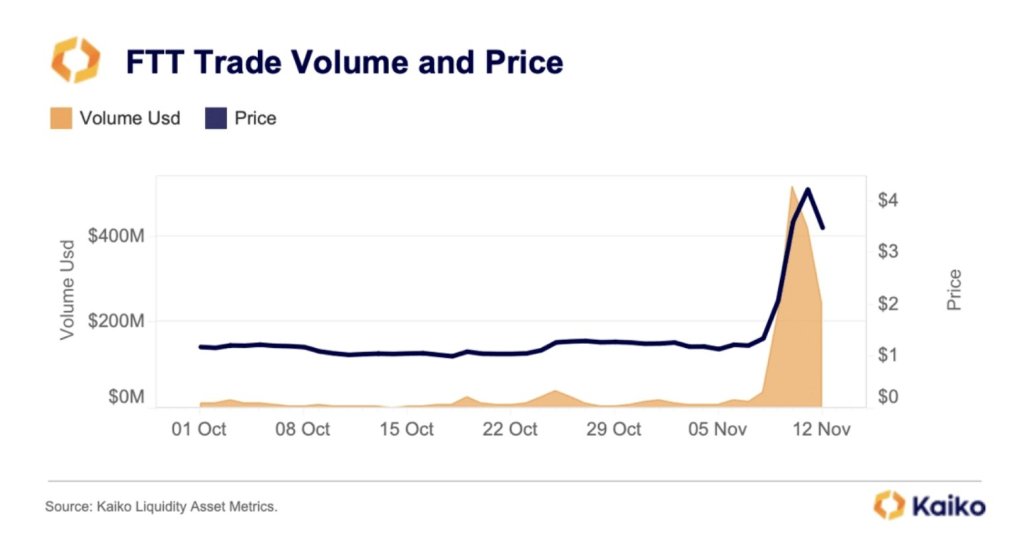
FTT, the native token of the FTX ecosystem, rallied by 180% last week, emerging as one of the top performers. The rally, Kaiko, a blockchain analytics platform observes, was primarily due to comments by the stringent United States Securities and Exchange Commission (SEC) leader that the FTX 2.0 relaunch is possible.
In an X post on November 14, Kaiko also notes that related FTT trading volume soared, signaling possible accumulation by traders and believers of FTX. At spot rates, FTT trading volume, looking at how the token performs in Binance, one of the leading cryptocurrency exchanges, remains elevated at November 2022 levels.
In November 2022, FTX, led by Sam Bankman-Fried, filed for Chapter 11 bankruptcy protection at the United States Bankruptcy Court for the District of Delaware.
Related Reading: BlackRock’s XRP ETF Filing, Everything You Need To Know
Before this bankruptcy filing, FTT, which served several purposes in the FTX ecosystem, acting as a governance token and providing access, plunged in early November following allegations that the exchange had misappropriated user funds. There was a significant collapse on November 8 when FTT fell by 90%, taking the coin from around $22 to as low as $2.
FTT is trading at around $3.22, up 232% from October 2023 lows, looking at the performance in the daily chart. As fundamental events around FTX unfold, FTT’s trading volume also rises.
There could be more gains for FTX in the days ahead should there be more solid news of an FTX 2.0 relaunch following Gary Gensler’s comments last week. Then, Gensler told CNBC that a revived FTX could see the light of day if only leaders taking over clearly understood existing laws.
The SEC chairperson’s comments follow speculations that the former New York Stock Exchange (NYSE) president, Tom Farley, is among the three bidders planning to buy FTX.
“If Tom or anybody else wanted to be in this field, I would say, ‘Do it within the law. Build investors’ trust in what you’re doing and ensure that you’re doing the proper disclosures — and also that you’re not commingling all these functions, trading against your customers. Or using their crypto assets for your purposes.”
A jury in early November found Sam Bankman-Fried, the former CEO of FTX, guilty of all criminal charges, including wiring fraud and money laundering. Bankman-Fried is set for sentencing in March 2024.
Bitcoin price declined below the $36,000 zone. BTC tested the $34,650 support zone and is currently consolidating losses near $35,500.
Bitcoin price failed to surpass the $37,500 resistance. BTC started a fresh decline from the $37,423 high and declined below many supports. There was a move below the $36,000 and $35,500 levels. The price even spiked below $35,000.
It retested the $34,650 support zone. A low was formed near $34,666 and the price is now correcting losses. There was a move above the $35,000 level. The price climbed above the 23.6% Fib retracement level of the recent drop from the $37,423 swing high to the $34,666 low.
Bitcoin is now trading below $36,500 and the 100 hourly Simple moving average. There is also a key bearish trend line forming with resistance near $36,050 on the hourly chart of the BTC/USD pair.
On the upside, immediate resistance is near the $35,680 level. The next key resistance could be near $36,000 or the trend line. The trend line is close to the 50% Fib retracement level of the recent drop from the $37,423 swing high to the $34,666 low.
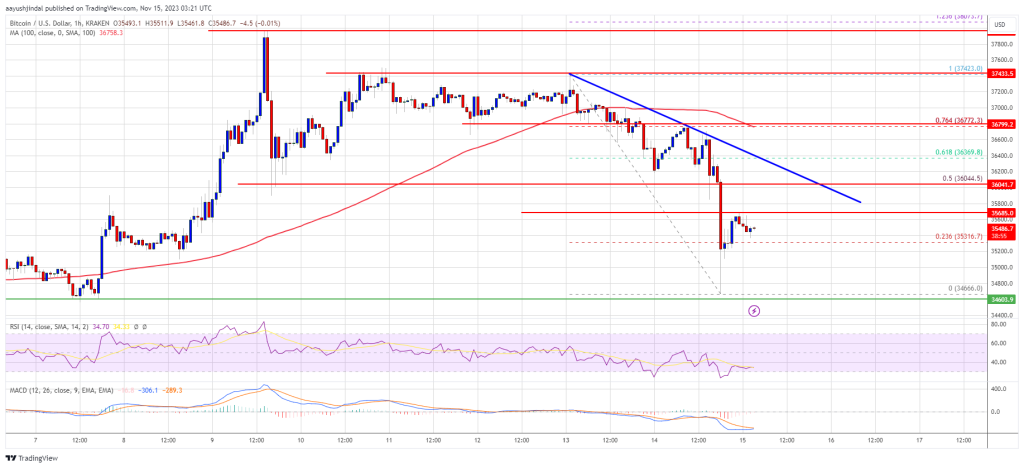
Source: BTCUSD on TradingView.com
The first major resistance is near $36,780, above which the price might accelerate further higher. In the stated case, it could test the $37,000 level. Any more gains might send BTC toward the $37,500 level, above which the price could gain bullish momentum and rally toward $38,000.
If Bitcoin fails to rise above the $36,000 resistance zone, it could continue to move down. Immediate support on the downside is near the $35,150 level.
The next major support is $35,000. If there is a move below $35,000, there is a risk of more downsides. In the stated case, the price could drop toward the key support at $34,650 in the near term.
Technical indicators:
Hourly MACD – The MACD is now losing pace in the bearish zone.
Hourly RSI (Relative Strength Index) – The RSI for BTC/USD is now below the 50 level.
Major Support Levels – $35,150, followed by $34,650.
Major Resistance Levels – $36,000, $36,780, and $37,000.

Bloomberg ETF analyst Eric Balchunas doubts the SEC will deny ETFs after XRP’s price spiked on a faked BlackRock XRP trust filing, but it is a “bad look.”
The altcoins market has recently witnessed a resurgence of interest and confidence, primarily driven by the largest cryptocurrency, Bitcoin (BTC). This renewed enthusiasm has resulted in a bull uptrend, with most of the top 100 cryptocurrencies benefiting from Bitcoin’s resurgence.
However, the market is currently experiencing a correction as Bitcoin and Ethereum (ETH) face pullbacks after failed attempts to breach upper resistance lines. Despite this correction, crypto analyst Miles Deutscher shares insights and highlights several altcoins with potentially significant gains.
Solana has exhibited remarkable growth, even as the broader market experiences a correction. With a 0.5% gain in the past 24 hours, SOL’s potential for further upside cannot be ignored.
Deutscher suggests that SOL may continue to benefit from the ongoing rotation of investments from other Layer-1 solutions like Avalanche (AVAX) and Fantom (FTM).
Thorchain (RUNE) has been on an impressive upward trajectory, prompting investors to consider buying on deep corrections and wicks. The primary decentralized exchange (DEX) on Thorchain, THOR, has also shown positive movement, further bolstering the growth potential.
Polygon (MATIC) has recently shown signs of strength and has generated whispers within the crypto community about a potential zero-knowledge (ZK) narrative. If this narrative materializes, MATIC, a leader in the space, could attract significant positive flows.
Within the ZK narrative, altcoins like Dusk Network (DUSK), Loopring (LRC), and Mina Protocol (MINA) are poised to benefit. Deutscher believes that each altcoin offers unique strengths and value propositions, and their performance will depend on the strength of the emerging ZK narrative.
Soteria (SEI) has gained attention as it enters the top 10 for volume traded by pairs on Upbit. Considered a “new coin,” SEI exhibits fundamentals similar to the next altcoin on the watchlist.
Tidal Finance (TIA) is a relatively new token similar to the early days of Aptos (APT). The market tends to favor new and innovative tokens, and although TIA’s rally may have started to cool off, it still holds explosive potential. With a current market capitalization of $700 million, TIA remains an intriguing opportunity for investors.
In addition to altcoins, perp decentralized exchange (DEX) tokens like GMX, DYDX, and Gnosis (GNS) are positioned to benefit from market volatility.
According to Deutscher, these tokens have shown a correlation between price movements and fundamental factors. If volatility persists, these tokens could present favorable medium-term investment opportunities.
Yield Guild Games (YGG) and Gamestarter (GMT), gaming tokens with initial upward movements, are expected to continue outperforming the broader market. These gaming tokens could witness sustained growth with the YGG conference scheduled for November 18.
While the current correction in the cryptocurrency market has led to pullbacks in Bitcoin and Ethereum, the altcoin landscape still offers potential opportunities for investors.
Solana’s continued uptrend, along with the prospects of altcoins like Thorchain, Polygon, and those associated with the ZK narrative, suggest possible avenues for growth. Additionally, emerging tokens like Soteria and Tidal Finance, perp DEX tokens, and gaming tokens may also provide favorable investment prospects.
(This site’s content should not be construed as investment advice. Investing involves risk. When you invest, your capital is subject to risk).
Featured image from Shutterstock, chart from TradingView.com
Solana (SOL) has been soaring, looking at the performance in the daily chart. At spot rates, the coin is trading above $50, up 520% in the past year when it slipped below $8 following the collapse of FTX, a now-defunct crypto exchange, and Alameda Research, a trading wing linked with FTX and one of the leading crypto market makers.
Though Solana is “blistering” and at new 2023 highs, Kaiko, a crypto analytics platform, is concerned about the disparity in liquidity in USD and “native unit” terms. Typically, the “native unit” refers to the base unit of account of any currency, in this case, SOL.
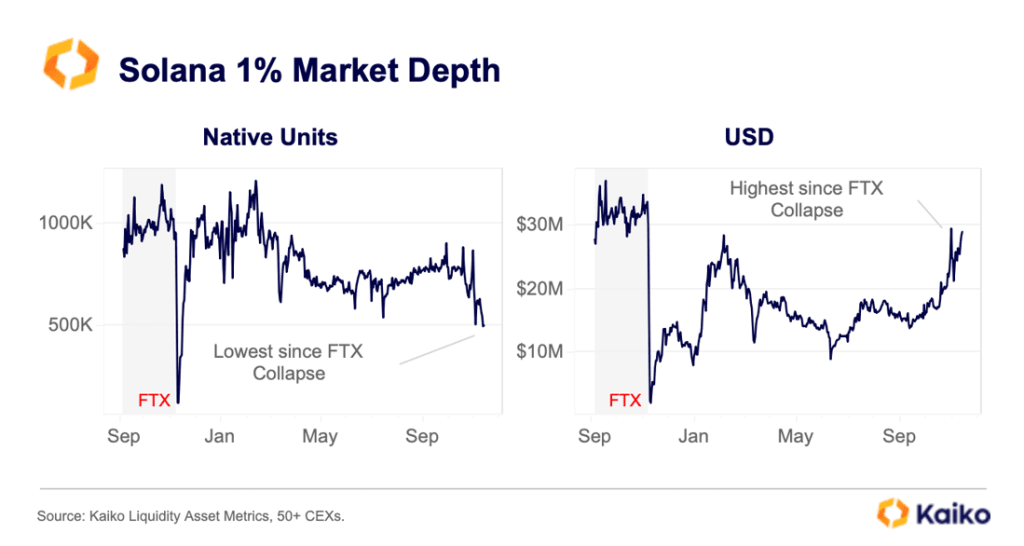
Native units can be used to measure market depth since it provides easier access for gauging the relative liquidity of the coin without the need to convert it to other denominations, like USD or BTC, for example.
As Kaiko notes on November 14, at a 1% market depth, Solana’s liquidity in USD terms is at the highest level since the collapse of FTX. However, looking at SOL’s liquidity through another lens, the coin is struggling. Using “native units” as a liquidity gauge, it is at the lowest point since the FTX collapse.
The collapse of FTX was critical not only for SOL and its native tokens but also for the broader crypto markets. Following the bankruptcy of the Sam Bankman Fried exchange in November 2022, SOL prices cratered as fear of contagion across the board also saw Bitcoin (BTC) prices shrink, failing at its perceived role as a safe haven.
By November 2022, Bitcoin had flash crashed below $16,000, with Solana dumping from highs of $220 to as low as $8. This contraction also saw crypto’s liquidity, which was more adverse in Solana.
Looking at how liquid SOL is in its native units, it is apparent that liquidity is yet to recover and might require more time despite the general optimism across Solana communities. According to Kaiko, it suggests that market makers are opting to maintain stable liquidity for SOL even with soaring prices in USD terms.
Presently, SOL prices are steady above $50 but maintain an uptrend versus the USD. There are a series of lower lows in lower time frames, early indicators that the upside momentum might be cooling off, and SOL traders possibly exiting their long positions. Even so, $38, marking November 2022 highs, is a vital reaction point for technical analysts.
India’s Supreme Court has turned away a petition that sought to direct the government and relevant authorities to frame guidelines for regulating the trading and mining of cryptocurrencies.

The French developer of the Mutant Ape Planet NFT collection faces up to five years in prison after pleading guilty to wire fraud charges.
The Chainlink rally has slowed down recently; here’s what the various LINK on-chain metrics look like to see if the surge has hope of a restart.
Just during the weekend, Chainlink had been floating above the $16 mark, but winds seem to have shifted for the coin in the past couple of days, as it has registered some drawdown.
During the last 24 hours alone, LINK has dropped around 6%, leading to its price slipping below the $14 level. The chart below shows how the cryptocurrency has performed in the past month.
As displayed above, Chainlink had been riding some sharp bullish momentum in this period before this latest plunge, as the asset had more than doubled in value. Despite the decline, LINK is still up over 90% in the past month, which is an impressive return.
Naturally, the investors may be wondering now if the asset has already hit its peak for this rally or if there is more to come shortly. It’s hard to say anything about that, but perhaps on-chain data could provide some hints.
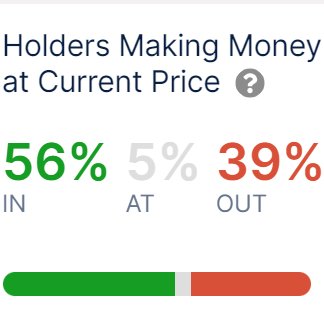
In a new post on X, the market intelligence platform IntoTheBlock has shared the data of some Chainlink on-chain indicators. First, when the firm made the post, about 56% of the asset’s investors were sitting on some profit.
The cryptocurrency had then been floating at higher levels than currently (although not too high), so more LINK addresses would have entered a state of loss by now.
Generally, investors in profit are more likely to sell at any point, so a large amount of them being in the green could raise the probability of a selloff. Some Chainlink investors are currently harvesting their profits, but the profitability ratio is still not skewed that much towards profits.
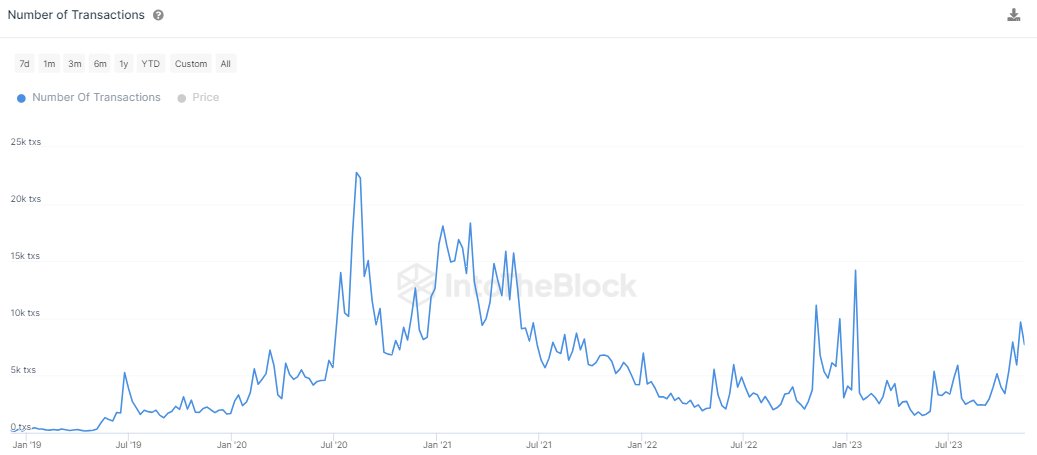
Next, IntoTheBlock has talked about the number of transactions on the network.
“The Chainlink network is showing many positive signs in terms of transaction data,” says the intelligence platform. “Notably, we see a healthy increase in the number of transactions.”
The number of transactions is up 436% from the monthly lows, and as is usually the case, the volume has also spiked alongside this rise.
The transaction activity being high suggests there is interest behind the asset, and so, the price action shouldn’t go stale just yet. However, the volatility due to this activity can go either way, as the asset is already witnessing.
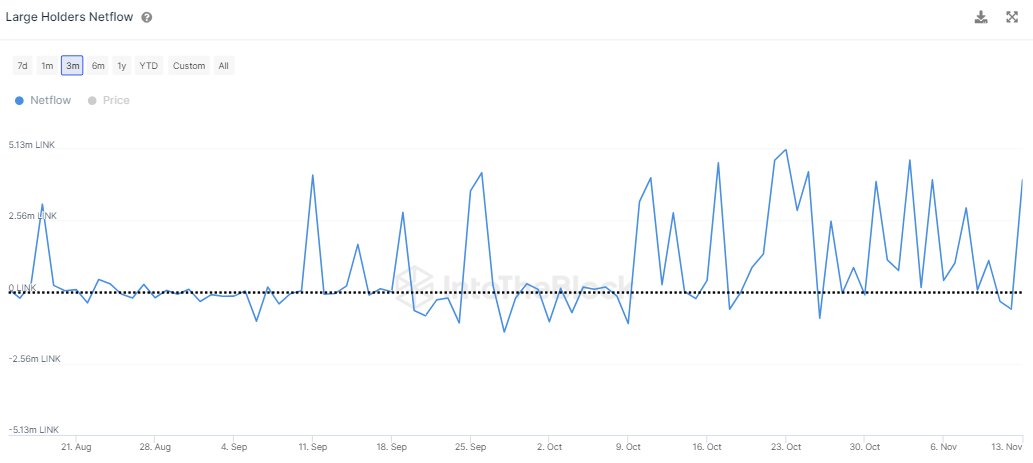
A metric that could more solidly point at a direction for the cryptocurrency is the large holder netflow, which keeps track of the net accumulation/distribution behavior over the last month for LINK holders carrying more than 1% of the supply.
As is visible in the chart, the large Chainlink holders have been buying recently, which could potentially be a positive sign for the asset. This doesn’t have to mean that the rally would restart shortly, of course, but it does provide some support for the idea.
An XRP and crypto enthusiast on X (formerly Twitter) has announced the launch of the newest version of the XRP Ledger, highlighting core updates and new functionalities on the upgraded ledger.
XRP enthusiast, Krippenreiter has released the latest details on the newly upgraded XRP ledger on an X post on November 12. The update introduces four distinct changes incorporated into XRPL’s new version as well as four proposed amendments for the ledger.
“A new major breaking change is on its way to the XRPL ecosystem in the shape of yet another rippled version update. If all goes as planned, this new version will be available to all node operators by November 13, 2023,” Krippenreiter stated.
The community member described the new API version, APIV2, which offers more functionalities than traditional APIs. The launch of API V2 on XRPL will include the introduction of a DeliverMax feature, added error messages, and removed API methods.
Krippenreiter also described the XRP ledger’s Transaction Per Second (TPS) performance and stability. He stated that the new upgrades on this functionality were originally proposed by MarkTravis15 on X, and incorporated three changes that may improve the performance of the ledger.
These changes focus on enhancing the consensus stability, implementing asynchronous writing of batches to NuDB, and introducing periodic intervals when applying transaction batches.
Another noteworthy upgrade to the XRP Ledger is the introduction of a new RPC method which allows software apps to effectively connect to a specific network in the XRPL ecosystem by asking information from the node. Other changes in the XRP Ledger include bug fixes and refactoring or rewriting of codes to ensure better readability and efficiency.
While providing details on updates in the newest version of the XRP Ledger, Krippenreiter highlighted a series of proposed amendments. These amendments, if approved by the community and subsequently implemented, may have a significant positive impact on the XRPL ecosystem.
The first amendment, originally titled federated side chains, involves bidirectional connectivity to XRPL assets. This proposal aims to open new routes for interoperability in the XRP ecosystem using witness servers like Xahau, CBDCL, and others.
Krippenreiter also described the second amendment which implements a sovereign identity solution on XRPL called decentralized identifiers (DID). A third amendment seeks to address the unexpected behavior of the XRPL payment engine, providing solutions that appropriately fix the problem.
Finally, the last amendment will help clarify how authorized trust lines should be established and permitted. This proposal specifically focuses on situations where the issuer and user enable certain settings on their accounts.

Despite new investment in the crypto exchange, Blockchain.com’s valuation has more than halved from its $14 billion peak.
On Monday, news quickly spread after a BlackRock XRP ETF filing popped up on the Delaware Corp. Commission website. The filing has since been claimed to be false. But the damage was already done as the token’s price surged quickly before reversing.
One interesting development from this event though was a curious correlation that emerged between the XRP price and the XLM price at the time. While the news was localized to XRP, XLM had surged just as much, emerging with a stunning correlation between the two.
In the wake of the rumored BlackRock XRP ETF filing pumping the token’s price, one enthusiast has noticed a significant correlation between XRP and XLM. Crypto analyst and educator Blockchain Backer took to X (formerly Twitter) to reveal what he terms as one of the “most bizarre” moves.
The chart clearly shows the XLM price surging just as the BlackRock news broke with a straight green candle. Likewise, when the news was debunked and the XRP price began to fall, so did the XLM price, in an eerily similar fashion.
In another post, Blockchain Backer revealed that XLM had followed XRP’s move in the 2-second timeframe. A chart shared with this post showed XRP’s movement and XLM’s movement on the same chart and the moves happened at almost the same time, as shown below:
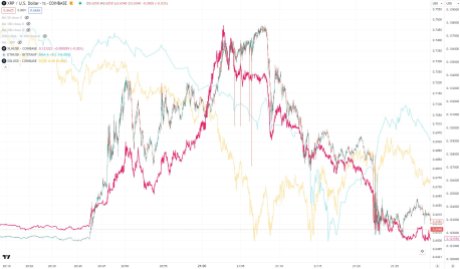
“The fake news was literally XRP specific, and would impact XRP only, not XLM. If anything, you’d expect XLM sell off like the rest of the market. Instead, it mirrors. Why?” the analyst wondered.
XRP and XLM have always seemed to run in the same circles and the correlation in their price movements has been a testament to that. One X user, in response to Blockchain Backer’s post, reasoned that the correlation was because both digital assets actually “share the same holders.”
One crypto analyst who has also closely tied the performance of XLM to that of XRP is Crypto Bilbuwoo. One of their long-running analysis includes both digital assets which the analyst expects to move toward new all-time highs in the same fashion.
In an October 15 post, Crypto Bilbuwoo posited that “The chart shows that 1.618 Fibonacci ratio(XLM: 6.5$, XRP: 26~33$) will be completed at the end of December.” The last time this happened was back in 2017 and the analyst expects a repeat of that trend, saying there would be a 6,500% surge for both assets.
Despite this correlation, Blockchain Backer still finds Monday’s simultaneous pump strange as he believes “those same holders would have dumped XLM for XRP. Not fomo bought XLM on that news story.”
However, as another X user explains, “Not if they believe XLM and XRP are brother and sister. There are some influencers peddling this for years. Doesn’t make logical sense but does with that narrative. XLM would be next!”
Tuesday’s sharp decline in crypto prices spurred the largest daily leveraged long liquidation since August, CoinGlass data shows.
The recent Bitcoin (BTC) price surge has ignited renewed interest and confidence among investors, leading many to believe that the BTC bull run is accelerating.
According to trader and crypto analyst Adrian Zduńczyk, Bitcoin has reached a new 52-week closing high and has maintained a close above the previous high of $32,000 for three consecutive weeks.
This sustained upward momentum indicates a strong bullish trend sentiment and signals the beginning of the third wave of the Bitcoin bull run.
Zduńczyk points out several dominant trends that contribute to the positive outlook for Bitcoin. The rising 200-week and 50-week moving averages (MAs) highlight the long-term uptrend strength, with key support levels at $28,800 and $26,600.
Additionally, there is a growing correlation with the S&P 500, as evidenced by the 7-week correlation coefficient of 0.34. This alignment with traditional markets suggests that Bitcoin increasingly trades similarly to the Nasdaq.
Fundamental drivers also play a significant role in Bitcoin’s upward trajectory. Traders eagerly anticipate the approval of spot Bitcoin exchange-traded funds (ETFs) and the upcoming fourth halving event.
Furthermore, according to Zduńczyk, the historical pattern of previous halvings indicates that Bitcoin has rallied significantly after each halving and has never retraced to pre-halving prices.
Examining the daily trend, Zduńczyk highlights the technical strength demonstrated by Bitcoin’s reliable breakout above $32,000. Breakouts often lead to new trend formations that persist over time.
Despite occasional volatility, the 50-day average true range (ATR) trend and the 50-day relative strength index (RSI) momentum trend are rising, indicating ongoing positive momentum.
Bitcoin’s future appears promising, supported by positive market trends, fundamental drivers, and technical indicators. However, warning signs cast doubt on Bitcoin’s favorable outlook, as renowned crypto analyst Ali Martinez pointed out.
Martinez draws attention to the bearish divergence between Bitcoin’s price and network growth, indicating a potential lack of sustained momentum in the ongoing uptrend.
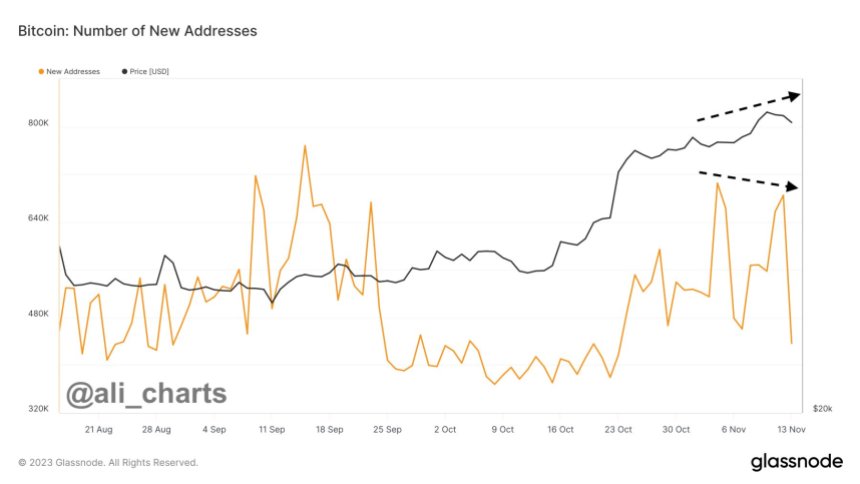
The chart above shows a notable disparity between the exponential rise in Bitcoin’s price and the dramatic decline in new addresses over recent days.
This bearish divergence raises concerns about the overall strength of the current uptrend. While Bitcoin’s value has experienced significant gains, the number of new addresses created has decreased significantly.
According to Martinez, this bearish divergence between Bitcoin’s price and network growth serves as an on-chain sell signal that traders should be aware of. The slowdown in network growth despite the price surge suggests that the current upward momentum may not have enough strength to sustain.
At the time of writing, BTC is trading at $36,200, down 1.6% over the past 24 hours. However, it is still up a substantial 4.6% over the past 7 days.
It remains to be seen if a surge in new addresses will be able to support BTC’s bullish momentum and break the current consolidation phase. Alternatively, the cryptocurrency could retest support levels in the coming days.
Featured image from Shutterstock, chart from TradingView.com
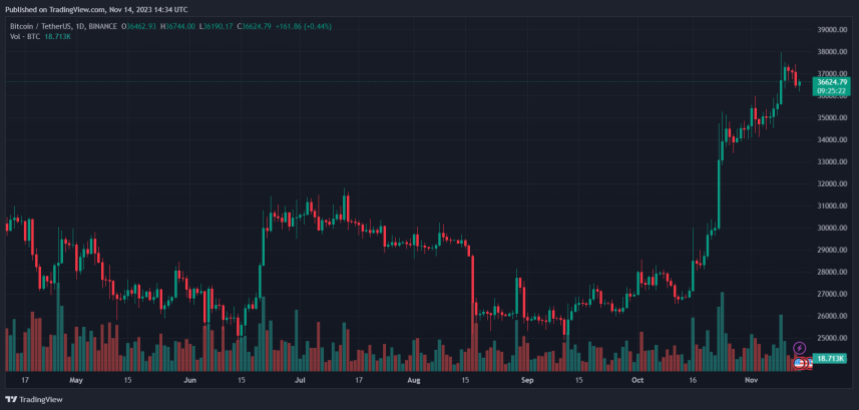
The Bitcoin price returned to its sideways price action following a powerful surge into new yearly highs. The cryptocurrency seems poised for further gains if bulls can hold a critical level.
As of this writing, BTC trades at $36,370, with a 2% loss in the last 24 hours. Over the previous week, the number one crypto by market capitalization recorded a 5% gain, while the sentiment in the sector looks mixed, with BTC recording losses as Ethereum and Solana stayed strong in the same period.
According to a pseudonym analyst, the liquidity in the Bitcoin spot market, measured by a “Liquidity Map,” has been allocated to the downside. This metric gauges the amount of leverage in the BTC/USDT trading pair.
The chart below shows that BTC is trading close to a huge liquidation cluster. Overleverage positions create these levels and are often tapped by big players to exploit the liquidity.
BTC whales chase liquidity, moving prices towards the biggest pools of overleveraged positions. If the $36,300 gets tapped, the next level of interest is located to the upside between $36,961 and $37,700. The analyst stated:
Big clusters at $36K and ~$37K. Would expect there to be quite some positions build up around that 37K region mainly as we chopped around it all day yesterday. Bears are back in control on the LTF (Low Timeframe) below $36.3K I’d say.
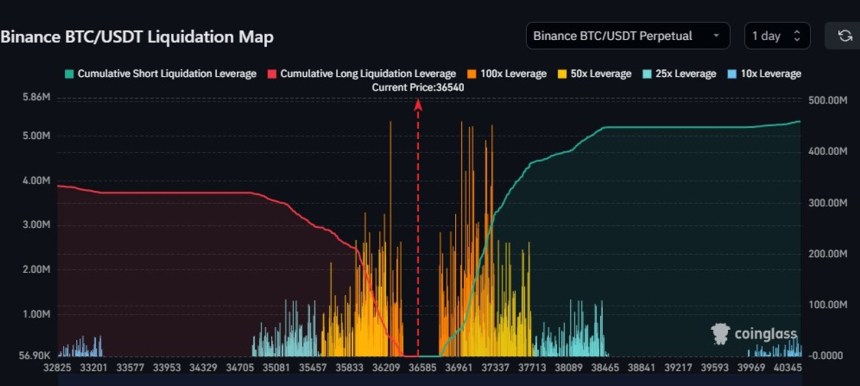
On the other hand, the Bitcoin price could trend sideways between $36,300 and the high of its current range. Additional data from crypto analytics firm Bitfinex Alpha indicates that historical data hints at bad news for optimistic traders.
The firm advises caution for traders as the liquidity gap in the Bitcoin spot market increases. Per recent data, BTC Short-Term Holders Realized Price (STH RP) bought the cryptocurrency at an average price of $30,380, which could incentivize these investors to take profit at current levels.
This is the first time STH has had an opportunity to make a big profit on their BTC holdings since April 2022 and December 2022. Historically, a monthly change in STH RP exceeding $2,000 often signals local peaks, particularly post-recovery in bear markets, as seen in the chart below.
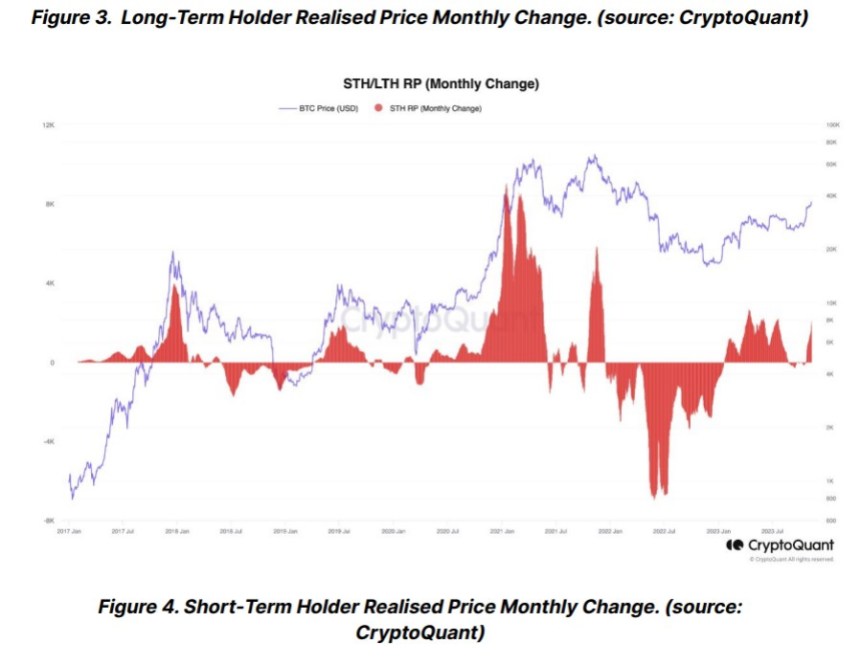
Concurrently, a negative monthly shift in LTH RP usually implies long-term holders are offloading their Bitcoin. The convergence of a $2,000 increase in monthly STH RP and a decline in LTH RP suggests a high likelihood of a local peak in Bitcoin’s price.
Cover image from Unsplash, chart from Tradingview
An unexpected slowdown in inflation sent stock and bond markets sharply higher, but crypto was left out, possibly due to declining enthusiasm about the imminent approval of a spot bitcoin ETF.

State authorities may be investigating the fake registration for a BlackRock “iShares XRP Trust” following a referral from Delaware’s Division of Corporations.
Delaware’s Department of Justice may be investigating the fake filing made for an apparent XRP exchange-traded fund.
The developer behind the Mutant Ape Planet non-fungible token (NFT) collection – a knockoff of the Mutant Ape Yacht Club NFTs – pleaded guilty on Tuesday to defrauding buyers in a rug pull that netted almost $3 million, according to the U.S. Department of Justice (DOJ).