The test will explore bilateral digital asset trades, foreign currency payments, multicurrency clearing and settlement, fund management and automated portfolio rebalancing.
Standard Chartered Investment Arm Launches Tokenization Platform
Libeara will enable the creation of a tokenized Singapore dollar government bond fund.
OpenSea NFT users report massive email phishing campaign

OpenSea users have reportedly been targeted with a widespread email phishing campaign, including a fake developer API risk alert and a fake NFT offer.
Bitcoin’s Options Market Has Overtaken Its Futures Market in a Sign of Growing Sophistication
The notional open interest in the global BTC options market stood at $17.5 billion at press time, while open interest in the futures market was $15.84 billion.
IMF head: CBDCs can replace cash, help financial inclusion

International Monetary Fund Managing Director Kristalina Georgieva urged the public sector to “keep preparing to deploy” central bank digital currencies.
U.S. CBDC Is Unlikely in the Near Term: Bank of America
The Federal Reserve continues to pilot a central bank digital currency, but will not issue one without executive branch and Congressional support, the report said.
Cybersecurity team claims up to $2.1B in crypto stored in old wallets is at risk

The security firm urges those using web browser wallets generated from 2011 to 2015 to transfer their assets to crypto wallets that were generated more recently.
Bitcoin Macro Index Enters ‘Expansion’, Echoing 400% Bull Run Surge
In a detailed market update, Charles Edwards, founder of Capriole Investment, has provided an in-depth analysis of Bitcoin’s current market position, highlighting a pivotal shift to an ‘expansion’ phase in the Bitcoin Macro Index. This transition is particularly noteworthy as it parallels conditions observed prior to historical price surges in Bitcoin’s valuation.
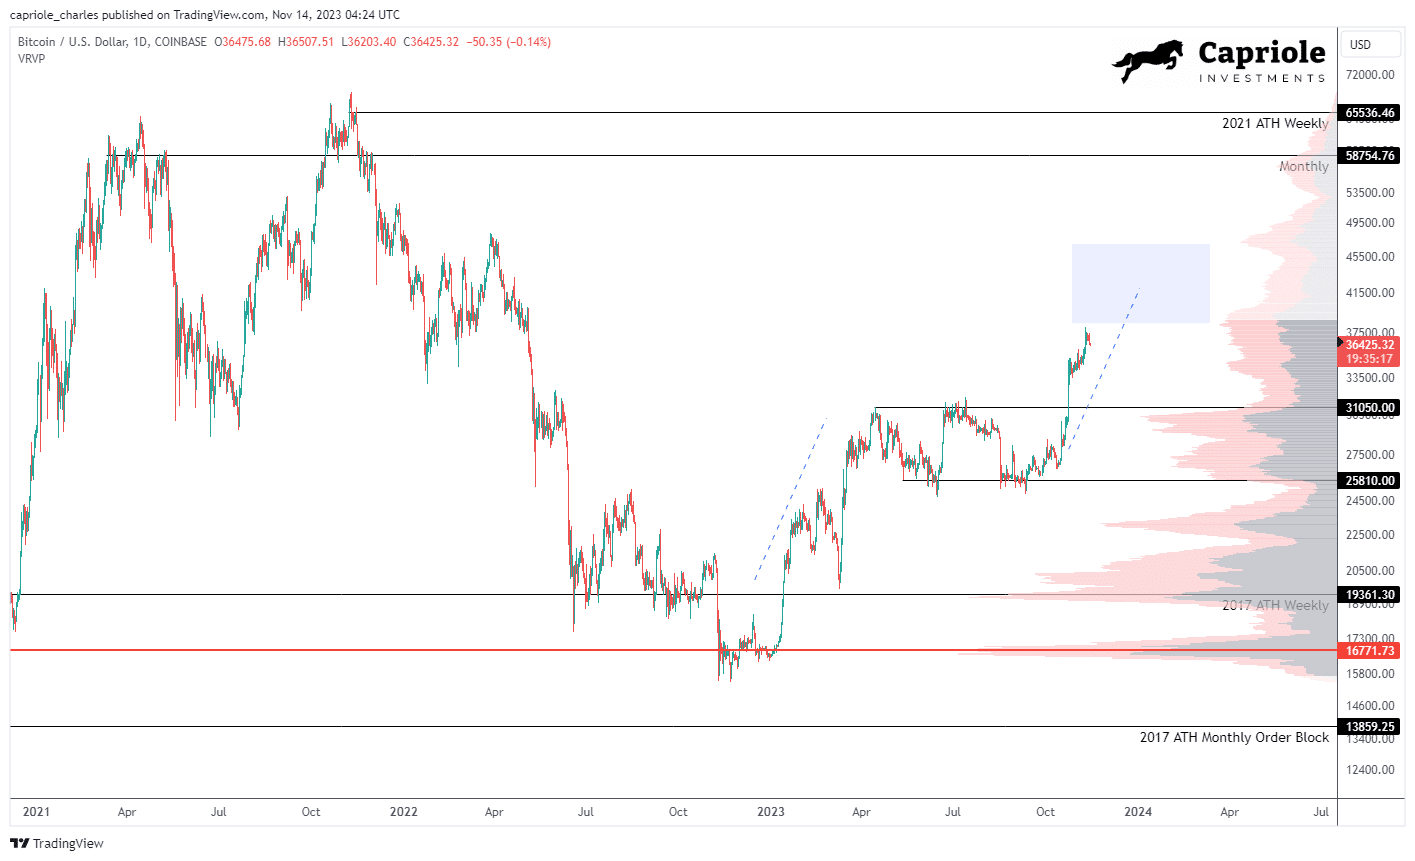
Bitcoin has recently experienced a sharp uptick, ascending from $34,000 to an interim high of $38,000. After a brief period of resistance, the price corrected to approximately $36,500. Edwards highlights this movement as a critical technical victory, with Bitcoin overcoming and holding above the major resistance benchmarks of $35,000 on both the weekly and monthly timeframes.
This consolidation above key resistance levels sets a bullish context in the high timeframe technical analysis, positioning Bitcoin in a strong technical stance according to traditional market indicators. “The recent breakout into the 2021 range offers the best high timeframe technical setup we have seen in years. Provided $35K holds on a weekly and monthly basis in November, the next significant resistance is range high ($58-65K).”
Bitcoin Macro Index Enters Expansion
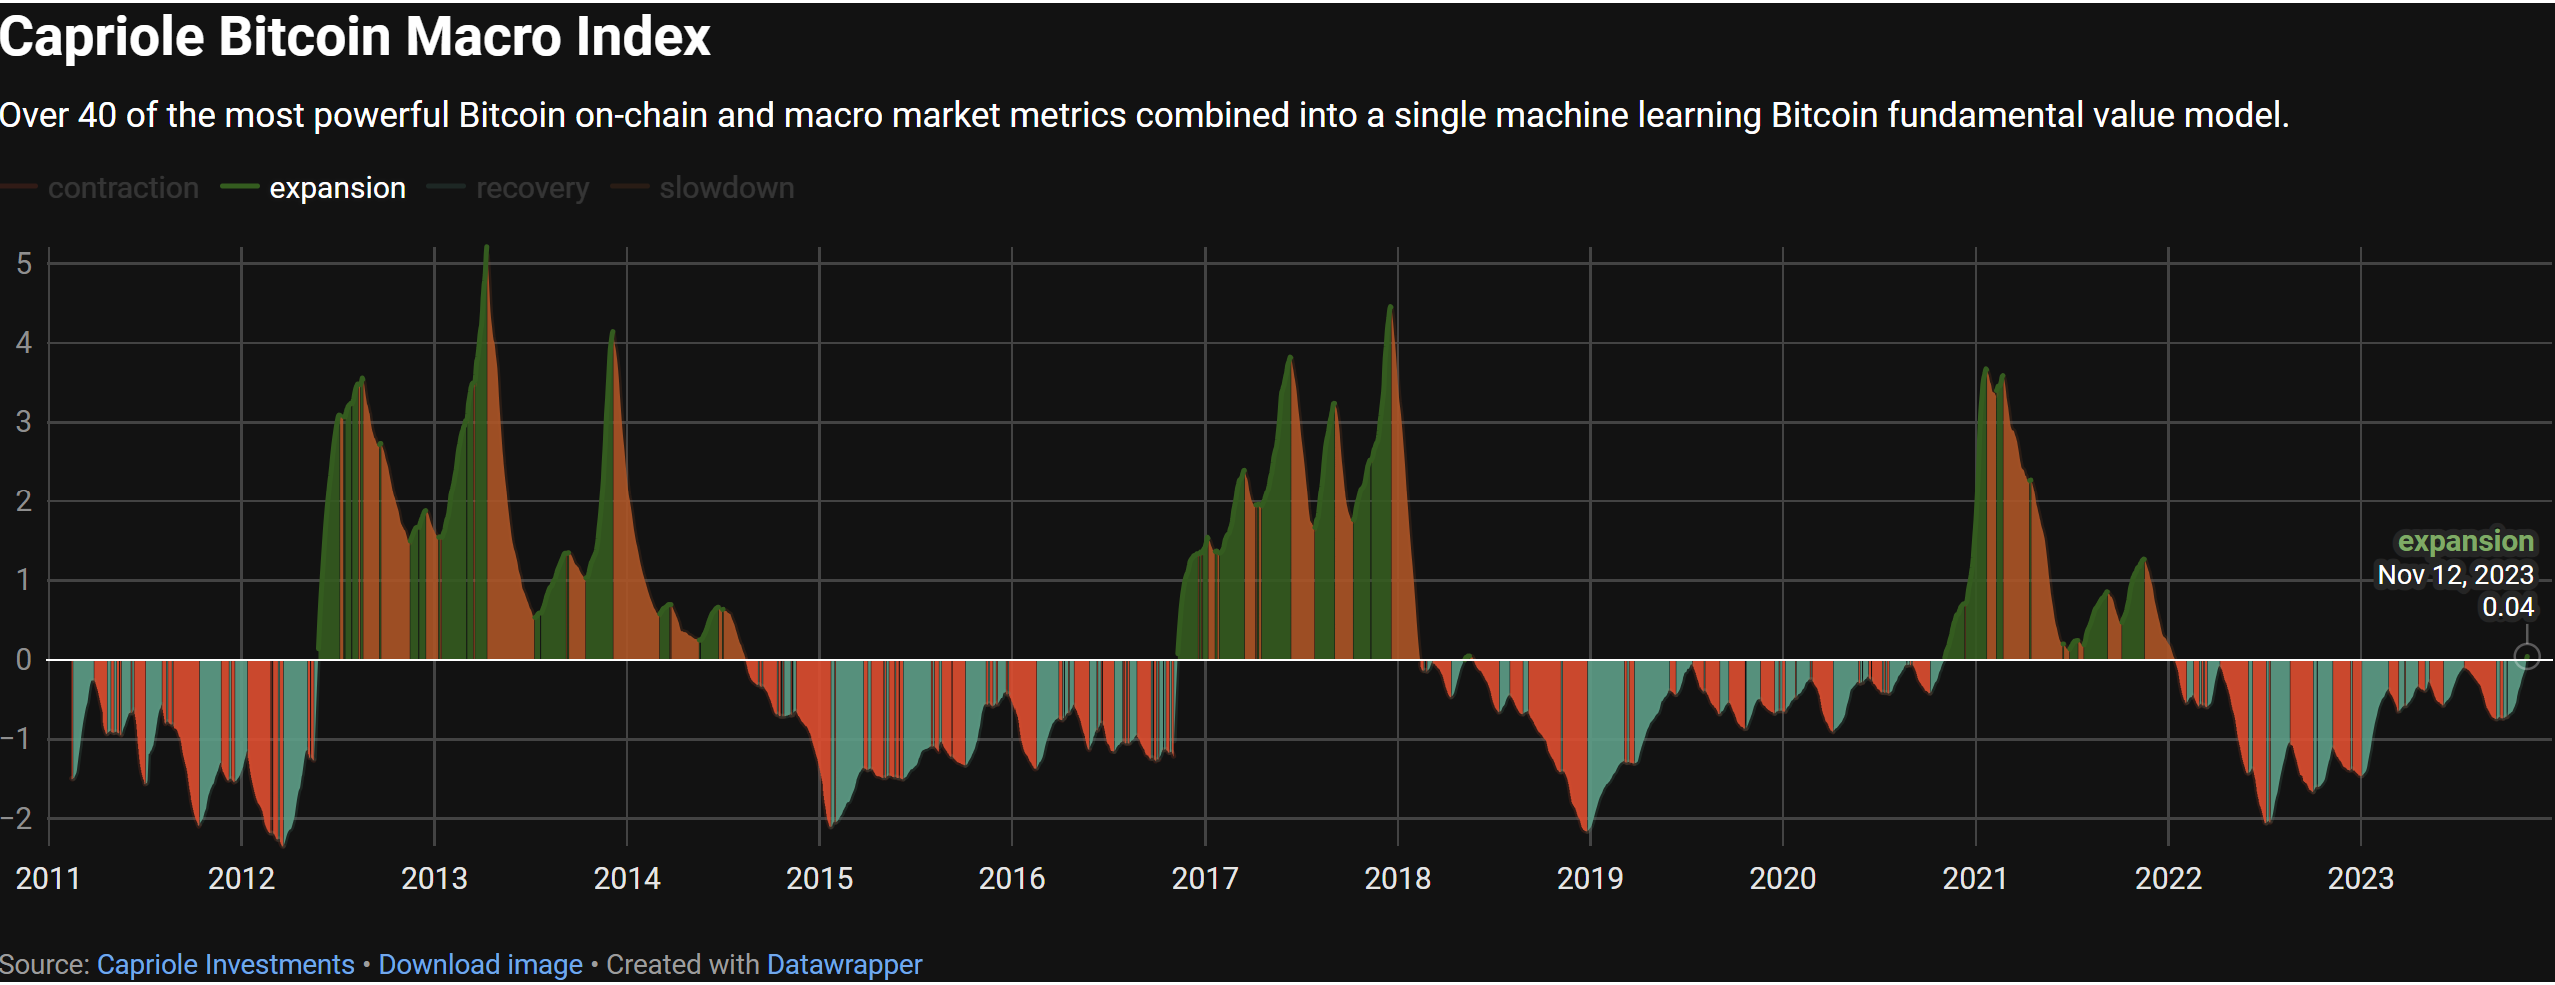
The crux of Edwards’ update is the shift in the Bitcoin Macro Index, a complex model synthesizing over 40 metrics encompassing Bitcoin’s on-chain data, macro market indicators, and equity market influences. The index does not take price as an input, thus providing a ‘pure fundamentals’ perspective.
The current expansion is the first since November 2020, and only the third instance since the index’s inception, with the two previous occasions leading to substantial price rallies in the following periods. Edwards elucidates this with a direct quote: “The transition from recovery to expansion is simply the optimal time to allocate to Bitcoin from a risk-reward opportunity for this model.”
A look at the Bitcoin chart reveals that the Bitcoin price rose by a whopping 400% during the last bull run from early November 2020 to November 2021, after the Macro Index entered the expansion phase. The first historical signal was provided by the Macro Index on November 9, 2016, which was followed by a massive bull run of almost 2,600% until Bitcoin reached its then all-time high of $20,000 in February 2018.
Short-Term Technicals And Derivatives Market Analysis
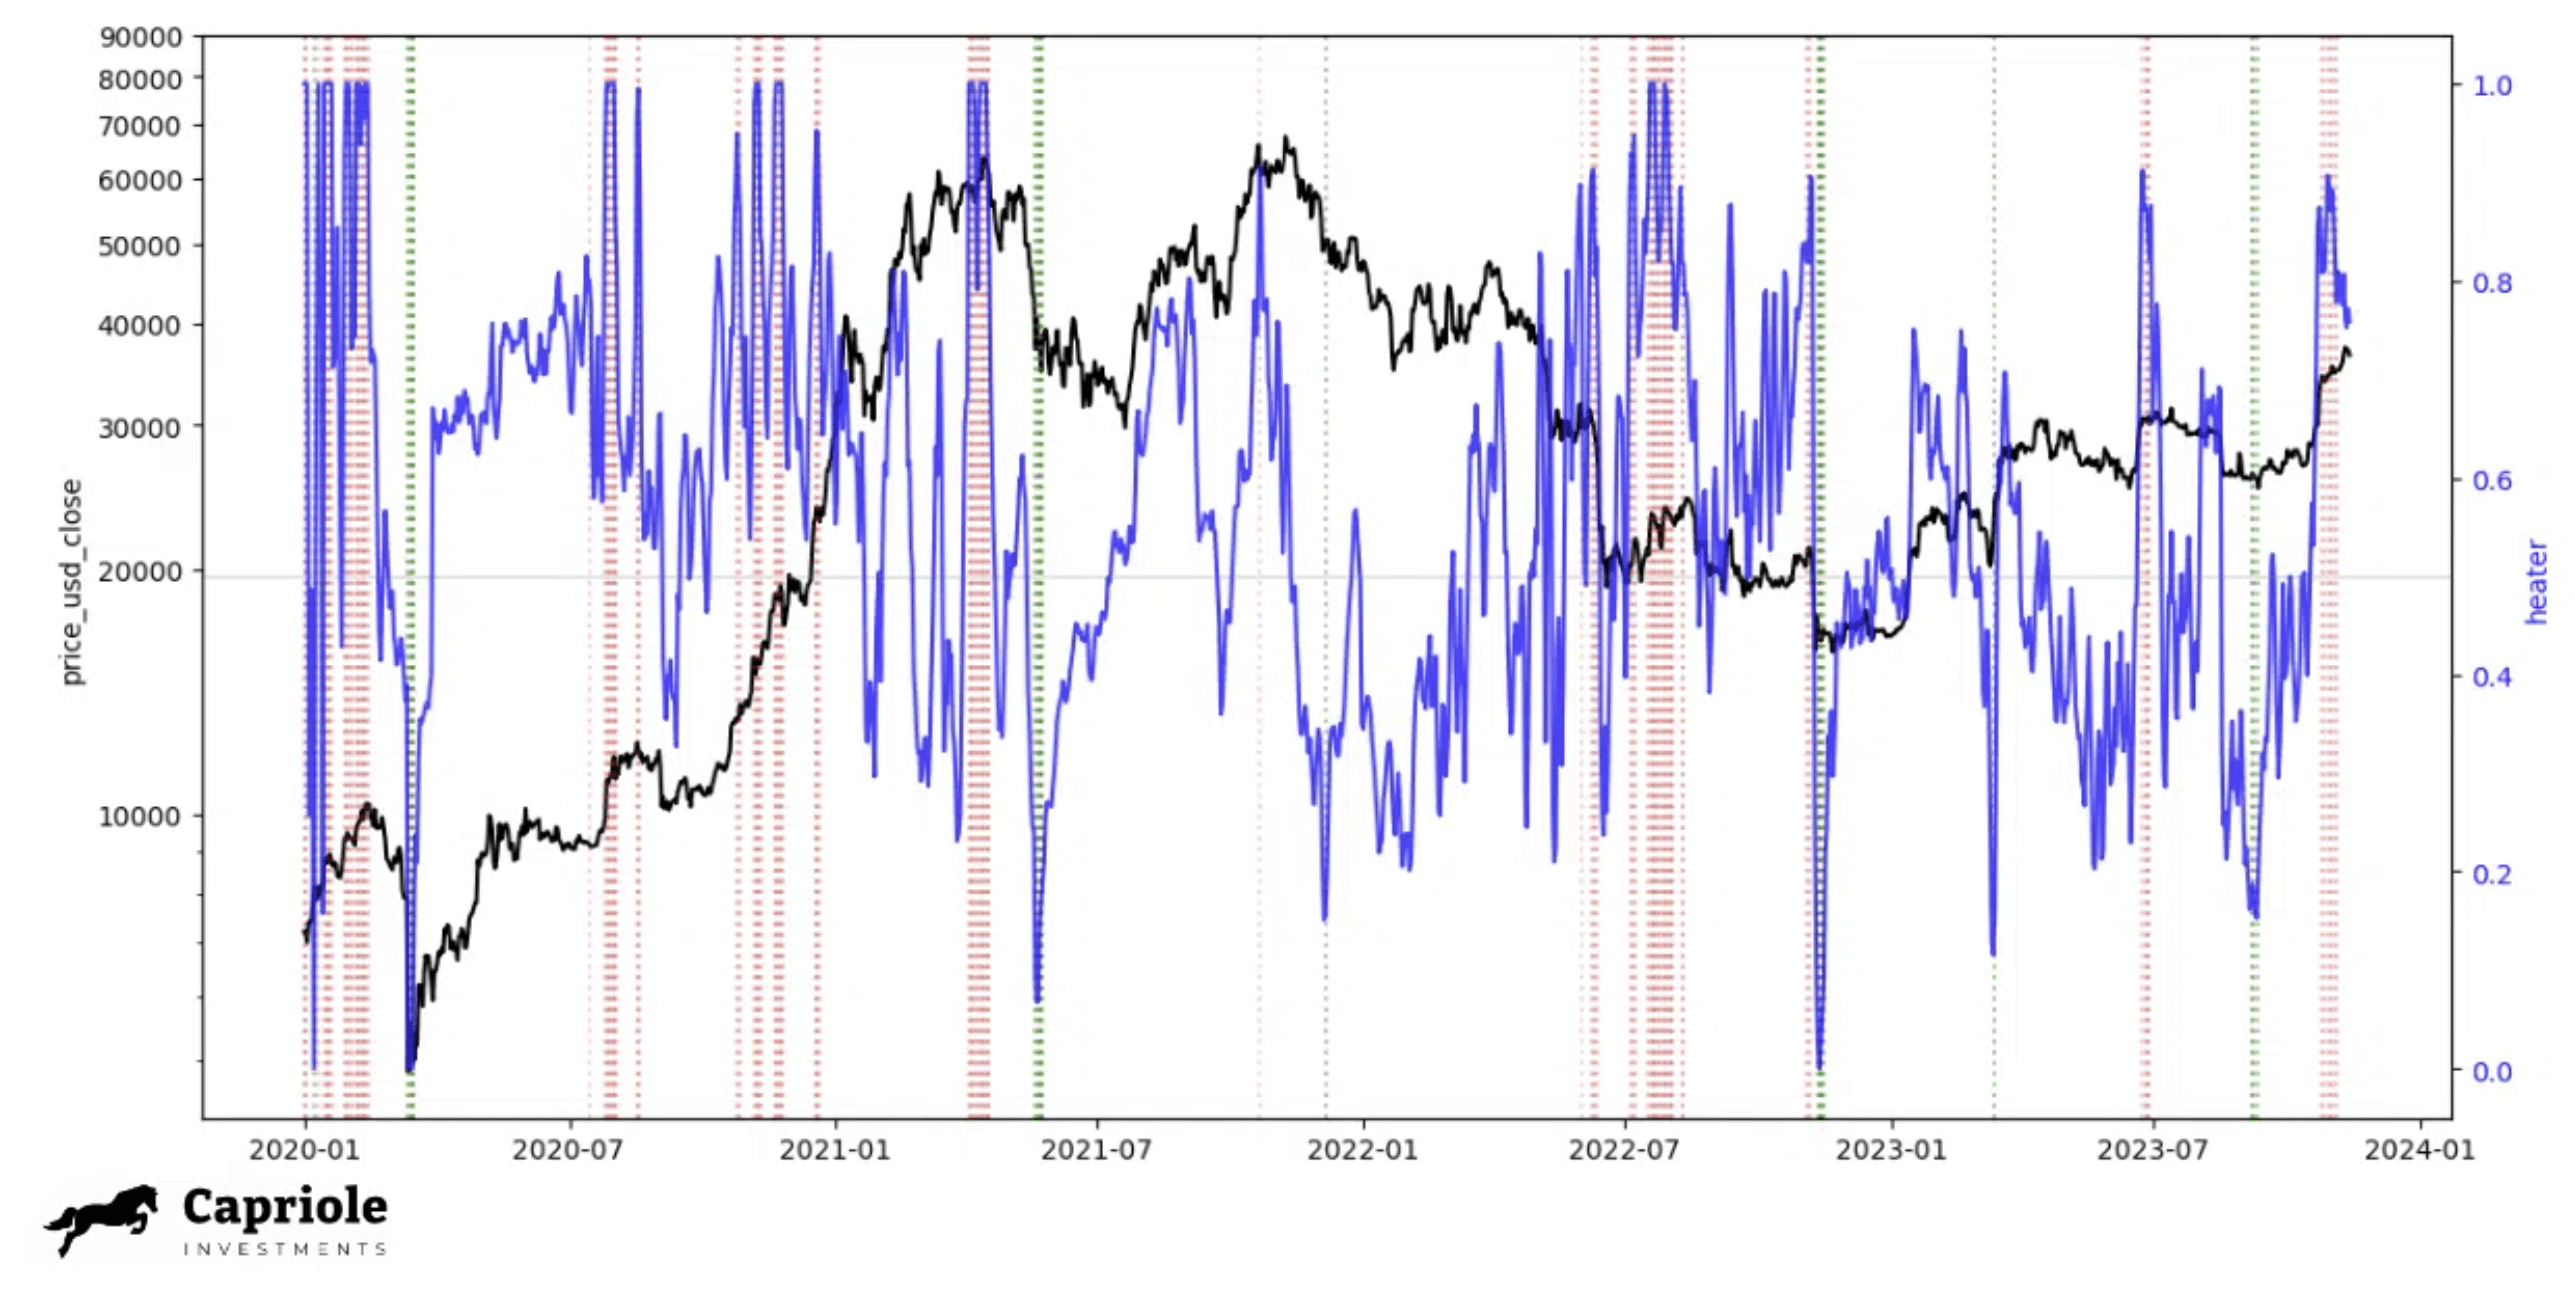
In the short term, the technical outlook presents a mixed picture, according to Edwards. The derivative markets are indicating an overheated state, with low timeframe analysis suggesting a retracement could be imminent. Edwards introduces the ‘Bitcoin Heater’ metric, recently launched on Capriole Charts, which aggregate various derivatives market data and quantify the level of market risk based on the open interest and heating level of perpetuals, futures, and options markets.
The below chart shows that most of the time when the Bitcoin Heater is above 0.8, the market corrects or consolidates. “But there are large exceptions to the rule: such as the primary bull market rally from November 2020 through to Q1 2021. […] We should expect this metric to be high more frequently in 2024 (much like Q4 2020 – 2021),” Edwards stated.
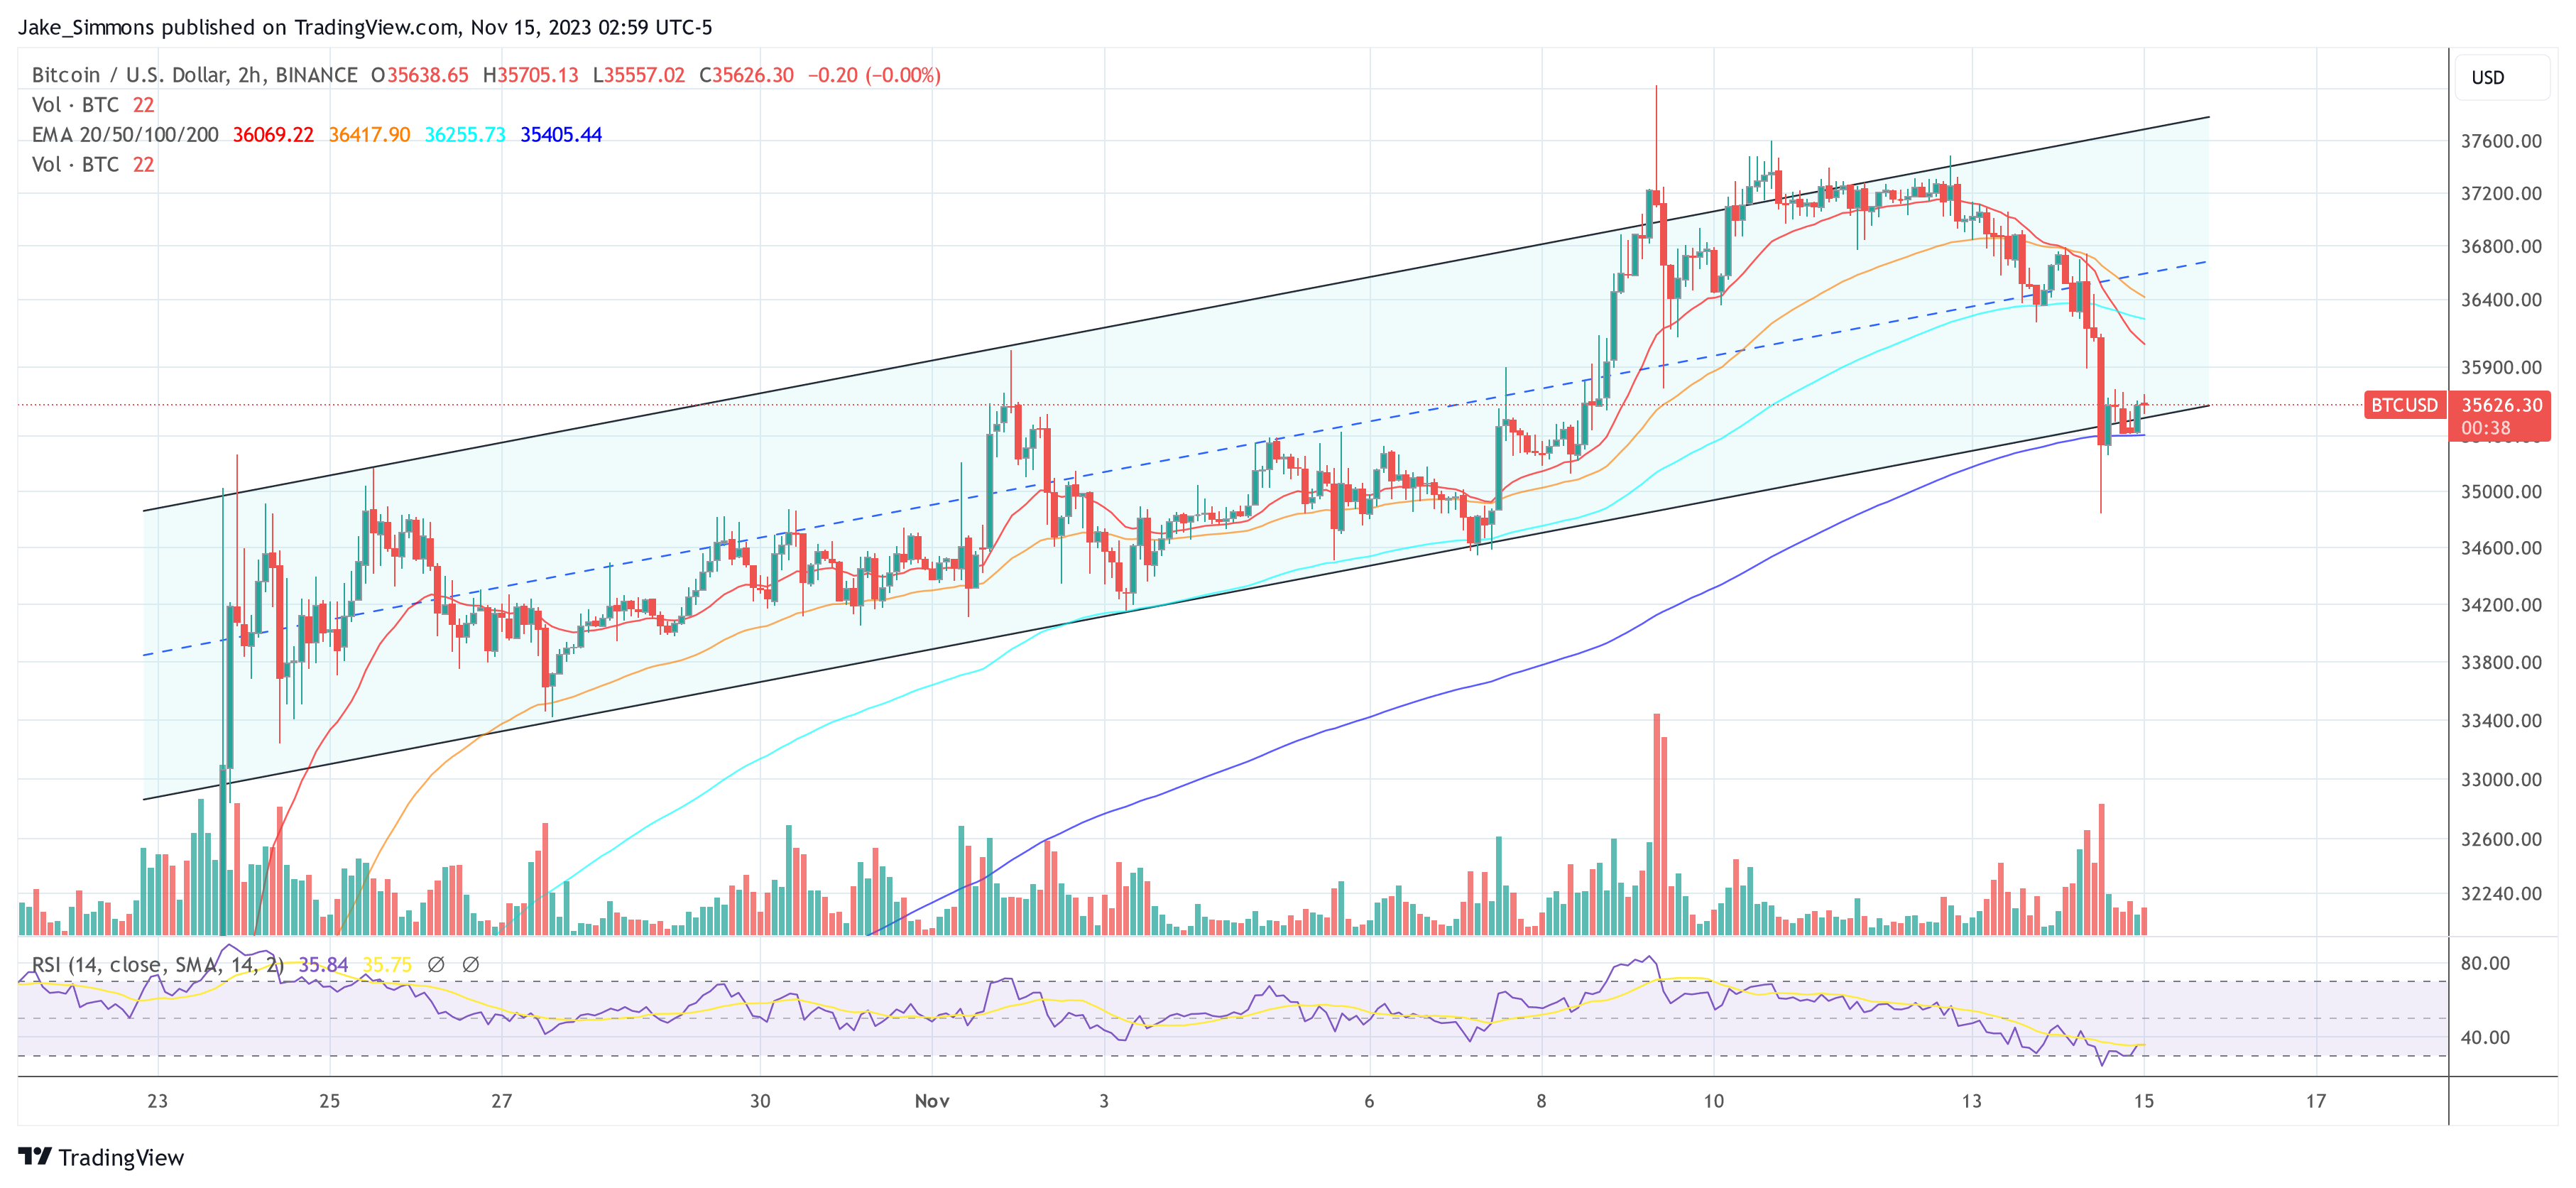
The analyst concluded that the overall trend for Bitcoin remains positive, with major data points indicating a strong bullish scenario. However, he also cautioned about potential short-term risks in the low timeframe technicals and derivatives market. These, according to him, are common in the development of a bull run and could offer valuable opportunities if dips occur.
At press time, BTC traded at $35,626.
Crypto custodian Hex Trust receives Dubai VASP license

Institutional cryptocurrency custodian Hex Trust adds Dubai to its list of operational jurisdictions in addition to Hong Kong, Singapore, Vietnam, Italy and France.
BTC price bounces at 1-week lows as Bitcoin whales sell into $35K

Bitcoin drops $1,000 in just one hour as a cascade of liquidations greets late Bitcoin long positions.
YouTube says creators must disclose gen AI use or face suspension

YouTube’s updated community guidelines include new disclosure requirements for AI-generated content, its new standards for “sensitive topics,” and the removal of deep fakes.
OKX joins Komainu and CoinShares for institutional segregated asset trading

Sebastian Widmann, head of strategy at Komainu, believes this is a necessary step to attract institutions to adopt digital assets.
Crypto Futures Funding Rates Normalize After Bitcoin Drops to $35.6K
Large movements in spot markets led to open interest surging to $35 billion over the weekend, indicating highly leveraged bets from traders hoping for even higher prices.
Crypto Giant OKX Goes Live With Off-Exchange Derivatives Trading
Asset manager CoinShares along with crypto custody joint venture Komainu are aiming for TradFi standards in derivatives settlement with much reduced counterparty risk.
JPM Coin Poised For $10 Billion Daily Transaction Boom, JPMorgan Reports
JPMorgan Chase & Co. anticipates that its digital currency, JPM Coin, will facilitate daily transactions amounting to $10 billion in the coming year.
Umar Farooq, the Global Head of Financial Institution Payments at the bank, revealed this projection during an interview with Bloomberg held at the Singapore FinTech Festival.
Farooq’s insights shed light on the ambitious expectations the financial institution has for the widespread adoption and utilization of JPM Coin as a means of conducting transactions in the digital financial landscape.
Takis Georgakopoulos, the Global Head of Payments at JPMorgan Chase & Co., recently disclosed that JPM Coin is actively managing a staggering $1 billion in daily transactions.
In a recent interview on Bloomberg Television, Georgakopoulos highlighted the predominant use of JPM Coin in daily transactions denominated in US dollars and underscored the bank’s dedicated efforts to broaden its utilization, signaling a robust commitment to the ongoing evolution of digital financial instruments.
JPM Coin: Ambitious Growth Goals
Farooq expressed his aspiration for a substantial increase in transaction volume, aiming for a growth rate ranging from five to 10 times over the specified period.
“We really think it’s going to start taking off,” he said during an interview with Haslinda Amin of Bloomberg TV Wednesday, on the sidelines of the Singapore FinTech Festival.
Although the billion-dollar daily transaction volume achieved by JPM Coin is notable, it represents only a small fraction of the colossal $10 trillion in daily US dollar transactions managed by JPMorgan.
JPM Coin presents a secure and efficient avenue for wholesale clients to participate in dollar and euro-denominated payments within the confines of a private blockchain network.
Testing The Waters: Evaluating Digital Ledgers On A Grand Scale
Advocates for blockchain technology contend that it has the potential to facilitate instant payments at a reduced cost compared to prevailing technologies.
However, it’s crucial to note that digital ledgers, despite their touted advantages, have not undergone trials on the same expansive scale as established payment networks.
The claims surrounding the efficiency and cost-effectiveness of blockchains are still in the process of being substantiated through broader and more comprehensive real-world applications.
Programmable Payments For Institutional Clients
Meanwhile, JPMorgan has just implemented a programmable payment functionality specifically designed for institutional customers of their private blockchain network.
The programmable payments functionality has been made available to all institutional clients, enabling the execution of real-time, programmable treasury operations and the development of novel digital business models.
The first institutional client to utilize the programmable payments capability is Siemens AG, a German tech company that demonstrated its use as recently as November 6. Before the conclusion of 2023, FedEx and Cargill are anticipated to utilize the solution as well.
(This site’s content should not be construed as investment advice. Investing involves risk. When you invest, your capital is subject to risk).
Featured image from AdWeek
Crypto Market Sees Net Capital Inflow for First Time in 17 Months
The 90 day net change in the supply of the top four stablecoins has flipped positive, indicating an inflow of capital into the market.
XRP Price Prediction – Breaking This Resistance Could Spark Fresh Rally
XRP price started a downside correction from the $0.750 zone. The price retested the $0.600 support zone and might soon attempt a fresh rally.
- XRP started a downside correction from the $0.750 resistance zone.
- The price is now trading below $0.650 and the 100 simple moving average (4 hours).
- There is a major bearish trend line forming with resistance near $0.6550 on the 4-hour chart of the XRP/USD pair (data source from Kraken).
- The pair might correct further lower, but the bulls could remain active near $0.600.
XRP Price Dips Below $0.650
After rallying above the $0.720 resistance, XRP faced resistance. The price struggled to clear the $0.750 barrier and recently started a downside correction, like Bitcoin and Ethereum.
The price declined below the $0.720 and $0.700 support levels. The bears even pushed it below the $0.650 pivot level. However, the bulls were active near the $0.600 zone. A low is formed near $0.5938 and the price is now attempting a fresh increase.
XRP is now trading below $0.650 and the 100 simple moving average (4 hours). There is also a major bearish trend line forming with resistance near $0.6550 on the 4-hour chart of the XRP/USD pair.
On the upside, immediate resistance is near the $0.630 level or the 23.6% Fib retracement level of the recent decline from the $0.7499 swing high to the $0.5938 low. The first major resistance is near the $0.640 zone or the trend line.
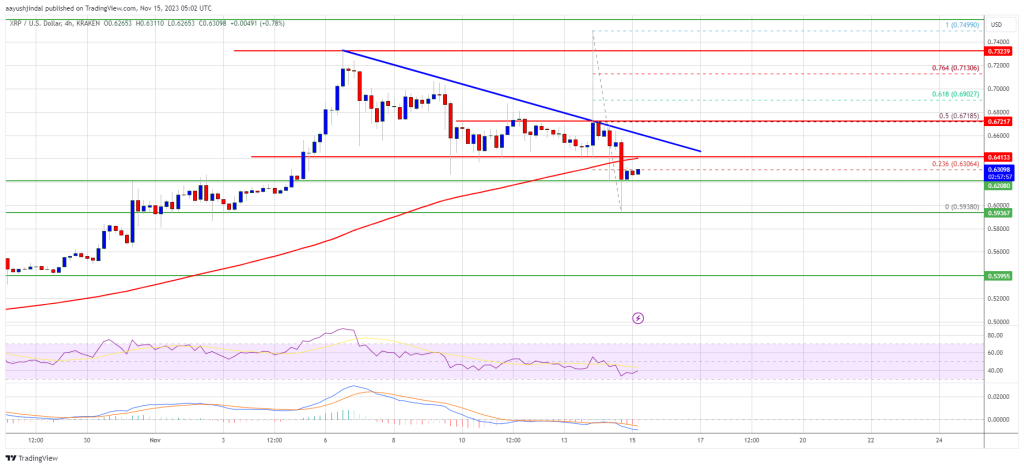
Source: XRPUSD on TradingView.com
A close above the trend line could send the price toward the $0.672 resistance. It is near the 50% Fib retracement level of the recent decline from the $0.7499 swing high to the $0.5938 low. If the bulls remain in action above the $0.672 resistance level, there could be a rally toward the $0.750 resistance. Any more gains might send XRP toward the $0.788 resistance.
Are Dips Limited?
If XRP fails to clear the $0.640 resistance zone, it could continue to move down. Initial support on the downside is near the $0.620 zone.
The next major support is at $0.600. If there is a downside break and a close below the $0.600 level, XRP price might accelerate lower. In the stated case, the price could retest the $0.540 support zone.
Technical Indicators
4-Hours MACD – The MACD for XRP/USD is now losing pace in the bullish zone.
4-Hours RSI (Relative Strength Index) – The RSI for XRP/USD is now below the 50 level.
Major Support Levels – $0.620, $0.600, and $0.540.
Major Resistance Levels – $0.630, $0.640, and $0.672.
Blockchain.com Closes $110M Raise: Bloomberg
The exchange’s valuation in the $110 million round was less than half of its previous $14 billion valuation, according to the report.
Crypto Custodian Hex Trust Obtains Full Dubai Operating License
This final approval allows the firm to offer digital asset custodial services to institutional clients and sophisticated investors in Dubai.
Ethereum Price Trims Gains – These Factors Could Trigger Fresh Increase
Ethereum price started a downside correction and traded below $2,000. ETH must stay above $1,920 to start a fresh increase in the near term.
- Ethereum is correcting gains and testing the $1,920 support zone.
- The price is trading below $2,000 and the 100-hourly Simple Moving Average.
- There is a key bearish trend line forming with resistance near $2,000 on the hourly chart of ETH/USD (data feed via Kraken).
- The pair could start a fresh increase if it clears the $2,000 resistance zone in the near term.
Ethereum Price Holds Key Support
After struggling to clear the $2,120 resistance, Ethereum price started a downside correction like Bitcoin. ETH traded below the $2,050 and $2,000 support levels.
However, the bulls were active above the $1,920 support zone. A low was formed near $1,933 and the price is now consolidating losses. It is trading near the 23.6% Fib retracement level of the recent drop from the $2,118 swing high to the $1,933 low.
Ethereum is now trading below $2,000 and the 100-hourly Simple Moving Average. Immediate resistance is near the $2,000 zone. There is also a key bearish trend line forming with resistance near $2,000 on the hourly chart of ETH/USD.
The next major resistance sits at $2,025 or the 100-hourly Simple Moving Average or the 50% Fib retracement level of the recent drop from the $2,118 swing high to the $1,933 low. A close above the trend line and $2,025 could start a decent increase.
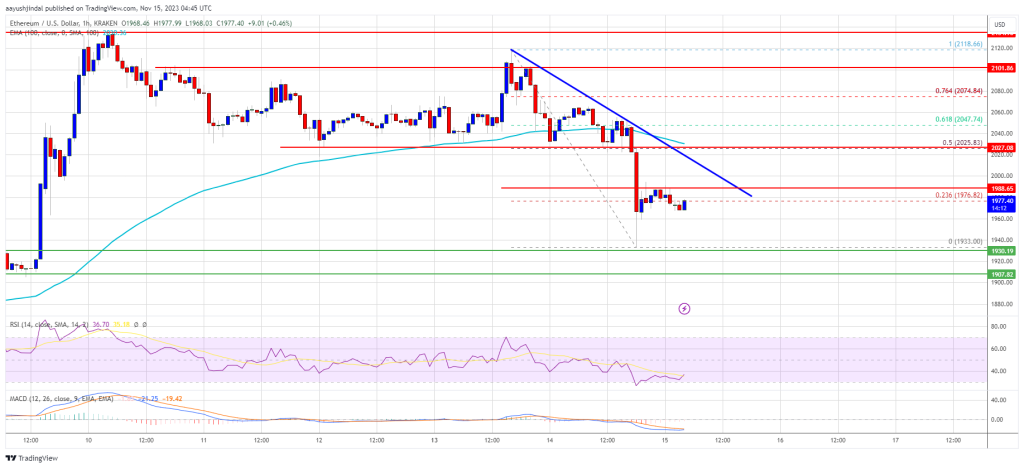
Source: ETHUSD on TradingView.com
The next key resistance is near $2,075, above which the price could aim for a move toward the $2,120 barrier. Any more gains could start a wave toward the $2,250 level.
More Losses in ETH?
If Ethereum fails to clear the $2,000 resistance and the trend line, it could start a fresh decline. Initial support on the downside is near the $1,950 level.
The next key support is $1,920. A downside break below the $1,920 support might start a sharp decline. In the stated case, Ether could drop toward the $1,850 support zone in the near term. Any more losses might call for a drop toward the $1,800 level.
Technical Indicators
Hourly MACD – The MACD for ETH/USD is losing momentum in the bearish zone.
Hourly RSI – The RSI for ETH/USD is now below the 50 level.
Major Support Level – $1,920
Major Resistance Level – $2,025


