The European Commission outlined four critical technology areas, including AI technology and semiconductor chips, on which it plans to run assessments to consider export controls.
Cryptocurrency Financial News
The European Commission outlined four critical technology areas, including AI technology and semiconductor chips, on which it plans to run assessments to consider export controls.
The European Commission outlined four critical technology areas, including AI technology and semiconductor chips, on which it plans to run assessments to consider export controls.
The financial world is abuzz with speculations on the resilience of cryptocurrencies amidst potential global financial upheavals and a looming recession in the United States. XRP, with its unique standing, has become the centerpiece of these discussions, following a series of comments and analyses from renowned crypto analyst Egrag Crypto.
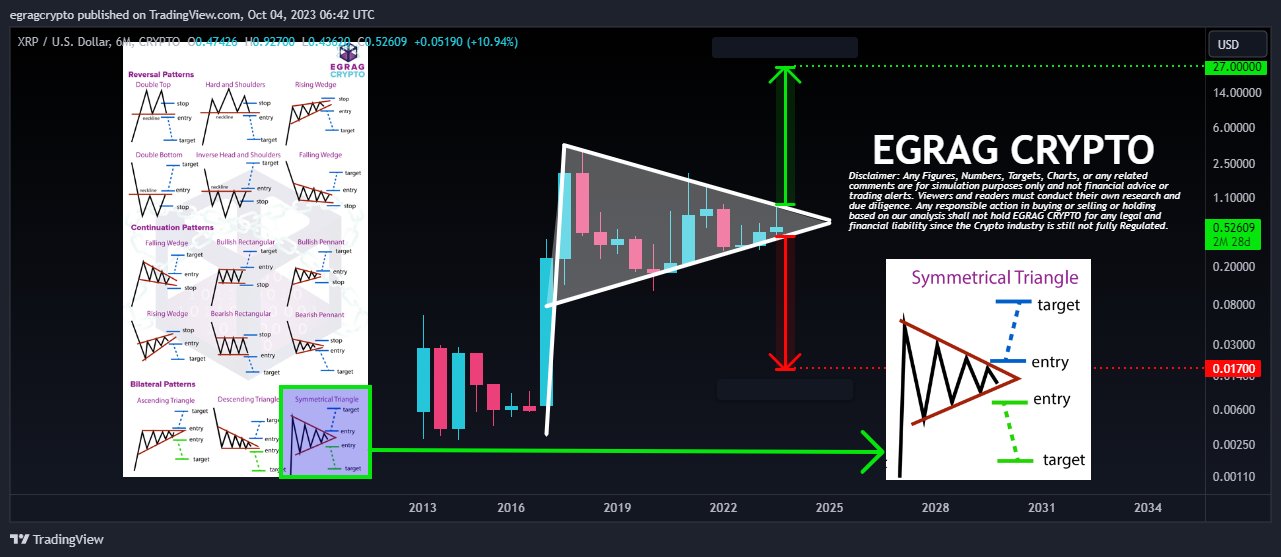
On X (formerly Twitter), Egrag took a comprehensive look at the six-month chart of the XRP price, presenting two scenarios that couldn’t be more different: a crash to $0.017 and a rally to $27.
The analyst emphasized XRP’s pioneering nature due to the remarkable degree of legal clarity it offers, setting it apart from other digital assets. “The current state of XRP offers a remarkable degree of legal clarity, making it a pioneering digital asset in terms of regulatory acknowledgment,” Egrag stated.
This legal acknowledgment, combined with its designed role to simplify cross-border payment solutions, strengthens the case for XRP to potentially rise to a $27 price target, Egrag claims. But his analysis wasn’t purely optimistic. He alerted followers to looming shadows in the broader financial spectrum.
A significant number of technical analysts have forecasted a drastic 40%-50% downturn in global equity and stock markets. Egrag pondered the implications of such a downturn on cryptocurrencies, particularly XRP. He shared the following chart and warned of a potential sharp XRP price crash:
Under such circumstances, a measured move of 0.017c becomes a pertinent consideration. I find myself somewhat perplexed by the dichotomy presented by certain technical analysts who foresee a collapse in traditional markets while advocating for crypto to adhere to its four-year cycle.
He further remarked that “it’s imperative to maintain a consistent and non-contradictory thesis when assessing these scenarios,” highlighting the inconsistency of predicting both a market collapse and a steady crypto four-year cycle.
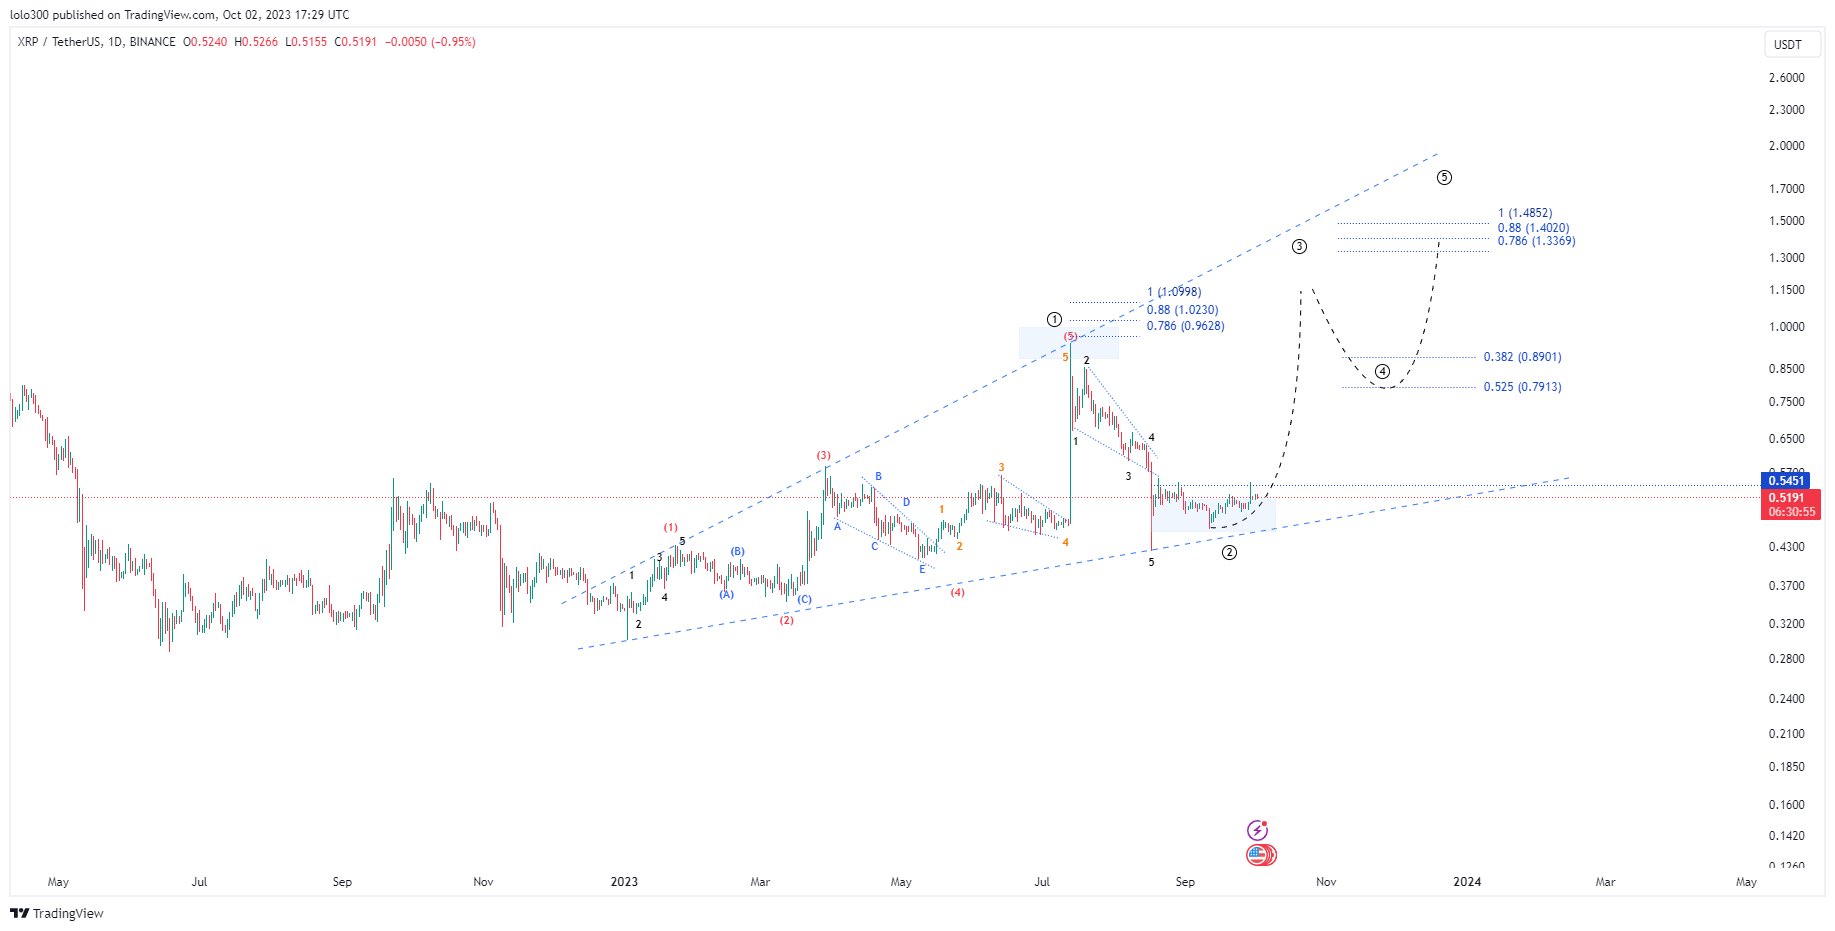
Feedback on Egrag’s analysis was multifaceted. @300Mill300, a prominent voice in the crypto space, extrapolated from Egrag’s initial analysis and offered a chart that was bullish for XRP. He projected a rally to $1.15 by early 2024, followed by a brief retraction to $0.79, and a subsequent bullish surge to reach $1.40 by the close of 2024.
However, the sentiment wasn’t unanimously optimistic. Rainmaker, a crypto aficionado with nearly a decade’s experience, struck a cautionary note. He predicted a pronounced “wash out” preceding each Bitcoin halving event, pushing the XRP price down, possibly to the mid $0.20s.
Responding to this, Egrag showcased his balanced stance. While agreeing with Rainmaker about the potential drag of macroeconomic elements on XRP, he remained bullish about XRP’s intrinsic strengths. He noted, “I think the general macro will drag it down but other than that it is solid like a rock.”
Stepping into the discussion, Analyst Ata Yurt had a different take. He expressed skepticism about XRP achieving the mentioned price points, stating, “At $0.017 there would be no sellers nor buyers… At $27, there will be no buyers either apart from a small group of FOMO orders, majority will FOMO in at $3 or $5 as those are the expected levels considering previous ATH.”
Yurt proposed a more pragmatic approach, suggesting a blend of technical analysis and market psychology. He believes that the $5 mark for XRP is more attainable, urging the community to consider a linear chart for assessment.
Egrag, not one to step back from a discussion, retorted with a thought-provoking question, “Good idea but what if the equity and stock markets crashed 40-50%? Then what?” Yurt countered by estimating the potential fall of Bitcoin in such a scenario, speculating that if Bitcoin were to lag behind and drop by 60%, XRP, in relation to BTC, might settle around the $0.22-$0.25 range, a figure he deemed more realistic than the prediction of Egrag at $0.017.
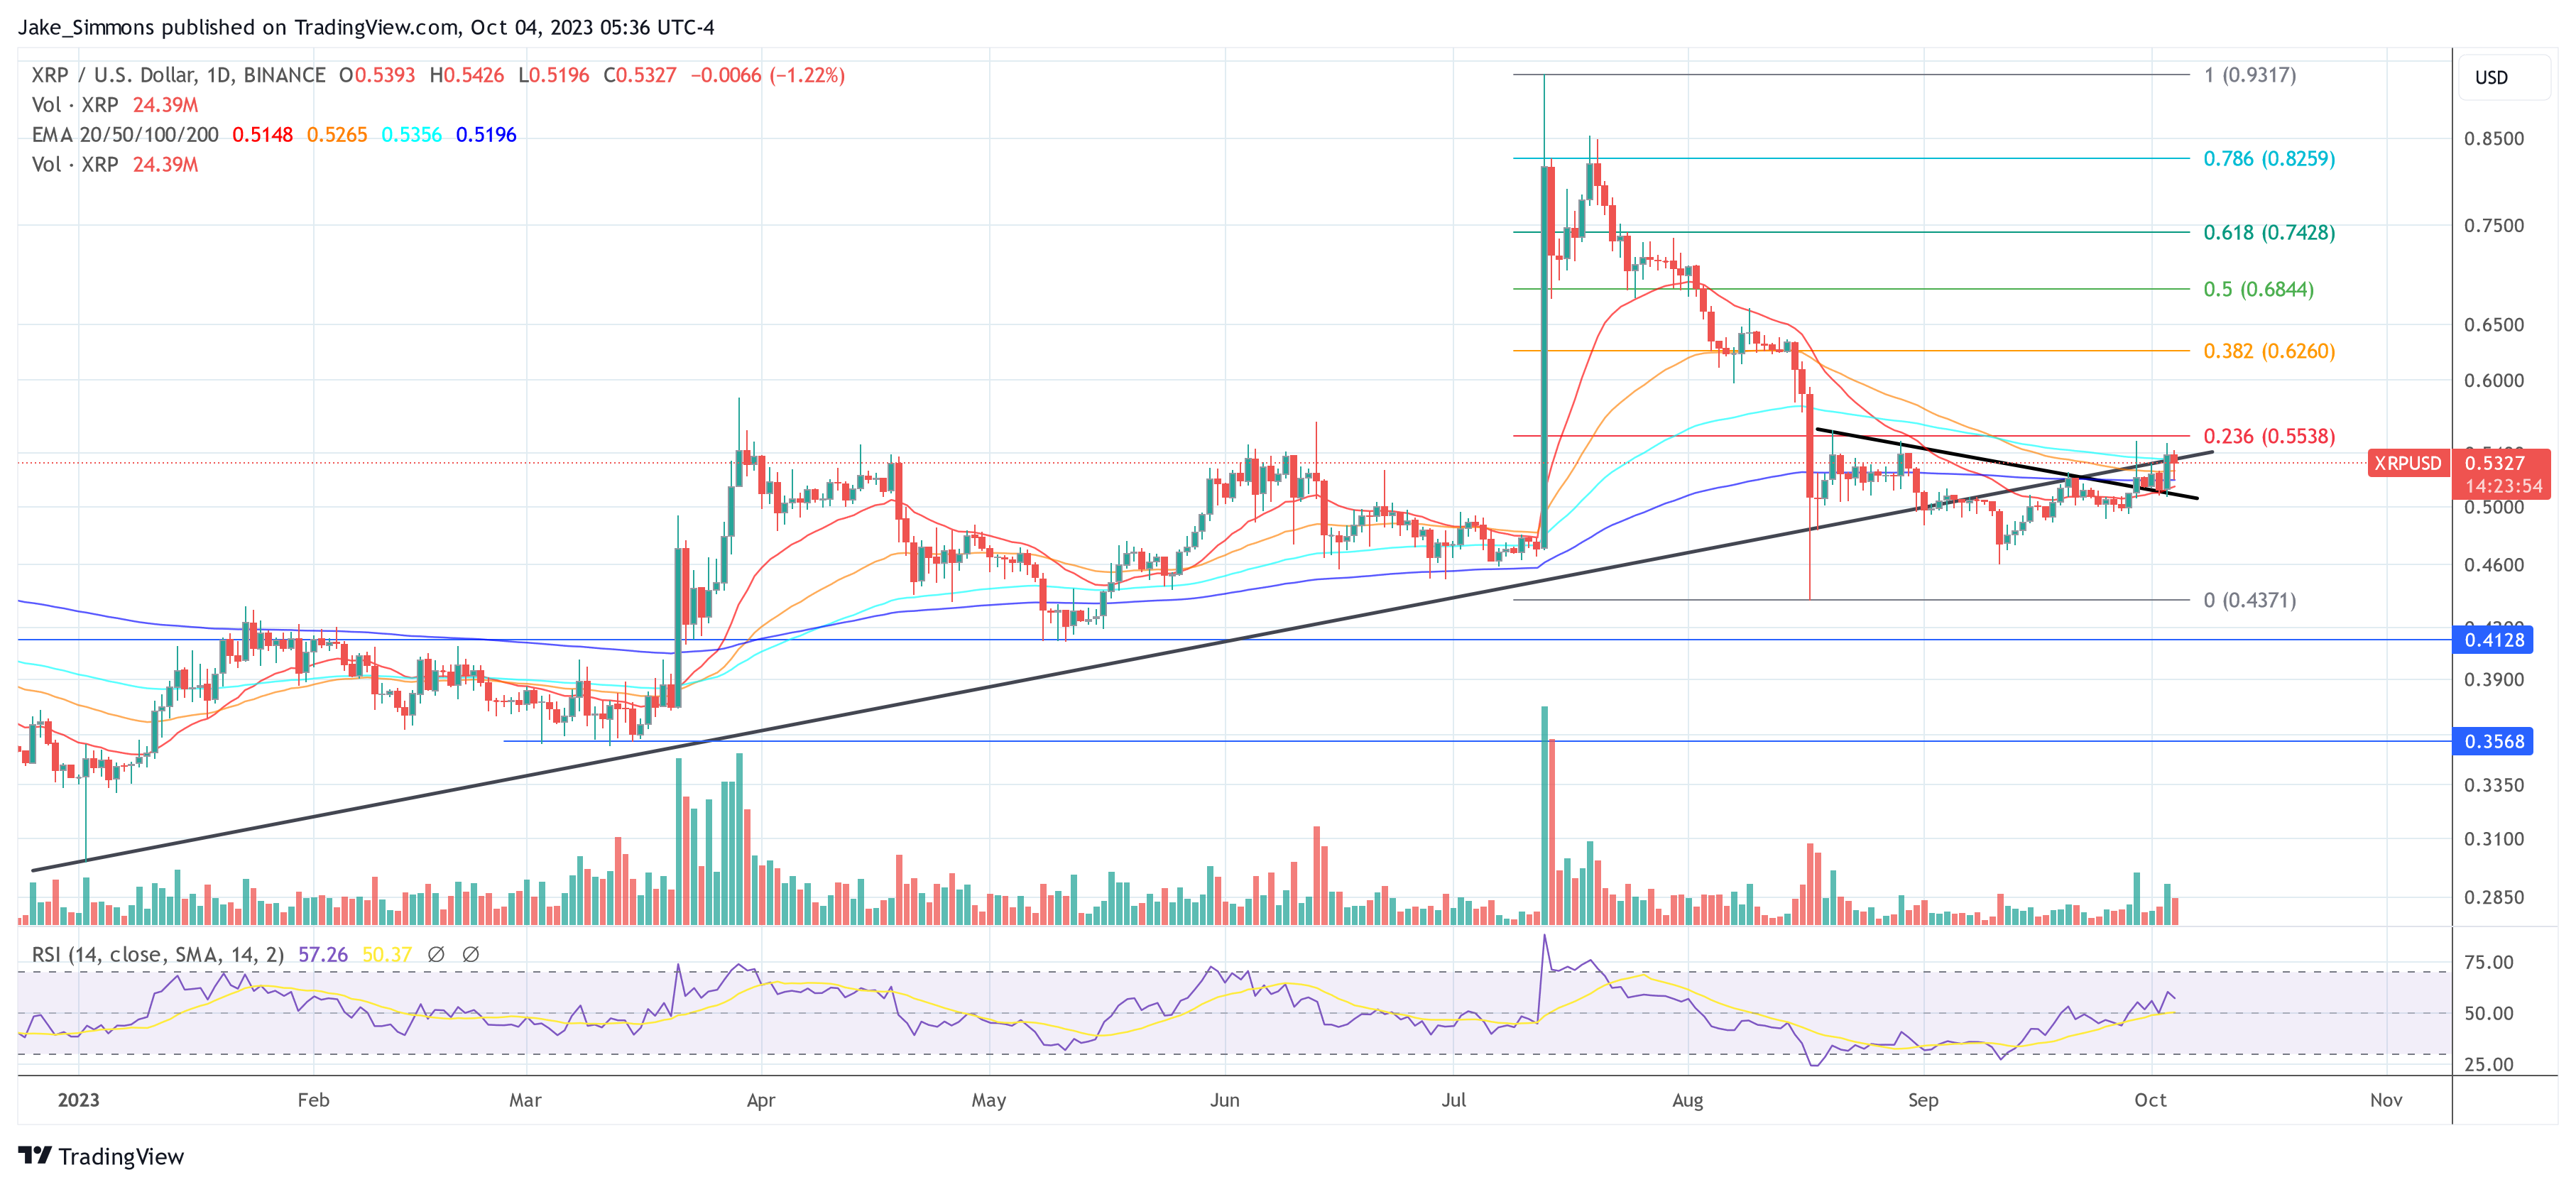
Egrag recently took to social media, highlighting a potential roadmap for XRP’s ambitious journey to $27 through his interpretation of the “XRP ATLAS LINE”.
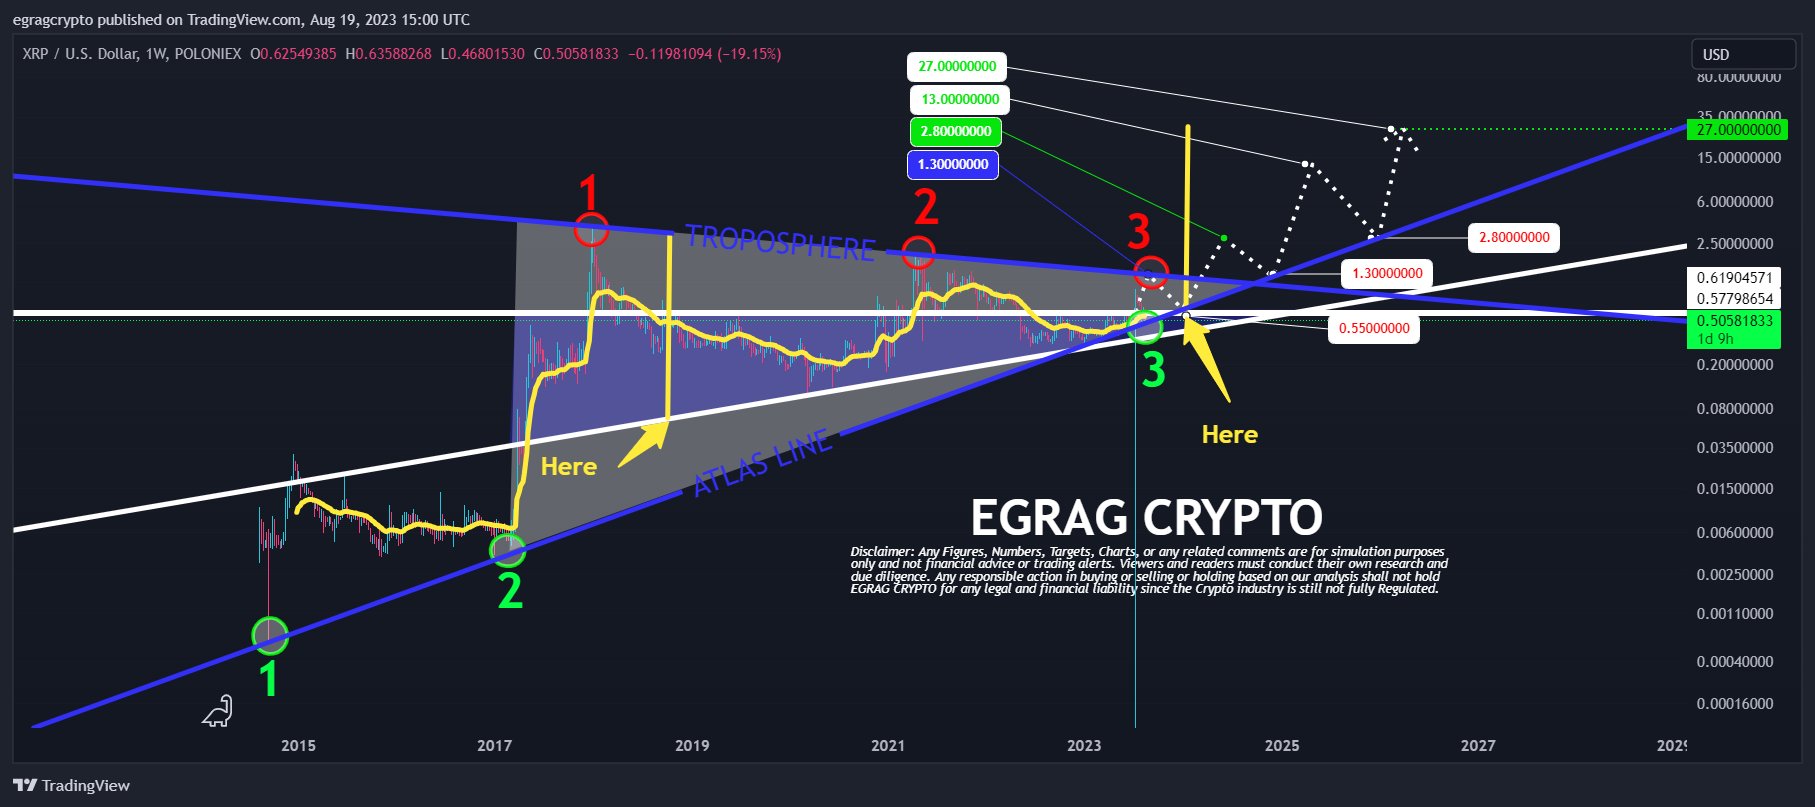
Egrag predicts a near-term positive momentum that could push XRP into the $1.3-$1.5 zone. However, the digital currency might not stay there long, as he anticipates a dip back to the $0.55 region, a crucial breakout retest. Once this phase passes, he sees a dynamic resurgence propelling XRP to its previous highs of $2.8-$3.0.
But that’s not the ceiling. Egrag envisions a more aggressive leap into the $13-$15 bracket, although he also foresees a significant sell-off around this price point. His analysis then steers back to a reconnection with earlier levels around $2.8-$3.0 before finally culminating at the coveted $27 mark.
At press time, XRP traded at $0.5327.

The Bank of International Settlements and a handful of European Central banks are building a system to track international flows of cryptocurrencies.
Sam Bankman-Fried had a grin on his face as he entered court on Tuesday morning – clad in a black suit and an uncharacteristically tame (read: closely trimmed) mop of hair. After nine long months, the disgraced crypto founder will finally have the chance to defend himself against a wide array of federal fraud and conspiracy charges tied to the collapse of FTX, his crypto and futures exchange, and Alameda Research, the crypto trading firm he founded and – according to prosecutors – used to illegally re-invest FTX user funds.
Dogecoin (DOGE), the notoriously popular meme-inspired cryptocurrency, is facing a turbulent period that has left investors and enthusiasts pondering its fate. The central query echoing through the crypto community is a haunting one: Is Dogecoin destined for obscurity?
The decline in Dogecoin’s value can be attributed to a confluence of factors, with the broader cryptocurrency market’s downturn chief among them. This overall slump has eroded confidence in the crypto sphere, and Dogecoin hasn’t been spared from the pessimism.
Over the past year, Dogecoin’s trajectory has been predominantly bearish, marked by occasional minor price surges that were unfortunately insufficient to counter the prevailing bearish sentiment.
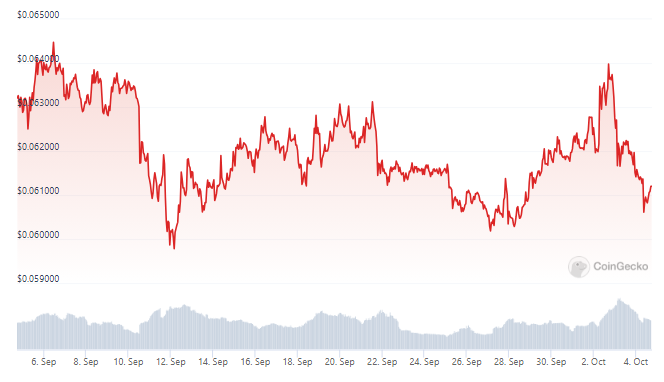
In a sobering turn of events, October witnessed Dogecoin’s price chart painting a bearish engulfing candlestick. This ominous pattern effectively wiped out gains from the previous period, signaling a somber outlook. Currently, DOGE is teetering slightly above the $0.060 horizontal threshold, reflecting the bearish undertones that have gripped the coin’s fortunes.
The CoinGecko listing reports DOGE trading at $0.061033, marking a 1.6% decrease over the last 24 hours, and a modest 0.8% gain over the past seven days.
One indicator that underscores Dogecoin’s troubled waters is the Relative Strength Index (RSI). The RSI is a metric used to gauge the momentum of a cryptocurrency’s price movements. In this context, readings above 50 and an upward trend suggest that bulls hold the upper hand, while readings below 50 indicate the opposite—bearish sentiments are in play.
Unfortunately for Dogecoin enthusiasts, DOGE’s RSI recently faced rejection at the 50 mark and is on a downward trajectory, a telltale sign of a bearish trend in Dogecoin’s price.
It’s worth noting, however, that amidst the gloom, an ascending support trendline in the RSI remains intact. This could hint at a glimmer of hope for Dogecoin, though the road ahead remains uncertain.
Dogecoin’s struggles are not isolated; major cryptocurrencies across the board are grappling with similar challenges. A key concern that has gripped the market is the specter of higher interest rates potentially stalling the housing sector and pushing the global economy toward a recession. This has had a notable impact on the crypto landscape, resulting in a 3% decrease in the global cryptocurrency market capitalization, which currently stands at $1.07 trillion.
Dogecoin’s recent slump has left many questioning its viability and future prospects. While the crypto market as a whole navigates choppy waters, Dogecoin finds itself caught in the undertow of uncertainty. Whether it can rise above these challenges and regain its former glory remains a question that only time will answer.
(This site’s content should not be construed as investment advice. Investing involves risk. When you invest, your capital is subject to risk).
Featured image from

The pilot will include private banks and public institutions, while the Bank for International Settlements (BIS) will provide expert technical support.

Sam Bankman-Fried’s counsel had argued that FTX was not located in the United States, and as SBF did follow regulatory obligations concerning FTX US, charges related to FTX international shouldn’t apply.
At its peak in April 2022, Yield Protocol had over $22 million in total value locked, but this figure has since dwindled to around $2 million.

Bitcoin is witnessing a 16-year high in 30-year U.S. government bond yields, and money printing is all but guaranteed, says the ex-BitMEX CEO.

The first deputy governor at Banque de France calls central bank digital currency “the catalyst for improving cross-border payments.“

COVID-19 pandemic-induced disruptions in traditional finance, coupled with the promise to reduce operational costs set the stage for the mainstreaming of the digital ecosystem.
Low volatility returned to crypto markets after a sudden move higher earlier this week following ETF decisions.

AirBit Club co-founder Dos Santos is now the last AirBit defendant not yet sentenced but is scheduled to learn his fate on Oct. 4, 2023.
Broader crypto markets dropped 0.7% in the past 24 hours, the CoinDesk Market Index (CMI) shows.
The tides finally changed after Gary Wang and Nishad Singh (both FTX directors who have since pled guilty to fraud in the ongoing trial) joined the firm.

Blockchain technology relies on mining algorithms, such as CryptoNight, to regulate cryptocurrency projects. Find out here what CryptoNight is and how it works.
The new data source, which also maps off-chain flows, could underpin future crypto regulations, according to the German-Dutch central bank project.

His Majesty’s Treasury’s Digital Securities Sandbox will have “a new rule set that would allow it to do new things with digital securities.”
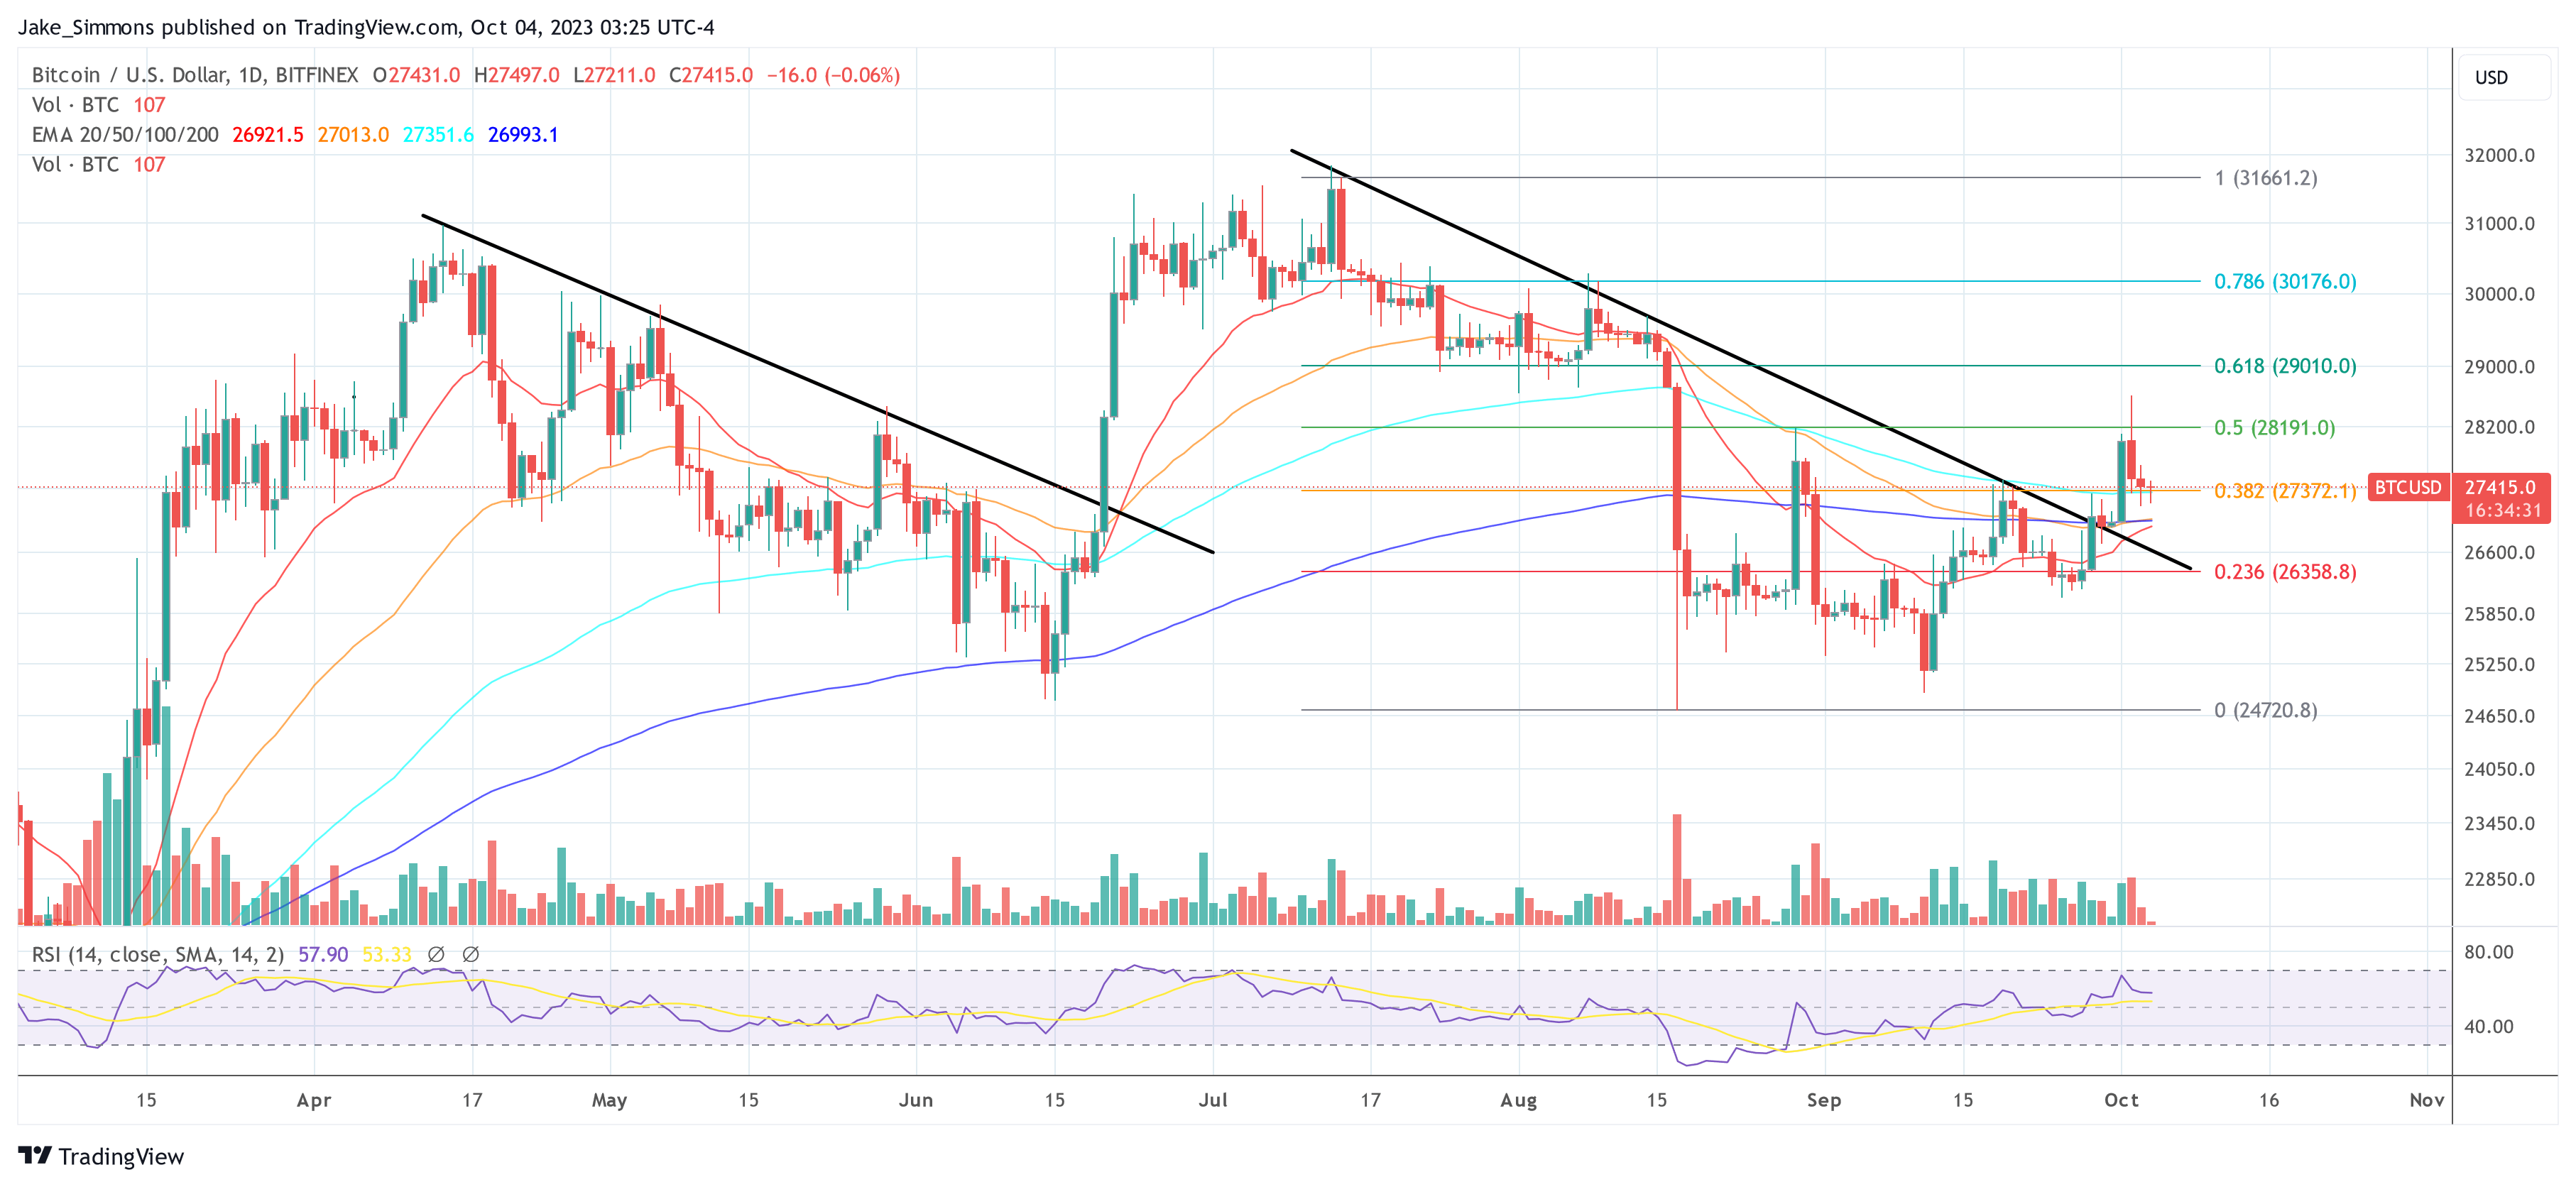
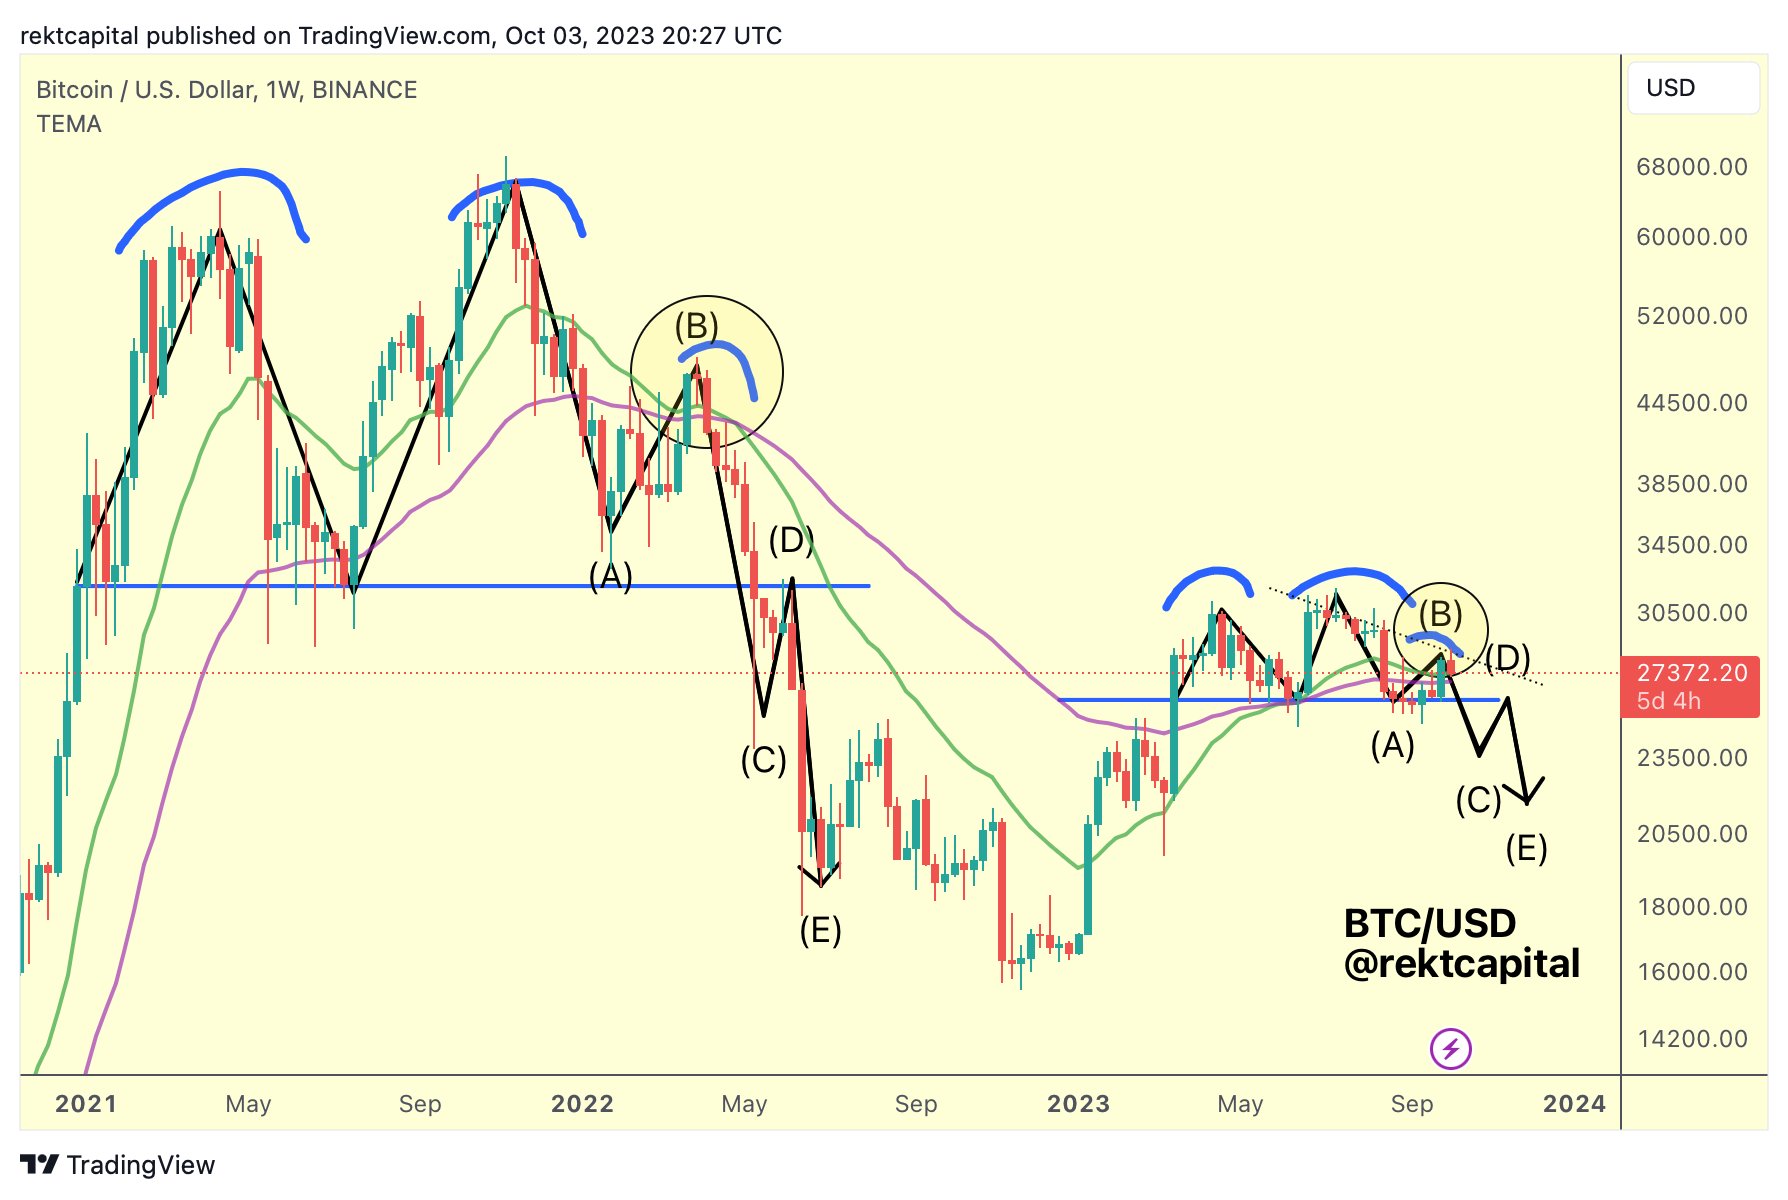
A detailed analysis by well-regarded crypto analyst Rekt Capital has spotlighted a recurring bearish fractal in the historical price data of Bitcoin, raising prospects of a potential crash below the $20,000 mark. Notoriously seen in 2019 and 2022, this pattern seems to be reemerging in the current 2023 market.
For those unfamiliar, the fractal indicator identifies potential turning points on a price chart by highlighting repetitive price patterns. In simple terms, a bearish fractal suggests a potential decline in price. Such a pattern materializes when there’s a peak price with two consecutively lower high bars/candles on its flanks. An up arrow typically marks a bearish fractal, indicating the potential for price descent.
The essence of this bearish pattern begins with a double top. Contrary to expectations, this double top doesn’t validate with a dip below a significant support level. Instead, the price typically sees a relief rally, forming a lower high, only to crash below the previously mentioned support.
This support then morphs into a new resistance level, driving the price further down. This sequence was observed in both 2019 and 2022, and the current market scenario in 2023 mirrors the initial stages of this pattern. Rekt Capital suggests that the market is potentially in the middle of this bearish fractal, with uncertainty around where the relief rally might conclude.
From the beginning of April to the end of August, BTC formed a double-top pattern in the weekly chart. However, the Bitcoin price held above the neckline at around $26,000. Then, in mid-August, BTC started its relief rally which took the price up to $28,600. “We’re probably in the A to B [phase of the] bearish fractal,” the analyst added.
Diving deeper into potential scenarios, the analyst believes Bitcoin’s price could rally up to approximately $29,000 before experiencing further declines. Some key events to watch for include potential overextensions beyond the bull market support band. If Bitcoin fails to retest and maintain this band as support after breaking out, the bearish fractal remains valid.
Another important point to monitor is the revisit of the lower high resistance. Even if the price wicks beyond this resistance, a subsequent rejection would keep the bearish outlook intact. There are, however, criteria that could invalidate this bearish perspective: the bull market support band (blue) consistently holds as support, a weekly close beyond the lower high resistance ($28,000), and breaking past the $31,000 yearly highs.
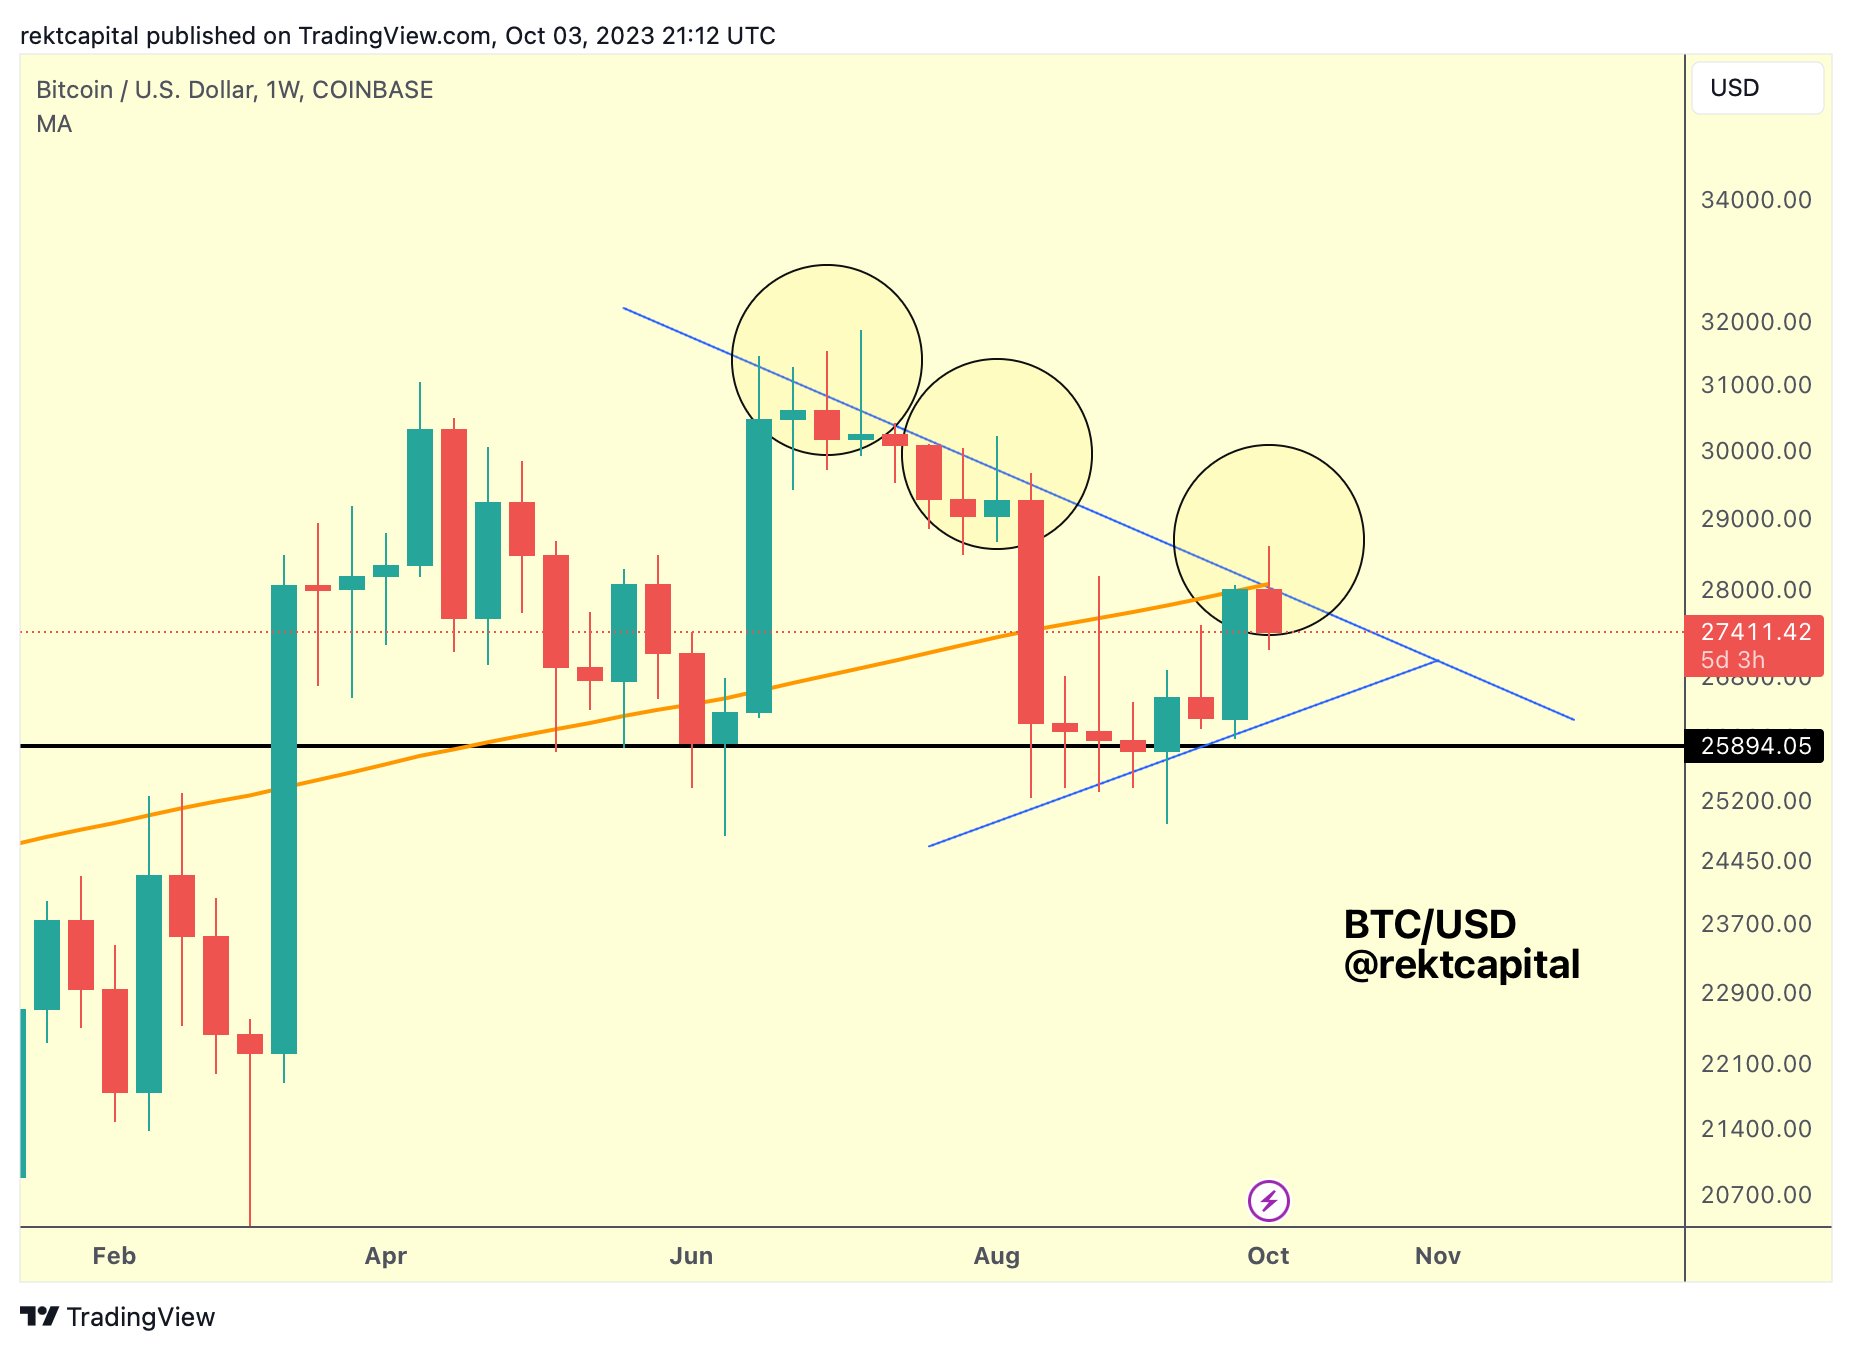
On the topic of other technical indicators, Rekt Capital highlighted that Bitcoin has recently rallied to the 200-week MA. This moving average (MA), however, seems to be acting as a current resistance. Additionally, the 200-week MA aligns with the lower high resistance, presenting a crucial juncture for Bitcoin’s price in the near future. Despite his macro bullish stance on Bitcoin, Rekt Capital cautions that Bitcoin has yet to overcome the $28,000 lower high resistance in the 1-week chart.
On the daily chart, Bitcoin is hovering slightly above the 38.2% Fibonacci retracement mark. For Bitcoin to avoid a descent beneath the established trend line (represented in black), it’s crucial for it to maintain a position above $27,372.