The license allows GSR to provide crypto and fiat-related services to Singaporean residents and entities.
Cryptocurrency Financial News
The license allows GSR to provide crypto and fiat-related services to Singaporean residents and entities.

Bitcoin and select altcoins are looking strong at the start of October, but will the flashpan bullish momentum last?
On-chain data shows the Bitcoin Miners’ Position Index (MPI) has formed a death cross recently, a sign that the asset’s rally may end.
As pointed out by an analyst in a CryptoQuant Quicktake post, the 365-day moving average (MA) of the BTC MPI has crossed above the 90-day recently. The “MPI” here refers to an indicator that measures the ratio between the miner outflows and the yearly MA.
The “miner outflows” are the amounts these chain validators transfer out of their combined wallets. Generally, the miners take out their coins for selling purposes, so the miners outflows can measure how much dumping they are currently partaking in.
Miner outflows are usually not that unusual, though, as this cohort has to constantly sell what they mine to pay off their running costs like electricity bills. What can be notable, however, is whether their selling deviates from the norm.
The MPI provides us with information about precisely this since it compares the outflows against their 365-day MA. When the metric is greater than 0, the miners are selling more than the average for the past year, while negative values imply the opposite.
Now, here is a chart that shows the trend in the 90-day and 365-day MAs of the Bitcoin MPI over the last few years:

The above graph shows that the 90-day MA Bitcoin MPI (colored in orange) has declined during the last few weeks. Recently, the metric crossed below the 365-day MA, consolidating sideways.
Historically, the crosses of the two MAs of the BTC MPI have appeared to be significant for the cryptocurrency’s price. In the chart, the quant has highlighted the major crossovers that occurred during the last few years.
Whenever the indicator’s 90-day MA has observed a cross above the 365-day MA, BTC has gone off to witness some bullish momentum. Such a cross preceded the April 2019 rally, the 2021 bull run, and the rally that started this January.
On the other hand, the opposite type of cross has proven to be bearish for the asset’s value, as steep declines have followed it. Since this death cross has once again formed for Bitcoin recently, it may signal that this year’s rally has reached its conclusion.
However, the crossover is still in the process of forming, meaning that the coming weeks may be important. If the 90-day MA can turn itself around quickly, then the death cross may not form, but if the metrics continue in their current trajectory, the bearish signal would be solidified.
Regardless of the death cross, Bitcoin has observed some sharp bullish momentum during the past 24 hours, as the asset has surged to the $28,300 level.
Several of Bankman-Fried’s former colleagues and friends will testify against the one-time crypto mogul following plea deals they struck with the U.S. Department of Justice, including his former romantic partner Caroline Ellison and childhood friend Gary Wang, who were both deeply involved in the daily workings of both FTX and its quant-driven trading shop, Alameda Research. Another two individuals, who prosecutors have yet to publicly name, may testify if granted immunity, suggesting they may also be tied to the exchange. The DOJ also announced over the weekend that prosecutors intend to call former FTX customers from around the world and investors as witnesses during the trial.

According to the scientists, there’s no universal method by which data can be deleted from a pretrained large language model.
Over a billion dollars in liquidations sent the XRP price and the crypto market back from the dead and into local highs. However, new data suggests the rally might be short, pushing down the nascent sector into critical support.
As of this writing, the XRP price trades at $0.5 with a 4% profit in the last week. The cryptocurrency rallied in the previous 24 hours but has been retracing its steps over the past few hours, hinting at potential losses unless buyers step in and defend these levels.
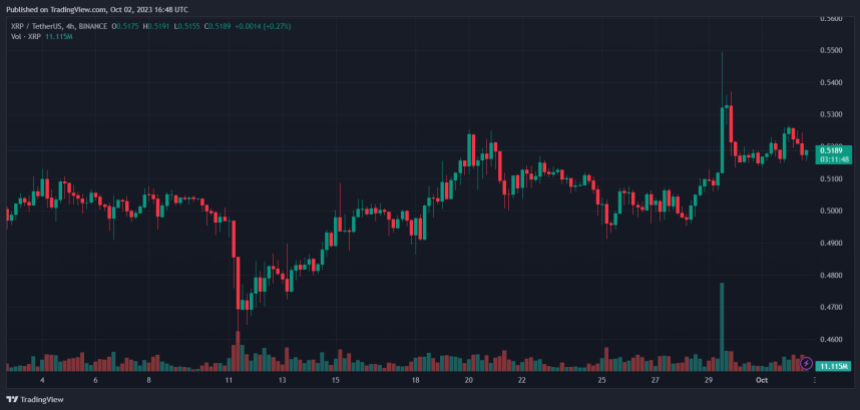
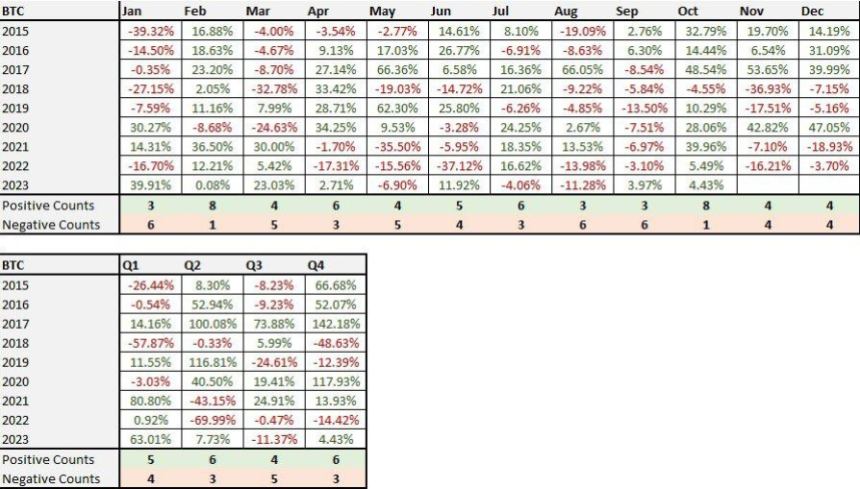
According to the trading desk QCP Capital, the current rally in the crypto market coincides with seasonality. In the nascent sector, October is known as “Uptober” because major cryptocurrencies, including the XRP price, trend to the upside.
In the past years, every Bitcoin, Ethereum, and XRP price rally began in October, making it the best month for the market, as seen in the chart below. However, the trading desk warned its followers on social media X about a potential reverse that could have negative effects on cryptocurrencies:
However, we are not fully convinced by this move, and we think that BTC might test super key 25k support sometime in the final quarter of 2023 (…) This aggressive bounce has been due almost entirely to exogenous factors thus far and might not have the momentum to sustain.
The trading desk believes these factors may lack the power to sustain the current price action. In addition, the narrative around approving an Ethereum future Exchange Traded Fund (ETF) in the US could set the stage for a bloodbath.
Two years ago, when the price of Bitcoin reached its all-time high of $69,000, the Securities and Exchange Commission (SEC) approved a BTC futures ETF. This event marked the crypto market’s top, making the current ETH future ETF an ominous event for XRP and the altcoin market.
QCP Capital claims that the newly approved financial asset could increase selling pressure in the sector due to adding “synthetic coins” to the market. In other words, the ETH futures ETF creates a disbalance between the supply and demand forces in the sector. The firm added:
We would even go further to say a futures-only ETF is arguably detrimental to spot price – as it potentially directs demand away from the spot market into a synthetic market.
The XRP price could benefit from the US government shutdown in the macro arena. The analysis shows that in the past 30 years, each US government shutdown preceded a bull run for the financial market. This is the only positive news for the cryptocurrency in the medium term.
In the short term, XRP still has a chance to run back above $0.6; as for Bitcoin, the trading firm expects the $29,000 to $30,000 resistance to remain intact.
Cover image from Unsplash, chart from QCP Capital and Tradingview
The sentiment around the XRP price has been mostly bullish lately with numerous predictions coming through for a potential rally. However, not everyone has joined the bull bandwagon after being disappointed by the XRP price performance. One analyst in particular has expressed its displeasure at XRP’s performance over the years, and as a result of this, the analyst wants to abandon the token.
One analyst who goes by CryptoCheck on the TradingView platform has put forward reasons for why he is no longer bullish on the XRP price. The analysis shows how XRP has underperformed the rest of the crypto market over the years, leading to the belief that the value of the token has weakened.
CryptoCheck points to the fact that XRP has been unable to reclaim its first and only all-time high even though Bitcoin and a lot of altcoins have been able to do the multiple times. The crypto trader refers to this price performance as unusual when compared to other assets in the industry.
The analyst laments the inability of XRP to put on the same kind of performance as other coins over the years despite its value proposition as being a cryptocurrency for institutions. “Other coins have long surpassed their ATH’s. But XRP made one high, and never again. This speaks of weakness in terms of value. And that can no longer be ignored,” the analyst writes.
Furthermore, CryptoCheck compares the token to the likes of Dogecoin (DOGE) which is widely known for having no value and being a meme coin. Nevertheless, DOGE has hit multiple all-time highs while the XRP price continues to lag behind. “The truth is, if I bought as much DOGE as I did XRP, my portfolio would have been up x100 compared to now,” CryptoCheck adds.
The culmination of CryptoCheck’s analysis comes from the fact that he will no longer be buying the token. According to the crypto trader, he had been religiously buying XRP due to his strong belief and ideology about the value proposition of the token. However, the XRP price performance has been nothing to write home about.
The analyst attributes this to low trading volume for the token and investors not being interested in buying the token. Also, CryptoCheck points to what he referred to as a “Pump and Dump” price action which has led to XRP constantly forming “weak support zones and strong resistance zones.”
Additionally, he explains that the rising unpopularity of XRP translates to weak confidence. As such, investors who are already holding the tokens are looking for a good opportunity to sell and exit, especially short-term traders.
As for the analyst, he explained that the next course of action was to sell. “I have decided I will no longer accumulate. Instead, as soon as the price reaches higher than what I bought for, I will be looking to sell my bags,” he revealed.
East Asia represents almost 8.8% of all transactions globally, a report from the research firm says.

The committee’s recommendations included having the Kenyan government consider implementing a comprehensive framework for digital assets and virtual asset service providers.
With the rules set to take effect Oct. 8, officials at the Financial Conduct Authority have a plan to tackle non-compliant firms, CoinDesk was told.

No specific timeline was given as to when users can receive their money back.
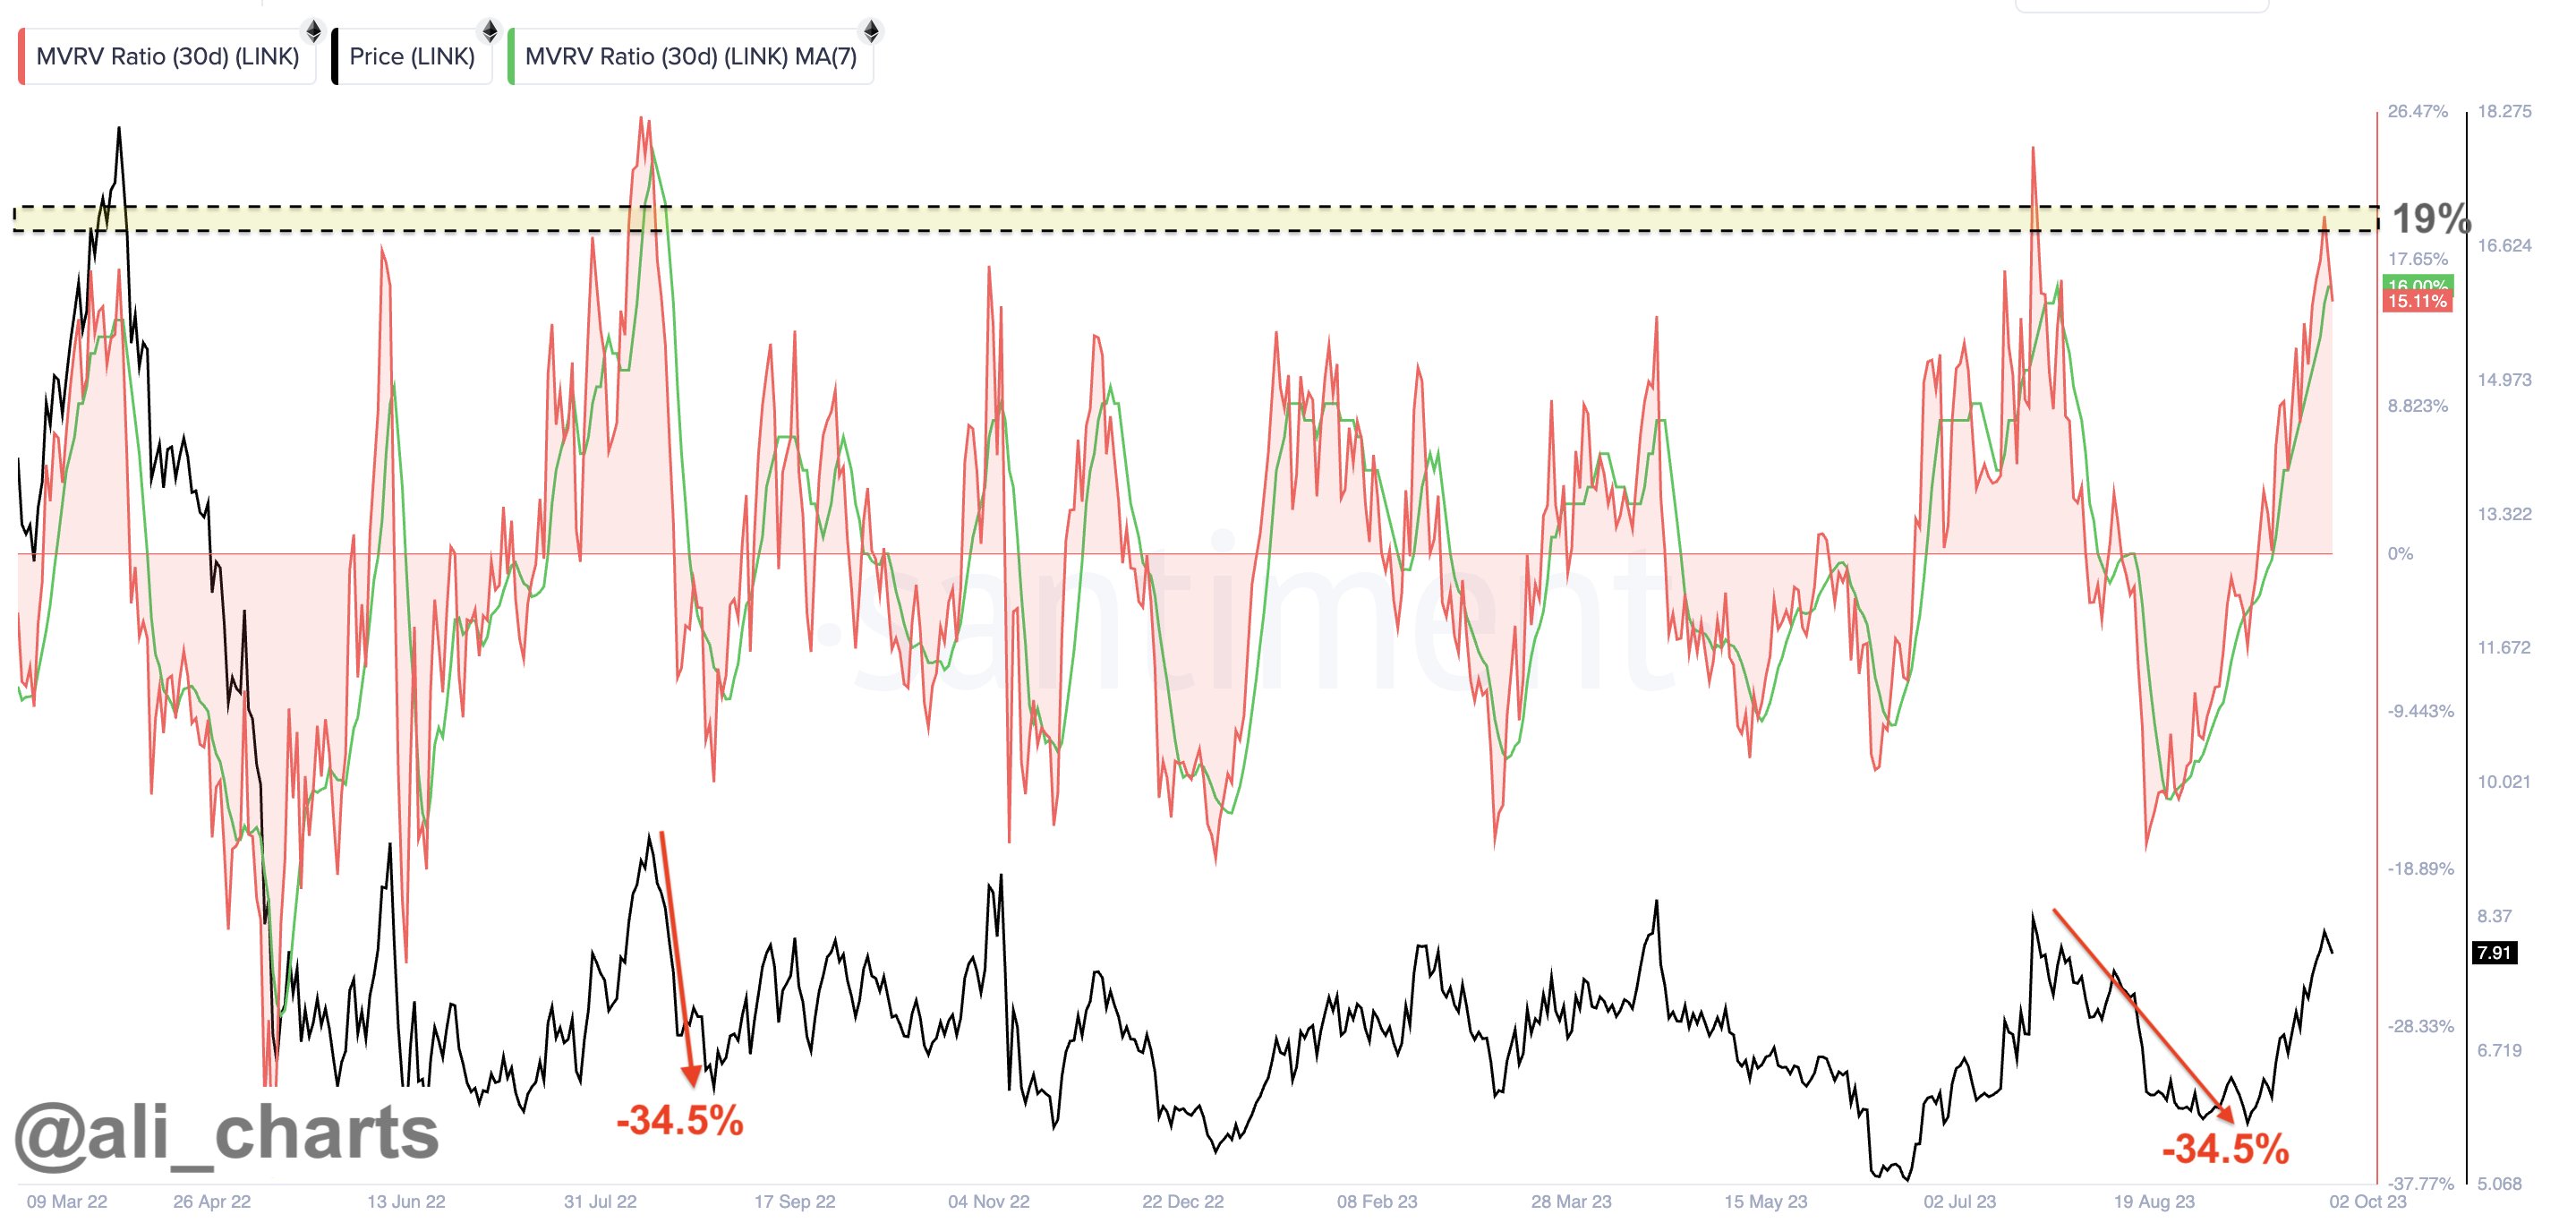
An on-chain signal that preceded crashes of at least 34% for Chainlink in the past has once again formed for the cryptocurrency.
As explained by an analyst in a post on X, the last two times the 30-day MVRV ratio broke above the 19% level, the price of LINK registered a sharp decline. The “Market Value to Realized Value (MVRV) ratio” is an indicator that measures the ratio between the Chainlink market cap and the realized cap.
The “realized cap” here refers to the total amount of capital that holders of the cryptocurrency have invested into it. As the MVRV ratio compares the spot valuation (the market cap) with the amount that the investors bought the asset with, its value can provide hints about whether the holders as a whole are in profits or not.
When the metric has a value greater than 1, it means that the market cap is more than the realized cap, and hence, the average investor is in profit right now. The more the holders get into profit, however, the more likely they become to sell, so high values of the MVRV ratio can suggest the asset is becoming overpriced and a correction may be due.
On the other hand, values under the threshold suggest the cryptocurrency may be undervalued currently as the overall market is holding some net unrealized losses.
Now, here is a chart that shows the trend in the 30-day version of the Chainlink MVRV ratio, which looks at the profitability of only the investors who bought within the past month:
In the above graph, the value of the 30-day MVRV ratio is represented as a percentage relative to the break-even level. As is visible, this indicator has observed some sharp uptrend recently as Chainlink has enjoyed its rally.
During this latest rapid growth, the metric had managed to hit a peak of 20%, which means that the market cap had become 20% more than the realized cap of the 30-day investors.
The analyst has pointed out an interesting trend that LINK has followed during the past couple of years. It would appear that whenever the 30-day MVRV ratio has broken above the 19% mark, the cryptocurrency has followed up with a steep drawdown.
This has happened two times in the period of the chart and coincidentally, Chainlink’s decline was about 34.5% in both of these instances (although the time the drawdown was spread out over was different in the two cases).
Since the 30-day MVRV has once again surged above this apparently significant level, it’s possible that LINK may also register a similar drop in the coming days or weeks.
Chainlink has observed some sharp uptrend over the past month, as its price is currently trading just under the $8 level, having gone up almost 34% in the period. If the MVRV ratio is anything to go by, though, this impressive run may finally be coming to an end.

Two transactions showed lump sums of $50 million in USDT transferred from Bitfinex to the Tether treasury only a few minutes apart.
Optimism (OP) has posted notable gains today, October 2, trading at $1.45, with a 5% increase in the last 24 hours. Furthermore, its price has gained 15% in the last seven days.
OP’s rise coincides with the improvement in the general crypto market, which showed a remarkable recovery. However, whether OP will sustain the ongoing rally remains to be seen. But a close look at a few technical indicators may provide vital insights into its next price moves.
OP continues to show positive price momentum as buyers dominate the market. Also, it has formed a fifth consecutive candle on the daily chart, confirming active accumulation by traders. Its rally became prominent on September 29, when it broke above the Donchian Channel (DC) median band.
OP flipped the $1.41 resistance level to support today and edges closer to the upper band of the Donchian Channel towards the $2.50 resistance level. If the buyers sustain the rally above the $1.50 resistance, OP will likely move into the overbought zone.
Additionally, the Moving Average Convergence/Divergence (MACD) has risen above its signal line, displaying a strong buy signal. Also, the Histogram bars are green, confirming that the buyers are still active. More so, the Relative Strength Index (RSI) indicator displays a value of 64.2 and is rising to the overbought region of 70.
Based on these indicators, OP will likely enter the overbought zone in the coming days, implying that accumulation will continue. However, traders should look out for bearish resistance at the $1.50 level that could serve as a potential entry point for sellers.
Besides the general recovery in the crypto market, Optimism records exciting developments in its ecosystem. One notable change is a September 29, 2023, proposal to change Optimism’s security model.
According to the proposal, the OP team aims to hand over the admin key for the OP Mainnet to public and decentralized participants. These participants will be the Security Council held accountable for Optimism’s Governance.
Although this proposal awaits approval, it creates engagement in the OP ecosystem, thus increasing investor interest and activity. And this increased activity exerts higher buy pressure on the token.
Furthermore, the Optimism Superchain is another innovation driving ecosystem growth. According to blockchain data provider Covalent, the Superchain is an interlinked blockchain network of individual chains tagged “OP chains.”
Interestingly, builders can use the Superchain to engage in on-chain development. However, they must comply with the Law of Chains, a set of community rules on how teams support public goods and decentralization.
The OP Mainnet is the first member of the Superchain. Again, it has recorded increased daily active addresses, higher than Arbitrum, which is declining in on-chain activity.
BuildOnBase, created by Coinbase, is the second member of the Superchain, aiming to attract billions of users. BuildOnBase ranked as one of the best-performing chains in 2023 and the fastest L2 to reach 100,000 users in 56 days.
These developments are likely driving the growth in the Optimism ecosystem, evident in its recent price surge.

Bitcoin preserves its snap October gains, but BTC price analysis reveals reasons for staying level-headed on the future.
The company launched Chainlink Data Streams and announced new decentralized computing capabilities.

Following the U.S. SEC’s approval of spot Ethereum exchange-traded funds, VanEck has launched its Ethereum Strategy ETF.
Chia Network cut a third of its workforce today as the blockchain platform sought to reestablish a lost banking relationship, the company told CoinDesk, further delaying what Chia had hoped would be a rapid path to listing as a public company.

Bitfarms, one of the largest Bitcoin miners in the world, believes that many of its best growth opportunities will arise from the upcoming BTC halving.
The latest in blockchain tech upgrades, funding announcements and deals. For the week of Oct. 2-8, with live updates throughout.