Ethereum ICO Participant Moves $9.96 Million Of ETH To Kraken. Will He Sell?

An Ethereum initial coin offering (ICO) participant and one of the earliest supporters of the smart contract platform has moved 6,000 ETH worth $9.96 million to Kraken, a cryptocurrency exchange, recent data from Lookonchain on September 18 reveals.

The unidentified whale received 254,908 ETH when each traded for 40.31 during the crowdfunding in 2014. This amount is currently worth over $466 million at spot rates.

ETH whale transfer: Etherscan

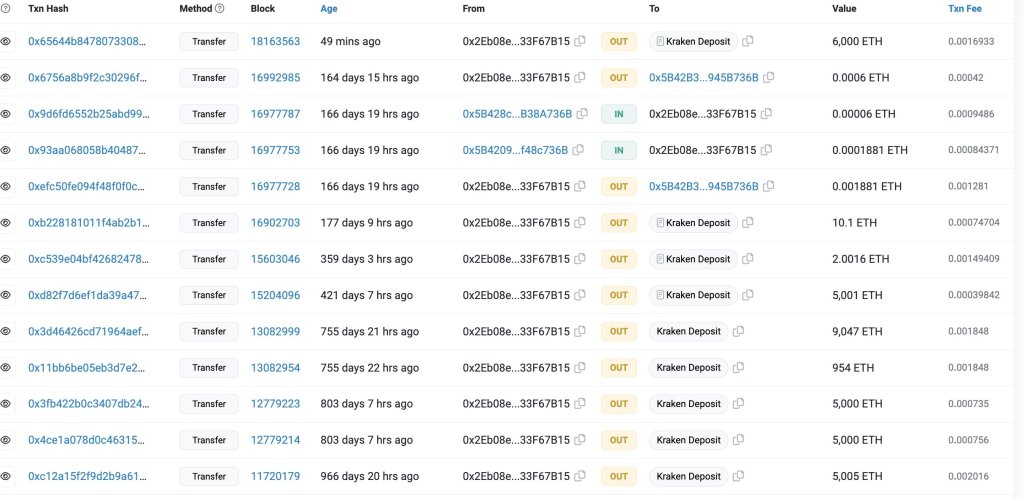
Ethereum Whale Transfers Over $9.96 Million To Kraken

The anonymous nature of public blockchains, including Ethereum, makes it harder to decipher the owner’s identity. Determining whether an entity or an individual controls the address is also more complex. 

Whale transfers to a crypto exchange are usually considered bearish since the ramp provides an easier swapping option for token holders to cash out. Typically, crypto whales have the potential to impact the market due to the sheer size of their holdings.

Accordingly, their trading decisions can influence prices, increasing volatility. Therefore, the recent deposit to Kraken may suggest that the whale plans to sell, taking a profit.

On the brighter side, the whale could be moving their coins via an intermediary, in this case, Kraken, before transferring them to other platforms like Rocket Pool or Lido Finance for staking. 

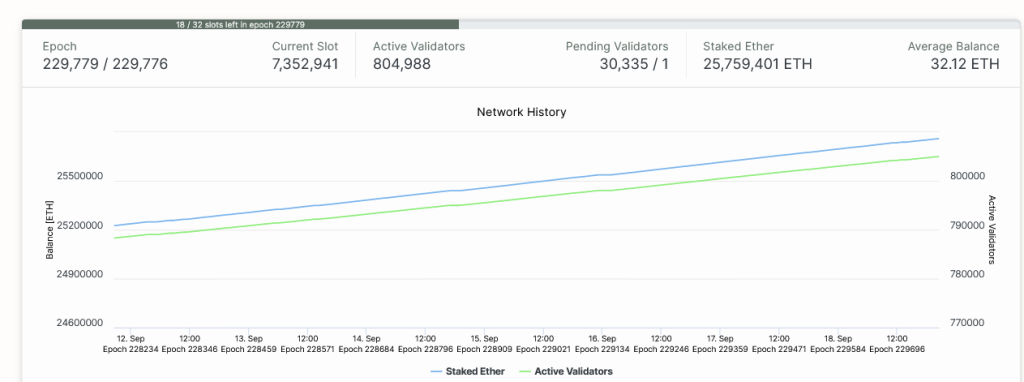
In the current proof-of-stake consensus algorithm used by Ethereum, whales can earn annual staking rewards if they lock at least 32 ETH. While the whale can set up a node and stake, liquidity staking providers like Rocket Pool allow users to stake coins and earn staking rewards using their infrastructure. 

As of September 18, there are over 804,000 validators, that is, users who have locked at least 32 ETH operating an Ethereum full node. Cumulatively, over 25.7 million ETH have been locked.

Validator count:Beacon.in

ETH Prices Recovering

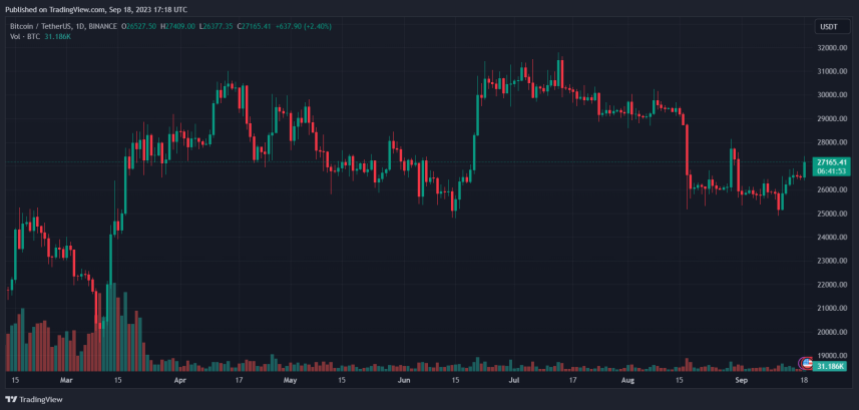
As of this writing, the transfer on September 18 is amid the broader recovery in the crypto market. Of note, Ethereum (ETH) prices are up roughly 6% from September lows. Overall, supporters are bullish, expecting more growth in the days ahead.

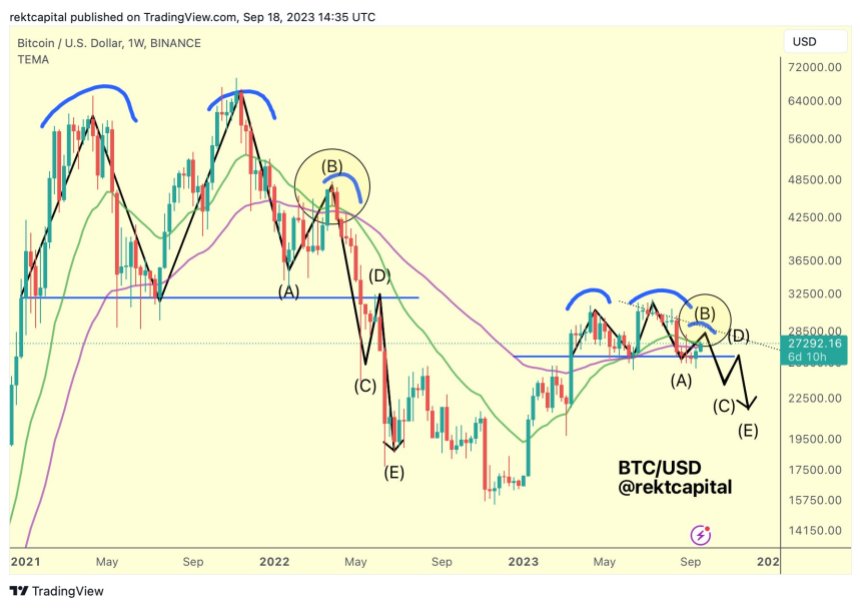
The pump also means bulls have reversed some of the losses of September 11, and the current formation may anchor the next leg up that could propel the coin above $1,750, or August 29 highs, and later peel back sharp losses recorded on August 17. 

Ethereum price on September 18| Source: ETHUSDT On Binance, TradingView

From the candlestick arrangement in the daily chart, ETH remains under pressure, dropping 23% from 2023 highs of around $2,140.

However, since bears didn’t reverse losses of the June to July leg up, buyers have a chance following the rejection of lower lows from around the 78.6% Fibonacci retracement level of the Q3 2023 trade range. Presently, the September and August 2023 lows remain critical support levels for ETH, with the retest of August 17 lows on September 11 causing concern for optimistic traders. 

Crypto Fund Flows: Millions Exit Bitcoin, But These Three Coins Hold Their Ground

Last week marked a significant trend as crypto funds, including those holding Bitcoin, faced significant outflows, amplifying investor concerns. While the market’s momentum has wavered for several crypto, a few resilient assets stood firm.

Digital asset investment products witnessed a decline for the fifth straight week. Last week alone saw outflows amounting to $53.5 million, accumulating to nearly half a billion in aggregate outflows over the past nine weeks.

Market Leaders – Bitcoin And Ethereum Feel The Brunt

Bitcoin (BTC), often dubbed the “king of cryptocurrency,” bore the brunt of these outflows. Roughly 85% of the outflows stemmed from Bitcoin funds, translating to a decrease of $45 million last week.

This happened amid Bitcoin’s grappling to recoup some of its prior losses. The cryptocurrency rose from a little over $25,000 at the start of last Monday to end the week above $26,000 by Saturday. As of this writing, Bitcoin is trading at $27,117, marking an 8.3% increase over the past 7 days

Bitcoin (BTC) price chart on TradingView

Furthermore, the outflow scenario wasn’t particularly rosy for Ethereum (ETH) either. Despite its traditionally appealing investment fundamentals, according to the report, and a booming demand for its staking yield, ETH also, saw outflows to $4.8 million. Other notable assets like BNB and MATIC also experienced minor outflows.

Crypto market weekly fund flows.

As James Butterfill, the head of research at asset manager CoinShares, highlighted in their recent report, the last two months have been especially challenging, with eight out of the previous nine weeks reporting outflows.

Yet, according to the report, the U.S. seemed to be the primary catalyst behind this negative sentiment, accounting for 77% of the outflows. Other regions, such as Germany, Canada, and Sweden, weren’t immune, registering significant outflows over the last week.

Year-to-date net inflows have plummeted to a meager $51 million post this outflow spree, a startling revelation given the optimistic start to 2023.

Solana, Cardano, And XRP: The Silver Lining

Solana, Cardano, and XRP emerged as beacons of hope in this seemingly gloomy backdrop. Unlike their counterparts, these assets saw inflows: Solana led the pack with $700,000, followed by Cardano and XRP with inflows of $400,000 and $100,000, respectively.

Their performance offers a glimmer of optimism in an otherwise challenging digital asset market, indicating that pockets of resilience and investor confidence remain.

Additionally, trading volume surged by a significant 42% on the brighter side, rising from the previous week’s $754 million to $1 billion.

While blockchain equities, too, felt the sting with their sixth consecutive week of outflows, the increased trading volume indicates the active participation and engagement of traders in the crypto sphere.

Notably, Solana and Cardano have seen more profits than XRP in the past 24 hours, with the former up by 5.5% and the latter by 2.8%; XRP has only recorded a mere 1% profit over the same period.

Featured image from iStock, Chart from TradingView

Incoming Milestone Could Be Very Bullish For XRP Price, Here’s Why

Since Judge Analisa Torres’s ruling back in July that programmatic XRP sales do not qualify as securities, the token has been on an upward trajectory in terms of growth. This time around, the XRP Ledger is close to another enormous milestone, which could spell good news for the XRP price going forward.

Accounts On XRP Ledger Near 5 Million Mark

In an interesting turn of events, the number of accounts that are present on the XRP Ledger has been rising rapidly. This has seen the metric barrel toward the 5 million total accounts milestone as it is currently sitting at an impressive 4,781,844 million accounts, according to data from XPR Ledger Services.

The site’s data also shows other impressive metrics about the blockchain such as only 1,116 accounts on the Ledger are carrying a 0 balance. This means that only 0.023% of the entire XRP holder base on the ledger is carrying a 0 balance.

XRP Ledger accounts

Of the 100 billion total XRP supply, 58,682,136,692 (58.6%) are currently sitting in holder accounts, with 41,306,191,412 (41.3%) still held in escrow. This amount held in escrow is released periodically and was designed that way to last until the total XRP supply is exhausted.

Going further, a significant number of XRP tokens are also sitting as reserves (tokens in wallets that cannot be spent). The current Total Account Reserves came in at 47,818,440 and Total Owner Reserves is sitting at 13,608,012.

How Will It Affect The XRP Price?

The rapid rise in the number of accounts on the XRP Ledger points to an increase in interest from crypto investors. In this case, as interest rises, so will demand for the XRP token, which would, in turn, lead to a rise in the XRP price.

Analysts have also been incredibly bullish on the XRP price. In one instance, a Wells Fargo Manager forecasted that the price of the altcoin could rise as high as $500, citing Ripple capturing the cross-border payments sector by 2027.

Another interesting forecast put the XRP price at $10,000, once again, citing Ripple’s rising market share in the payments sector as a driver. A more conservative crypto analyst put the token’s price at $130 after it formed a rare triangle pattern on its chart.

Despite these very bullish predictions, the XRP price continues to struggle at this point. It is still trading well below the $0.5 resistance which has become the important level to beat. At the time of writing, it’s sitting at $0.49, recording meager gains of 0.03% on the daily chart. Although there is a more significant 5.52% gain on the weekly chart.

Ripple XRP price chart from Tradingview.com

Bitcoin Open Interest Rises By $1.8 Billion As BTC Breaks $27,000

Data shows the Bitcoin Open Interest has shot up by $1.8 billion as the cryptocurrency’s price has broken the $27,000 level.

Bitcoin Open Interest Has Exploded During The Past Day

The “Open Interest” indicator keeps track of the total amount of Bitcoin futures contracts currently open on all derivative exchange platforms.

When the value of this metric rises, it means that the investors are opening up new positions on the market right now. Generally, the cryptocurrency becomes more likely to display volatility when this happens, as new contracts usually imply an increase in the total leverage in the sector (“leverage” naturally being the loan amount holders can opt to take against their positions).

On the other hand, the indicator going down implies that a net amount of contracts are either closing up or getting liquidated. The asset may become more calmer following such a trend.

Now, here is a chart from CoinGlass that shows the trend in the Bitcoin Open Interest over the year 2023 so far:

Bitcoin Open Interest

The above graph shows that the Bitcoin Open Interest has registered a rather sharp surge today. The main instigator behind this futures rush appears to be the surge in the cryptocurrency’s mark beyond the $27,000 level.

Before this rise, the indicator had a value of $11.04 billion, but now it has hit the $12.81 billion mark, suggesting an increase of a whopping $1.77 billion (about 16%).

This rapid growth in the Open Interest can naturally lead to the asset becoming more volatile, although it’s hard to say in what direction this volatility might appear.

If this rise has come from shorts jumping in to bet against the asset, a further rise would result in their liquidation, thus fueling the price increase even further. If, however, the contracts being opened are long, then it may not end very well for the rally.

The chart shows that the Open Interest had a similar spike back during the Grayscale rally last month, but the longs that had opened then had ended up finding liquidation, as the price had returned to lower levels.

The funding rate, which measures the periodic fee that futures traders pay each other, may provide hints about whether the new positions are shorts or longs.

Bitcoin Funding Rate

As is visible in the graph, the Bitcoin funding rate is positive currently, but it hasn’t changed much with the Open Interest rise, implying that long and short positions are spread more evenly in this increase.

It remains to be seen where the cryptocurrency goes in the coming few days and if the Open Interest surge will play any role.

BTC Price

Bitcoin had surged to $27,400 earlier in the day but has since retraced back to $27,200.

Bitcoin Price Chart

End Of The Road? Why A Bitcoin Price Surge to $28,500 Could Lead To A Crash

The crypto market is finally seeing some green during today’s trading session, with the Bitcoin price rising above $27,000 for the first time since late August. Similar to that occasion, the cryptocurrency stands at a crossroads, but bulls should remain cautious, new data suggests.

As of this writing, the Bitcoin price trades at $27,200 with a 3% profit in the last 24 hours. Over the previous week, the cryptocurrency experienced a 9% gain, with the rest of the top 10 by market cap displaying similar price action but lagging BTC.

Bitcoin BTC BTCUSDT

Bitcoin Price Fractal Spells Doom For Bulls

Pseudonym trader Rekt Capital has been closely monitoring a Bitcoin price fractal, forecasting a re-test below $20,000 for the cryptocurrency. The operation believes that BTC formed a double-top price pattern.

This technical indicator predicts downside pressure for the Bitcoin price. However, the spike in selling pressure seen in the chart may take some time to gain strength.

Bitcoin price BTC BTCUSDT Chart 2

If the Bitcoin fractal above holds accurate, and if the cryptocurrency completes the double top, there is a high chance of a brief relief rally. In this scenario, the price of BTC could continue on its current trajectory and hit the $28,500 to $29,000 levels before declining into critical support.

The fractal could be invalidated if bulls can push the price of Bitcoin above $31,000 and into yearly highs, Rekt Capital believes. Other bullish scenarios in the long term involved a weekly close above the resistance created at around $29,000 and for $19,000 to hold as support in case of further downside.

No Liquidity, No BTC Rally

Additional data from crypto analytics firm TheKingFisher indicates that the current Bitcoin price rally could lose steam. As the chart below shows, upside liquidity for the current price action is limited.

Bitcoin price BTC BTCUSDT Chart 3

On the contrary, big liquidity pools are sitting on the downside, waiting for big BTC traders to push prices into those levels. In the short term, $26,700 is a potential critical support in a spike in selling pressure.

Cover image from Unsplash, chart from Tradingview