Almost half the 60 buy-side professionals surveyed from U.S. and Europe-based asset managers and hedge funds said they’re actively managing digital assets.
Google makes AI disclosure mandatory in political campaign ads

Google updated its political content policy to take effect starting November 2023 which now mandates disclosure of all AI-generated content in election ads.
Casa wallet launches Ethereum vault relay service for increased user privacy

Private key manager Casa has launched a transaction relay feature to offer its Ethereum users more privacy when transacting from their personal vaults.
Is Bitcoin A Buy Or Sell? Ark Invest Shares Market Analysis
In its new monthly report titled “The Bitcoin Monthly: Bitcoin Battles Resistance Around Its On-Chain Mean”, Ark Invest has provided an exhaustive analysis of the current market landscape. The report categorizes its findings into bullish, neutral, and bearish perspectives, providing a holistic view of Bitcoin’s current and potential future stance.
Bullish Arguments For Bitcoin
Grayscale Spot ETF and GBTC’s Discount To NAV: On August 29, a pivotal decision was made by a US Federal Appeals Court. They ruled that the U.S. Securities and Exchange Commission (SEC) must revisit and reconsider its earlier rejection of the Grayscale Bitcoin Trust’s (GBTC) application to transition into a spot ETF. This legal development saw GBTC’s discount to NAV shift from -24% to -18% on the same day, indicating heightened market optimism. By the end of August, GBTC was at a discount-to-NAV of -20.6%.
Bitcoin’s General Cost Basis Recovery: Bitcoin’s realized capitalization, which encompasses both its primary (miners) and secondary (investors) markets, is a measure of the aggregate cost basis of BTC. Between Q4 2022 and Q1 2023, the realized cap drawdown stood at -19%, marking its steepest since 2012. This drawdown serves as a barometer for capital outflows from the network.
Ark’s analysis suggests that the deeper the drawdown, the higher the likelihood of Bitcoin holders exiting the market, potentially setting the stage for a more robust bull market. The realized cap has improved from its all-time high in 2021, moving from a 19% low post the FTX collapse in November 2022 to 15.6%, indicating capital inflows over the past 8 months.
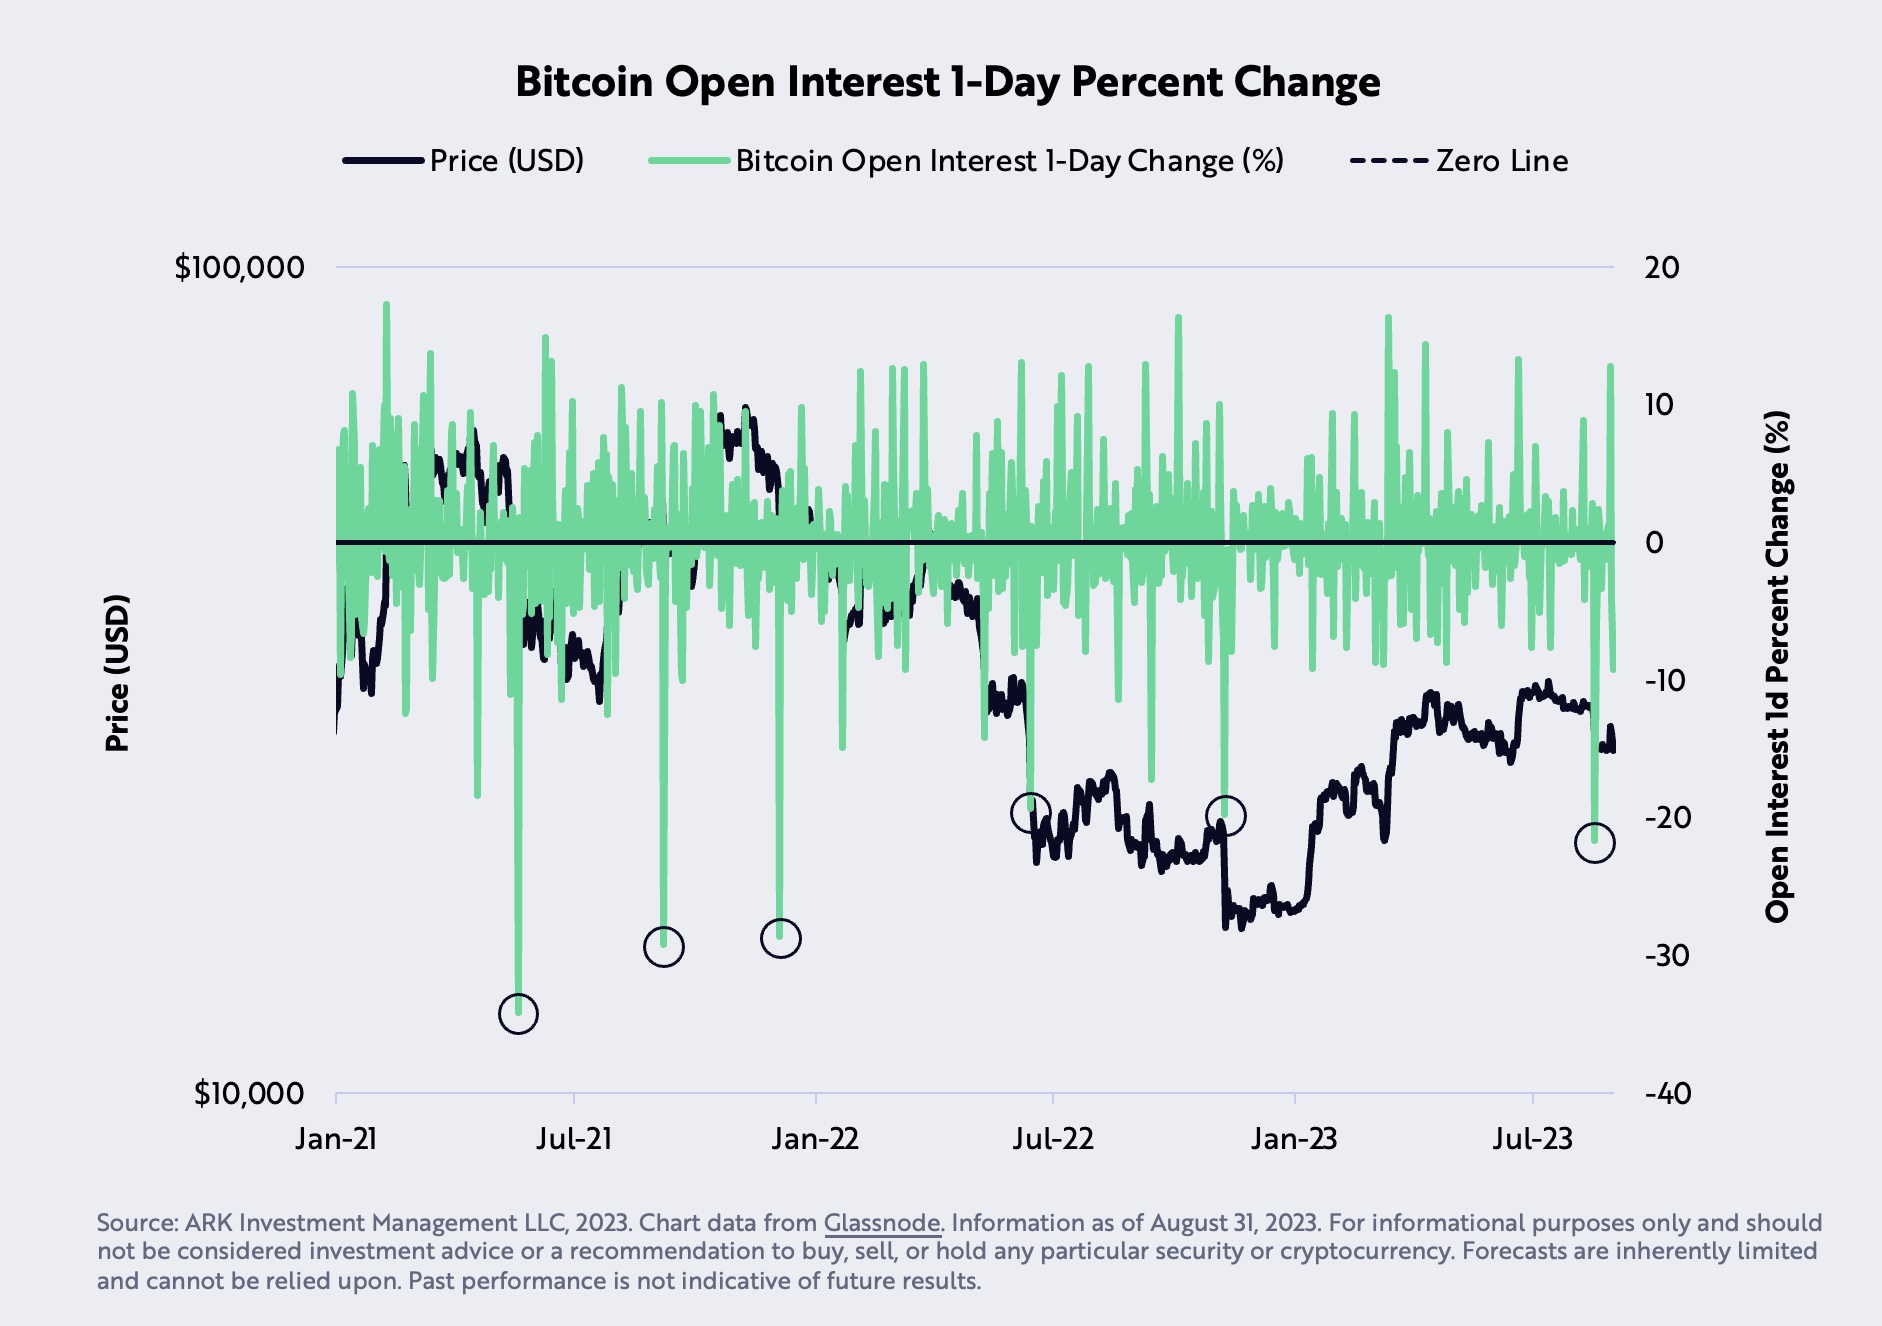
Futures Open Interest Collapse: August 17 witnessed a rapid liquidation of Bitcoin futures by 21.7%, the swiftest since December 2021. Ark Invest interprets this price correction as a “cathartic sentiment correction.”
Neutral Arguments
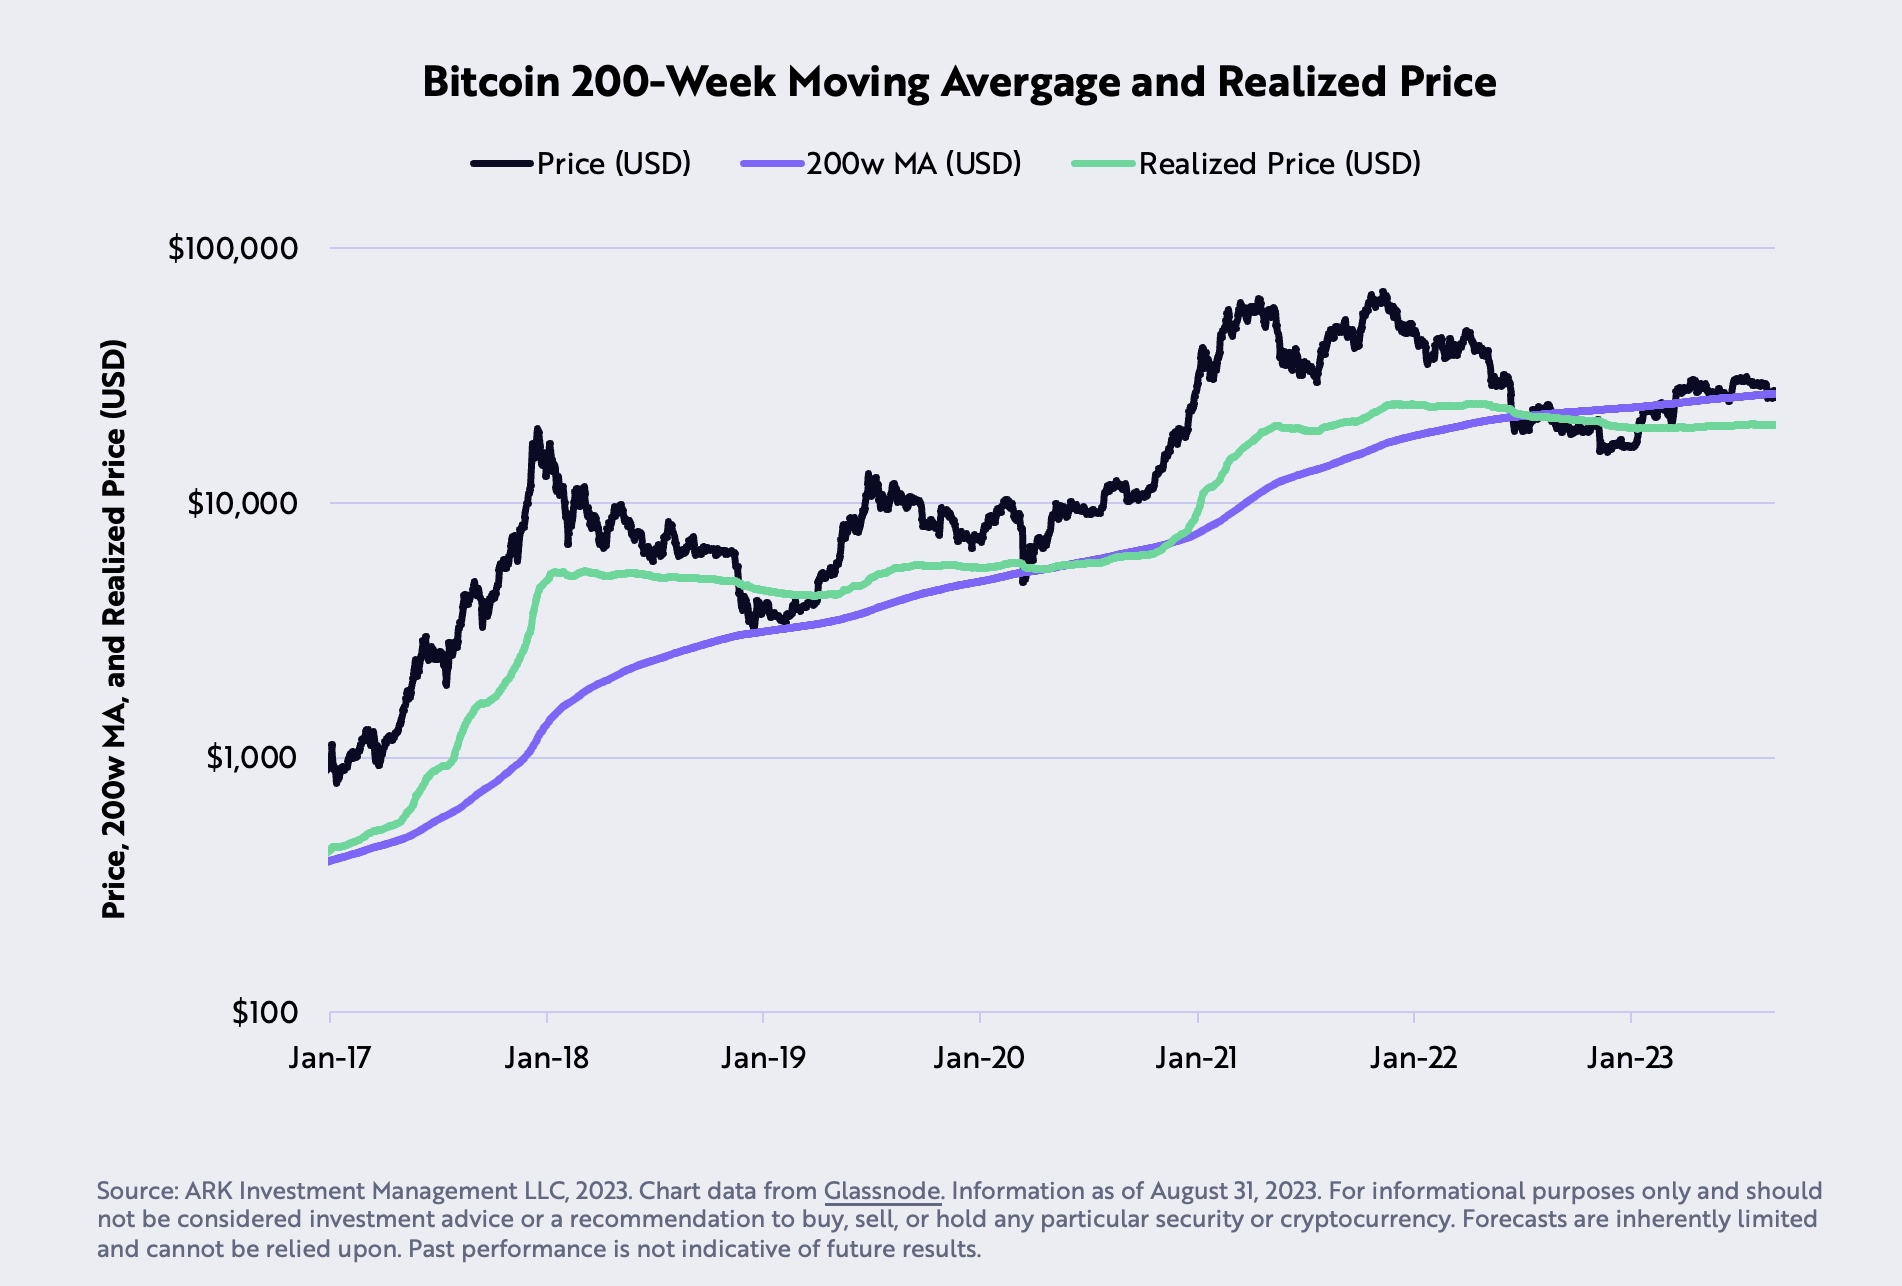
Bitcoin Price and the 200-Week Moving Average: August was a challenging month for Bitcoin as its price dipped by 5.4%, settling below its 200-week moving average at $27,580. This was the first instance since June 2023. However, Ark Invest posits that Bitcoin should find substantial downside support at its realized price of $20,300.
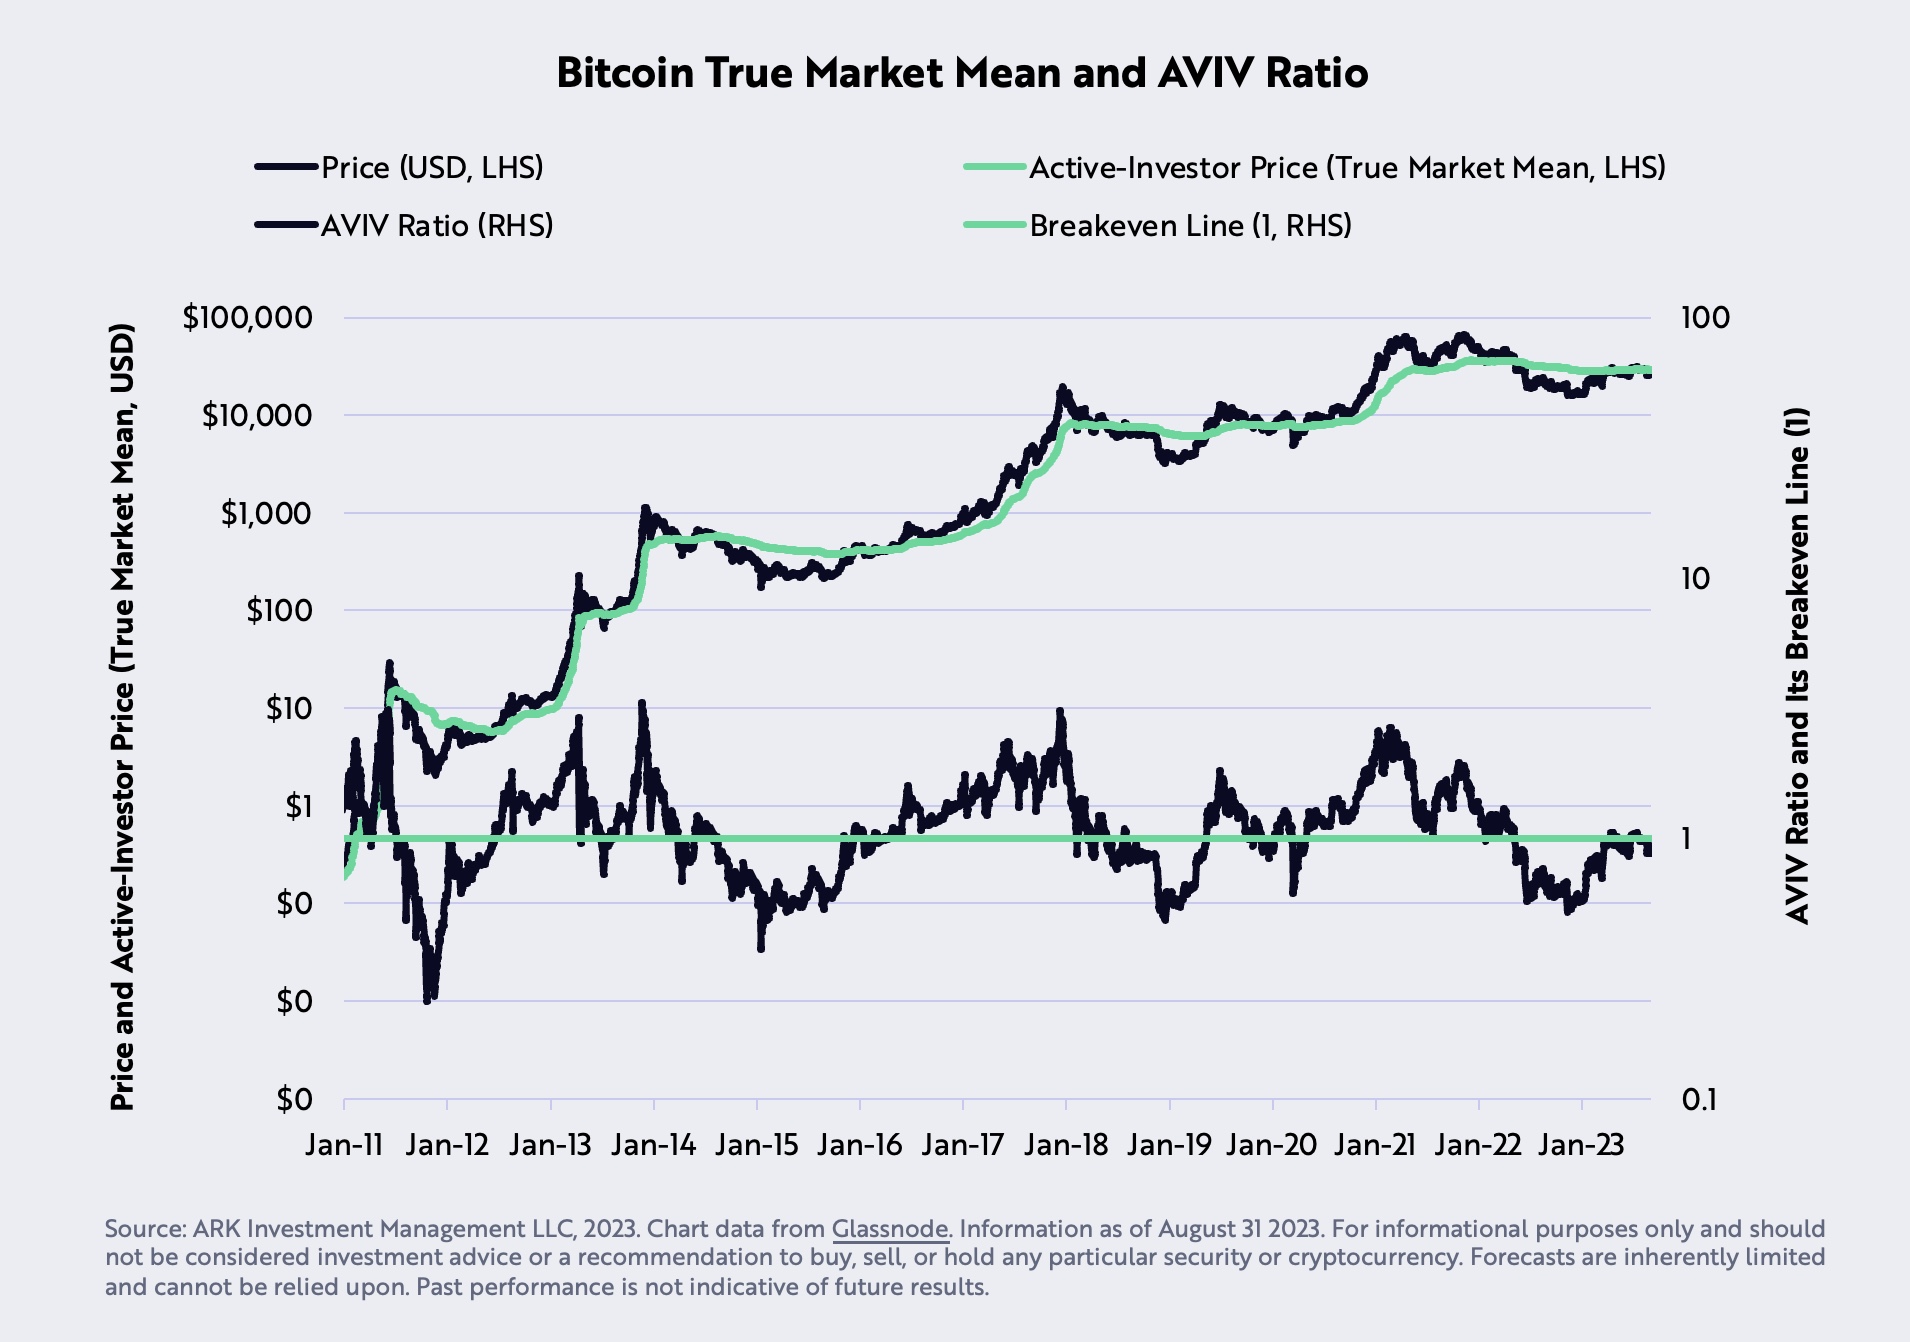
Bitcoin’s On-Chain Mean Resistance: The “on-chain mean,” also termed as the “active-investor price” or “true market mean,” reached $29,608 in August, establishing a potential significant resistance for BTC. This metric, a collaborative effort between ARK Invest and Glassnode, calculated by dividing investors’ cost basis by the number of active coins. These coins are determined based on the aggregate time they’ve remained dormant relative to the total supply.
Stablecoins Market Cap and Liquidity: Stablecoins, often viewed as a liquidity barometer for the market, have seen their 90-day supply drop over 20% from $162 billion in March 2022 to $120 billion currently, signaling a decline in onchain liquidity. However, net inflows during the same timeframe hint at a building bullish market momentum.
Bearish Arguments For BTC (All Macro)
Real GDP vs. Real GDI Growth Rates: A record divergence has been observed between the YoY percent changes in real Gross Domestic Product (GDP) and real Gross Domestic Income (GDI). Historically, GDP and GDI should be on par, as income earned should equate to the value of goods and services produced. Former Federal Reserve economist, Jeremy Nalewaik, has posited that GDI might be a more accurate indicator than GDP.
Real Federal Funds Policy Rate vs. Natural Rate of Interest: For the first time since 2009, the Real Federal Funds Policy Rate has surpassed the Natural Rate of Interest, indicating a shift towards restrictive monetary policy. This theoretical rate, as conceptualized by New York Federal Reserve President, John Williams, is the rate where the economy neither expands nor contracts. With monetary policy’s impact on the economy being long and variable, lending and borrowing are expected to face increased downward pressure.
Government’s Employment Revision: Employment, a lagging indicator, has been pivotal in the Federal Reserve’s rate decisions. Despite the labor disruptions caused by the COVID-19 pandemic expected to have been resolved by now, the government has revised nonfarm payroll statistics downward for six consecutive months. This suggests a weaker labor market than initially reported. The last instance of such a trend, outside of a recession, was in 2007, right before the Great Financial Crisis.
In summary, Ark Invest’s report presents three bullish, four neutral, and three bearish arguments on Bitcoin and the broader market, emphasizing that the market could be at a crucial turning point. At press time, BTC traded at $25,789.
Nigeria’s Web3 education efforts seek to tackle language challenges

Bello Usman Abdullahi, the chief operating officer of the blockchain education platform Bitkova Academy, said the language barrier is one of the current major challenges.
$500B Korean Asset Manager Taps Polygon Labs to Develop Tokenized Securities Network
Mirae Asset Management teams up with Ethereum scaling solution Polygon Labs to develop a tokenized securities network and accelerate adopt of Web3 technologies.
Publicly Traded Korean Firm Neowiz To Build Games on Avalanche Network
Intella X, Neowiz’s Web3 arm, has joined Avalanche Arcad3 to build blockchain games in the crazed market.
Former OpenSea manager withdraws application for bail pending appeal

The attorneys representing Nathaniel Chastain informed the court that Chastain will self-surrender on Nov. 2 to begin serving his sentence.
Rejection of crypto bill exposes Aussies to ‘unregulated market’ — Senator Bragg

Senator Andrew Bragg says rejecting his crypto bill will drive investment away from Australia but lawyers claim it’s part of a bigger regulatory picture.
FASB rules ‘eliminate the poor optics’ that shied firms from crypto: Analyst

“The change should help MicroStrategy and other companies that hold digital assets to eliminate the poor optics that have been created by impairment losses,” said analysts from Berenberg Capital.
XRP Price Prediction – Breaking This Confluence Resistance Could Spark Recovery
Ripple’s token price is holding the $0.485 support against the US Dollar. XRP price could start a recovery wave if it clears $0.510 and $0.525.
- Ripple’s token price is struggling to recover above $0.510 and $0.525 against the US dollar.
- The price is now trading below $0.520 and the 100 simple moving average (4 hours).
- There is a major bearish trend line in place with resistance near $0.5020 on the 4-hour chart of the XRP/USD pair (data source from Kraken).
- The pair might start another decline if it stays below $0.525 in the short term.
Ripple’s Token Price Eyes Recovery
In the past few days, Ripple’s XRP saw a steady decline from the $0.550 resistance against the US Dollar. The price declined below the $0.532 and $0.525 support levels.
It even spiked below the $0.500 support. A low is formed near $0.4863 and the price is now attempting a recovery wave, like Bitcoin and Ethereum. It is now trading near the 23.6% Fib retracement level of the recent decline from the $0.5490 swing high to the $0.4863 low.
XRP is now trading below $0.520 and the 100 simple moving average (4 hours). It is also trading near a major bearish trend line in place with resistance near $0.5020 on the 4-hour chart.
Initial resistance on the upside is near the $0.502 zone and the trend line. The next major resistance is near the $0.518 level or the 50% Fib retracement level of the recent decline from the $0.5490 swing high to the $0.4863 low.

Source: XRPUSD on TradingView.com
The main resistance is forming near $0.525. A successful break above the $0.525 resistance level might send the price toward the $0.532 resistance. Any more gains might call for a test of the $0.550 resistance.
Another Drop in XRP?
If ripple fails to clear the $0.525 resistance zone, it could start another decline. Initial support on the downside is near the $0.490 zone.
The next major support is at $0.485. If there is a downside break and a close below the $0.485 level, XRP’s price could extend losses. In the stated case, the price could retest the $0.450 support zone.
Technical Indicators
4-Hours MACD – The MACD for XRP/USD is now losing pace in the bearish zone.
4-Hours RSI (Relative Strength Index) – The RSI for XRP/USD is now below the 50 level.
Major Support Levels – $0.490, $0.485, and $0.450.
Major Resistance Levels – $0.518, $0.520, and $0.550.
Ripple Labs chair slams Biden, Gensler for having ‘screwed up’ on crypto

Ripple Labs chair Chris Larsen commented on the recent cases involving Ripple, Grayscale, and the SEC, arguing it is time for Congress to take the lead on crypto policy.
Ethereum Price Could See Lift-off Unless This Support Gives Way
Ethereum price is eyeing an upside break above $1,650 against the US Dollar. ETH must stay above $1,600 to start a fresh increase in the near term.
- Ethereum is slowly moving higher from the $1,620 support zone.
- The price is trading above $1,632 and the 100-hourly Simple Moving Average.
- There is a connecting bullish trend line forming with support near $1,622 on the hourly chart of ETH/USD (data feed via Kraken).
- The pair could start a steady increase if there is a close above the $1,650 resistance.
Ethereum Price Eyes Fresh Increase
Ethereum’s price saw a couple of swing moves below the $1,650 resistance zone. ETH even spiked toward $1,665 but the bears remained active. There was a fresh decline, and the price retested the $1,600 support zone.
It is again moving higher above $1,620, like Bitcoin. Ether is now trading above $1,632 and the 100-hourly Simple Moving Average. Besides, there is a connecting bullish trend line forming with support near $1,622 on the hourly chart of ETH/USD.
On the upside, the price might face resistance near the $1,645 level. It is close to the 50% Fib retracement level of the recent drop from the $1,668 swing high to the $1,624 low.
The next resistance is near the $1,650 level or the 61.8% Fib retracement level of the recent drop from the $1,668 swing high to the $1,624 low, above which the price could rise toward the $1,665 level. The next major hurdle is near the $1,700 level.
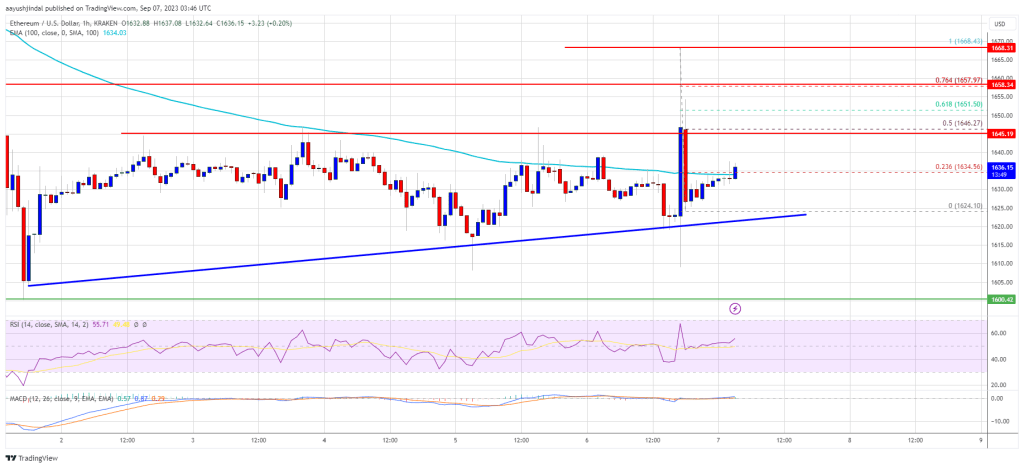
Source: ETHUSD on TradingView.com
A close above the $1,700 level might push Ethereum further higher. The next resistance might be near $1,750. Any more gains might send the price toward the $1,800 resistance.
Another Decline in ETH?
If Ethereum fails to clear the $1,650 resistance, it could start another decline. Initial support on the downside is near the $1,630 level and the 100-hourly Simple Moving Average.
The first key support is close to $1,620 and the trend line. The next key support is $1,600. A downside break below $1,600 might put bears in control. The next major support is near the $1,580 level. If there is a downside break below $1,580, the price could revisit the key $1,540 support level.
Technical Indicators
Hourly MACD – The MACD for ETH/USD is slowly gaining momentum in the bullish zone.
Hourly RSI – The RSI for ETH/USD is now above the 50 level.
Major Support Level – $1,600
Major Resistance Level – $1,650
Bitcoin Bulls Continues To Struggle, Here’s Why Upsides Could Be Limited
Bitcoin price is still consolidating above $25,500. BTC might attempt an upside correction, but upsides might be limited above the $26,200 resistance.
- Bitcoin is still trading in a range above the $25,500 support zone.
- The price is trading below $26,000 and the 100 hourly Simple moving average.
- There is a key bearish trend line forming with resistance near $25,950 on the hourly chart of the BTC/USD pair (data feed from Kraken).
- The pair could attempt to recover but the bears might remain active near $26,200.
Bitcoin Price Stuck In Range
Bitcoin price made another attempt to clear the $26,000 resistance zone. However, BTC failed to gain strength for a move above the $26,000 and $26,200 levels.
As a result, there was a fresh bearish reaction and the price declined below the $25,650 level. The bulls managed to protect the $25,350 support and the price climbed back above $25,500. It is now trading below $26,000 and the 100 hourly Simple moving average.
Besides, there is a key bearish trend line forming with resistance near $25,950 on the hourly chart of the BTC/USD pair. Immediate resistance on the upside is near the $26,000 level and the trend line. It is close to the 23.6% Fib retracement level of the key drop from the $28,150 swing high to the $25,333 low.
The first major resistance is near the $26,200 level. A proper close above the $26,200 level might start an upside correction toward $26,750. It is close to the 50% Fib retracement level of the key drop from the $28,150 swing high to the $25,333 low.
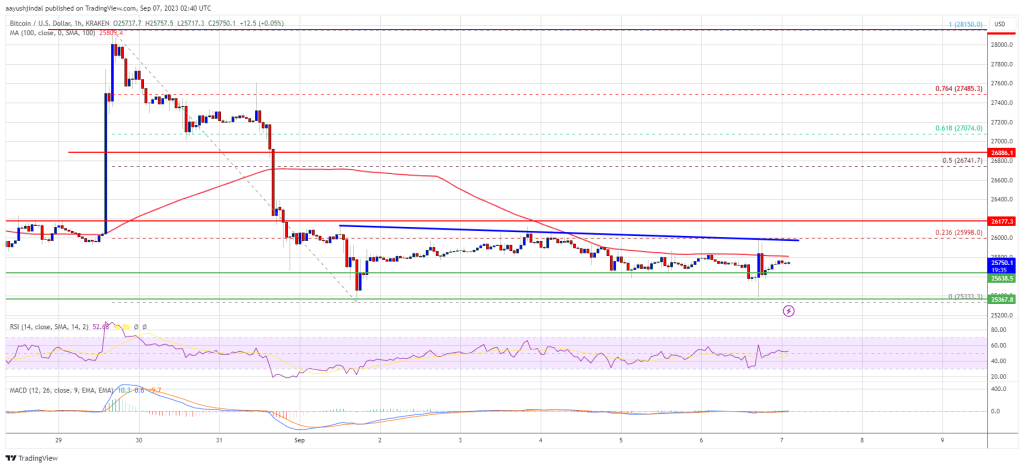
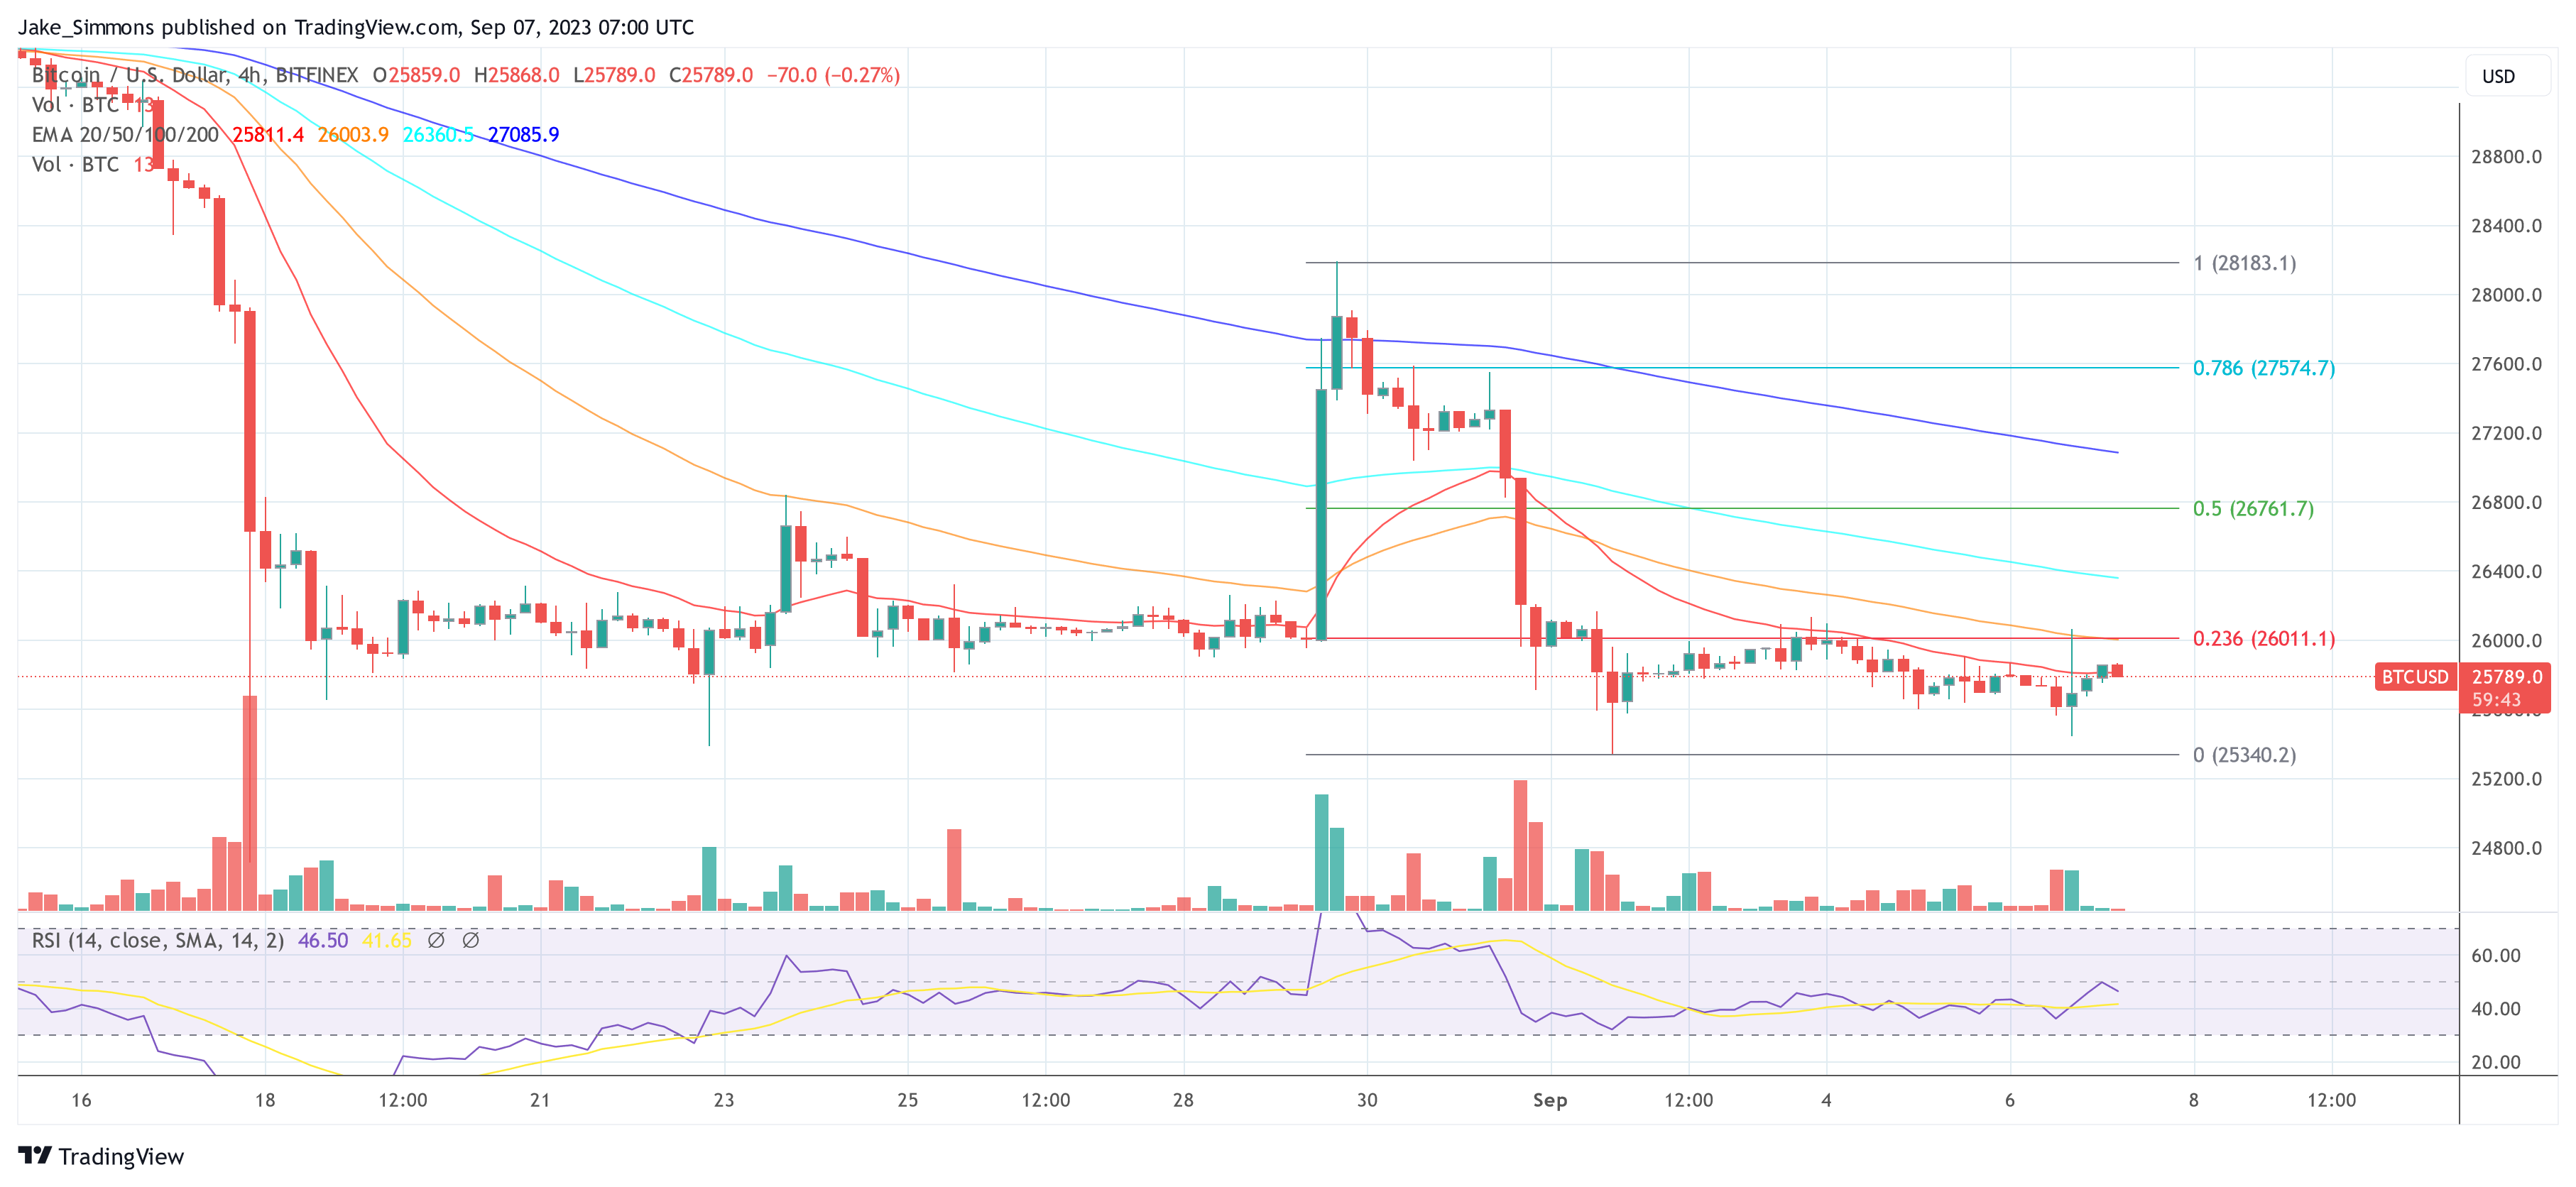
Source: BTCUSD on TradingView.com
The next major resistance is near $27,000, above which the bulls attempt a steady increase. In the stated case, the price could test the $28,000 level.
Another Drop In BTC?
If Bitcoin fails to clear the $26,000 resistance, it could continue to move down. Immediate support on the downside is near the $25,500 level.
The next major support is near the $25,350 level. A downside break and close below the $25,350 level might increase selling pressure. In the stated case, the price could drop toward $24,500 or even $24,000.
Technical indicators:
Hourly MACD – The MACD is now gaining pace in the bearish zone.
Hourly RSI (Relative Strength Index) – The RSI for BTC/USD is now above the 50 level.
Major Support Levels – $25,500, followed by $25,350.
Major Resistance Levels – $25,950, $26,000, and $26,200.
VanEck, ARK filings ‘officially’ start clock for spot Ethereum ETFs: Analyst

Bloomberg ETF analyst James Seyffart expects more spot Ethereum ETFs to be filed in the coming days.
Celsius Network files ‘adversary complaint’ against EquitiesFirst

Bankrupt crypto lender Celsius Network is attempting to recover assets from a private lender called EquitiesFirst Holdings, which reportedly owes $439 million in cash and crypto.
Change to US accounting rules will be a boon to companies holding crypto in 2025

The FASB has recommended that crypto be recorded at fair market value on corporate balance sheets, removing possibly significant impairments but adding to volatility.
Cboe’s BZX Exchange Files to Launch Ark 21Shares, VanEck Spot Ether ETFs
Cboe’s BZX exchange filed the first documents in a bid to offer the first spot ether exchange-traded funds in the U.S.
Following SEC delays, Ark Invest and 21Shares file for spot Ether ETF

The two firms currently have a spot Bitcoin exchange-traded fund being reviewed by the SEC, and recently proposed listings of two Ether futures ETFs.
Bitcoin Little-Changed at $25.7K After Newsy and Volatile Session
Broader crypto markets were modestly lower late on Wednesday.


