
Listing numerous areas of concern, IBM Automation’s Jerry Cuomo lays out the potential pitfalls for businesses using ChatGPT.
Cryptocurrency Financial News
Listing numerous areas of concern, IBM Automation’s Jerry Cuomo lays out the potential pitfalls for businesses using ChatGPT.
The United States Securities and Exchange Commission (SEC) has reopened old wounds after a federal Judge grants the regulator’s request to file a new appeal against Ripple.
Ripple, the crypto firm behind XRP cryptocurrency, had secured a partial victory in July in its case against the SEC that had raged on for almost three years. However, the regulator has not taken this lying down as on Thursday, August 17, Judge Analisa Torres reportedly gave official approval to the SEC’s motion to file an interlocutory appeal against XRP cryptocurrency.
According to the court proceedings, the SEC will file its motion in court from Friday, August 18 until Friday, September 1. This gives the regulator the opportunity and ample time to develop and provide a compelling argument for its allegations of XRP being a security.
This is because the appeal will be focused on the judge’s decision on Ripple’s programmatic sales and direct sales and offerings of XRP tokens as a trade for goods and services.
The new filing is not an official approval of an appeal by the judge but a gateway for the SEC to file its motion. But regardless, this new development could be bad for Ripple who recently celebrated Judge Torres’ declaration that secondary sales of XRP did not count as a security.
Ripple’s Chief Executive Officer, Brad Garlinghouse, and Chief Learning Officer, Stuart Alderoty have addressed the SEC’s decision to put forward an appeal motion. They publicly opposed the SEC’s interlocutory appeal, detailing that the Judge’s ruling on July 13 refutes any allegations the SEC may harbor of XRP being a security.
“We oppose the SEC’s request for an interlocutory appeal. There is no extraordinary circumstance here that would justify departing from the rule requiring all issues as to all parties to be resolved before an appeal,” Alderoty stated in a Twitter post.
On his part, CEO Brad Garlinghouse commented:
Reminder – the request for appeal (even if granted) doesn’t change the fact that XRP is not a security. That’s not up for debate/trial. But the SEC continues to claim that Chris and I acted recklessly in believing that XRP is not a security. That’s utter nonsense.
The SEC’s move to file an interlocutory motion does not come as a surprise as the regulatory body has previously made complaints about the proceedings of Judge Torres’s ruling in the XRP case. The regulator made criticisms of the case’s outcome by questioning the ruling’s alignment with legal principles and stating that the verdict was “wrongly decided.”
The regulator has also been adamant about an interlocutory review and has stated that the case requires a higher review and better clarification by higher judicial authorities, to ensure legal proceedings are executed according to established laws and legal principles.
“Interlocutory review is warranted here. These two issues involve controlling questions of law on which there is substantial ground for differences of opinion, as reflected by an intra-district split that has already developed,” the SEC said in its new filing.
A weekly digest of articles, reports and analyses about tokenized RWAs, the fast-growing financial instruments that merge traditional finance to the blockchain.

A massive amount of traders were liquidated as BTC price dropped to $25,300, but was it primarily retail traders that were washed out?
JPEG’d DAO voters are deciding how to account for a $1 million bounty.

The new bridge aggregator allows cross-chain DAOs to only accept votes confirmed by more than one bridge.
The Bitcoin price range has been obliterated as the crypto market was corrected into a final support line. Volatility in the sector was compressed for weeks, and many were expecting some action in the short term, but the drop caught market participants by surprise as BTC kept on pushing lower.
As of this writing, Bitcoin trades at $26,400, with an 8% loss in the last 24 hours. BTC recorded a 10% correction in the previous seven days, while some altcoins experienced a 17% and even 20% loss on BTC’s crash.
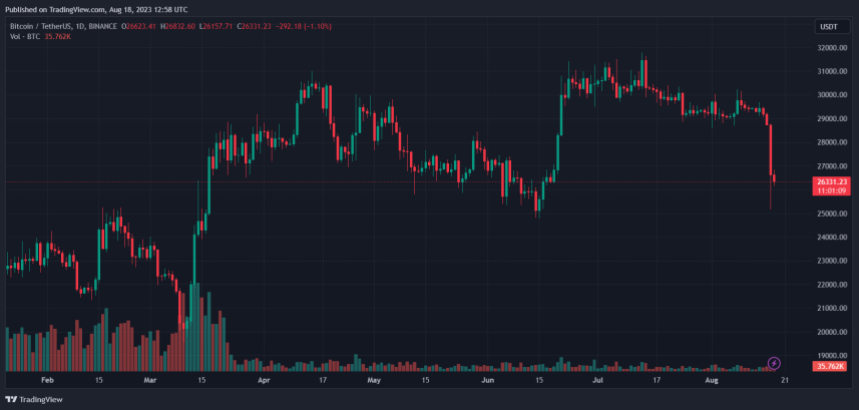
Bitcoin’s sudden crash into critical support around $25,000 saw over $1 billion in long liquidations. The number of traders waiting for a breakout at $30,000 provided the downside with a lot of liquidity, as NewsBTC reported yesterday.
Therefore, the selling pressure was exacerbated as BTC kept on dropping. The recent crash was worse than the one experienced when crypto exchange FTX collapsed, and the crypto sector nuked all long positions by collapsing below $30,000.
Similar to that occasion, the Bitcoin price took some time to recover. According to Material Indicators and its analyst Keith Alan, the same could happen in the current market conditions.
Via his official X account, Alan stated that the BTC price bottom it’s not in. The chart below shows that the analyst pointed out some key levels to watch while the number one cryptocurrency by market caps hovers at $26,000.
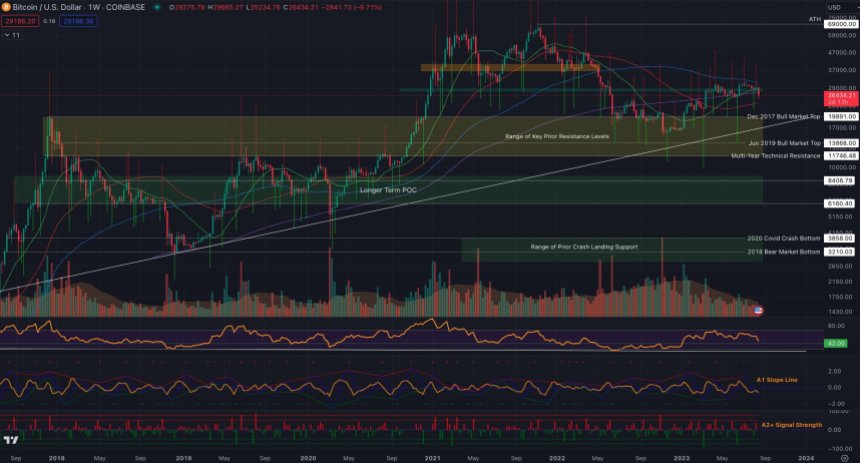
As the chart shows, the levels pointed out by Alan include the 2017 bull market top at $20,000, the 2019 bull market top at around $14,000, and even the COVID-19 lows at $3,850. The analyst stated the following regarding BTC’s potential for further losses:
(…) I can build an argument for every downrange level shown. I personally think there is a high probability of retesting sub $20k levels. That doesn’t mean that there won’t be opportunities to scalp longs along the way because whales still want to distribute as high as they can.
Cover image from Unsplash, chart from Tradingview
BTC slipped below $26,000 amid the crypto market mayhem.

Bitcoin and most major altcoins are reeling under intense selling and charts suggest that the market sell-off is not complete.

An independent report prepared for a House committee suggests the government foster the development of digital asset technology and regulate it cooperatively.

Yoni Assia wanted to make trading accessible to “normal” people, and Vitalik Buterin helped him design the platform.
Bitcoin, the cryptocurrency often referred to as ‘digital gold’, has been on a roller-coaster ride lately. Over the past decade, Bitcoin has transformed from an obscure digital token into an economic powerhouse, drawing attention from retail investors to global financial institutions.
However, as recently observed over the past 24 hours, the asset’s resistance is being tested as a report from Santiment reveals chances of it plunging below the critical $26,000 mark.
Whale activity, or large-scale investors, has historically played a pivotal role in determining the direction of any crypto asset, and currently, Bitcoin is not an exception. Blockchain intelligence firm, Santiment, recently shed light on this phenomenon via a post on X (formerly known as Twitter).
Related Reading: Bitcoin Speculators Retreat As Long-Term Holders Double Down Since $69,000 Peak
According to the firm, the rapid price decline of Bitcoin might have been influenced by heightened whale transaction activity. And despite the substantial loss BTC has suffered in value over the past day, Santiment noted “the dust has far from settled.”
This statement in an actual sense means Bitcoin’s price decline might just be starting, as according to Santiment, “whales are very active on this dump” and “the amount of large wallets is not falling.”
The Blockchain intelligence firm further revealed that the surge in large transactions had commenced even before the significant market drop, hinting at the possibility of a sustained price drop.
The dust has far from settled after #crypto markets had one of its sharpest price drops of 2023. We are seeing a large amount of $1M+ $BTC transactions, indicating whales are very active on this dump. But the amount of large wallets is not falling.
https://t.co/WtXYUPdFOf pic.twitter.com/gdrbUD1wFO
— Santiment (@santimentfeed) August 18, 2023
Given the fundamentals pointed out by Santiment, Bitcoin could see a further plummet potentially dropping it below the $26,000 mark. Moreover, from a technical perspective, such a price move may not actually be far from happening.
Looking at Bitcoin’s chart on the 1-day timeframe, the asset has a two-way movement of taking out liquidity which is the upside and downside. However, the likelihood of tapping into the downside liquidity appears more convincing.
Given the current market trajectory, which leans bearish, each significant price movement typically correlates with liquidation efforts. As the market currently trends downwards, the most immediate liquidity target seems to be the wick beneath the $26,000 zone.
To clarify, a wick refers to the thin line/vertical line above or below the main body of a candlestick. The wick represents the highest and lowest prices of an asset during a specific time frame, while the main body of the candlestick indicates the opening and closing prices
As for its current price, Bitcoin is changing hands at $26,468 at the time of writing, down by nearly 10% over the past 24 hours. The asset has made significant movement in the past day recording a 24-hour high of $28,507 and a 24-low of $25,649.
Featured image from Unsplash, Chart from TradingView

According to Musk, users will have to rely on the “mute” function instead.

Binance Connect was shut down on Aug. 16 after Checkout.com discontinued supporting the crypto exchange.
The Shibarium didn’t get off to a flying start following its launch on August 16. However, the network aims to move past these incidents as block production resumes.
Data from Shibariumscan.io shows that the layer-2 network is up and running again. Shibarium had on August 17 paused block production following the traffic surge, which overwhelmed the blockchain upon mainnet launch.
Close to $1.7 million in bridged funds had reportedly gotten stuck on the Shibarium bridge, with lead developer Shytoshi Kusama confirming that the funds were irrecoverable. However, in a blog post titled “Shibarium: ALL IS WELL,” Kusama termed this FUD and stated that contrary to earlier reports, there was no bridge issue and all funds were “safu.”
He stated that Shibarium experienced a “massive influx of transactions and users that happened at the same time” upon the network going live. That led to the network going offline and not due to its functionalities as earlier thought.
To highlight the magnitude of the traffic surge that the network experienced, Kusama referenced data from the Web3 development platform Alchemy. Shibraium was allotted 400 Million compute units monthly, but the network experienced 160+ million compute units in just under 30 minutes. At that rate, the network could experience billions of compute units daily, putting it on par with the most active layer-2 blockchains.
Lead developer Kusama admitted that the team did not expect that level of trading activity on the network. However, he noted that they were “working tirelessly” to scale the chain and increase its computing power to handle and process more transactions. He further emphasized the team’s commitment to position Shibarium as one of the major players in the DeFi world.
Shiba Inu developer Kaal Dhairya provided further updates in a subsequent blog post dated August 18. Following an investigation, the team discovered that one particular block had been loaded with several transactions, which caused it to go into “fail safe mode” to protect the funds.
He mentioned that the team had “identified multiple possible plans of action” to scale the network and ensure it could handle any substantial traffic on the chain.
Dhairya also confirmed that the bridged funds were safe and that in a show of good faith, the team has chosen to obtain a $2 million insurance cover to protect against any potential challenges that could arise from retrieving the funds upon restart of the network.
SHIB’s price has recovered considerably since the launch saga. However, the token is still down about 1.78% in the last 24 hours, according to data from CoinMarketCap.
But CoinDesk is not abandoning Web3 content.
Data shows the Bitcoin market sentiment has plunged into fear as the cryptocurrency’s price has observed a crash to the $26,500 level.
The “Fear & Greed Index” is an indicator that tells us about the general sentiment among investors in the Bitcoin and wider cryptocurrency market. This metric uses a numeric scale that runs from 0-100 for displaying the sentiment.
All values above the 54 mark suggest the presence of greed among the investors, while those below 46 imply a majority mentality of fear. The region between these cutoffs reflects the neutral sentiment.
As for how the index calculates the sentiment, Alternative.me, the creator of the metric, explains that it takes into account several different factors. Namely; volatility, trading volume, social media sentiment, market cap dominance, and Google Trends are what the indicator currently makes use of to pinpoint the market mentality.
Now, here is what the Bitcoin Fear & Greed Index’s value looks like right now:
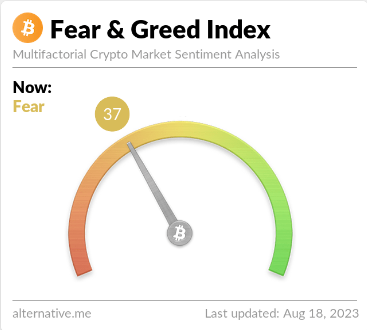
As you can see above, the index’s value is 37 currently, which suggests that the majority of the investors are fearful. This latest value of the indicator reflects a new shift in the sector, as prior to today, the indicator had been stuck inside the neutral territory for more than three weeks straight.
The below chart displays the trend in the fear and greed index over the past year.

From the graph, it’s visible how sharp this latest drop in the metric has been. In a flash, the market sentiment went from being completely neutral (50), to firmly inside the fear territory (37).
The reason behind this hit to the investor mentality has been the sharp crash that Bitcoin has observed during the past day, as the cryptocurrency’s price has now slumped below $26,500.
Earlier, when the index was consolidating in neutral territory, investors had been hesitant and undecided. But with this price action, it would appear that their mind has been made up, and they think that the asset would go down even lower.
Historically, the market has actually tended to make moves that the majority of the holders aren’t expecting. The harder investors lean toward any one direction (fear or greed), the more probable price action of the opposite type becomes.
The Bitcoin Fear & Greed Index also has two sub-sentiments inside fear and greed called extreme fear and extreme greed. These take place at values below 25 and above 75, respectively. Cyclical bottoms and tops in the asset have usually always formed whenever the market has been inside these zones, showcasing the aforementioned effect in action.
As the market hasn’t yet dipped too deep into the fear region, the probability of a bottom is likewise not raised too much yet. Back in March, however, Bitcoin did manage to find its bottom when the investors were fearful to a degree not much greater than right now.
It now remains to be seen how the market sentiment will develop in the coming days, and if BTC will be able to find its bottom off the back of this fearful situation.
At the time of writing, Bitcoin is trading around $26,400, down 10% in the last week.


