DOGE Price Prediction – Dogecoin Below $0.14 Could Spark Larger Degree Drop

Dogecoin is struggling to rise above the $0.1650 resistance zone against the US Dollar. DOGE could decline heavily if it settles below the $0.140 support.

  • DOGE is facing many hurdles near the $0.1650 and $0.170 levels against the US dollar.
  • The price is trading below the $0.1620 level and the 100 simple moving average (4 hours).
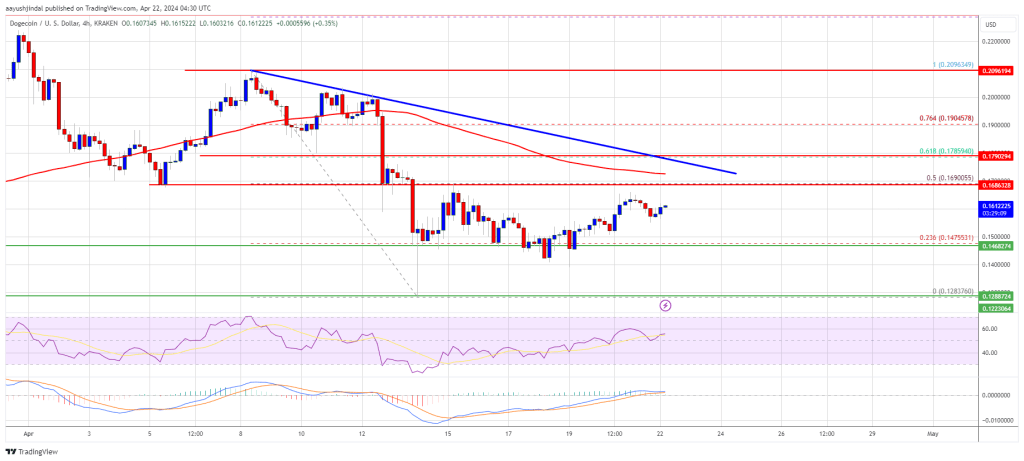
  • There is a major bearish trend line forming with resistance at $0.1620 on the 4-hour chart of the DOGE/USD pair (data source from Kraken).
  • The price must settle above $0.170 to move into a positive zone and start a fresh surge.

Dogecoin Price Signals Downturn

After a major decline, Dogecoin price started a recovery wave from the $0.1280 zone. A low was formed at $0.1283 and DOGE climbed above $0.1350, like Bitcoin and Ethereum.

There was a move above the $0.1385 and $0.140 resistance levels. The price climbed above the 23.6% Fib retracement level of the downward move from the $0.2092 swing high to the $0.1283 low. However, the bears protected more gains above the $0.170 resistance.

The price failed to test the 50% Fib retracement level of the downward move from the $0.2092 swing high to the $0.1283 low. There is also a major bearish trend line forming with resistance at $0.1620 on the 4-hour chart of the DOGE/USD pair.

Dogecoin is also below the $0.160 level and the 100 simple moving average (4 hours). On the upside, the price is facing resistance near the $0.160 level.

DOGE Price Prediction

Source: DOGEUSD on TradingView.com

The next major resistance is near the $0.1680 level. The main hurdle is at $0.170. A close above the $0.170 resistance might send the price toward the $0.1850 resistance. Any more gains might send the price toward the $0.20 level.

More Losses in DOGE?

If DOGE’s price fails to gain pace above the $0.160 level, it could start another decline. Initial support on the downside is near the $0.1475 level.

The next major support is near the $0.1400 level. If there is a downside break below the $0.1400 support, the price could decline further. In the stated case, the price might decline toward the $0.120 level.

Technical Indicators

4 Hours MACD – The MACD for DOGE/USD is now gaining momentum in the bearish zone.

4 Hours RSI (Relative Strength Index) – The RSI for DOGE/USD is now below the 50 level.

Major Support Levels – $0.1475, $0.1400 and $0.1200.

Major Resistance Levels – $0.1600, $0.1680, and $0.1700.

Ethereum Price Faces Crucial Test: Will $3,200 Withstand The Pressure?

Ethereum price is attempting a recovery wave above the $3,125 zone. ETH must clear the $3,200 resistance to continue higher in the near term.

  • Ethereum extended losses and tested the $3,075 support zone.
  • The price is trading below $3,180 and the 100-hourly Simple Moving Average.
  • There is a key rising channel forming with support at $3,140 on the hourly chart of ETH/USD (data feed via Kraken).
  • The pair could continue to move down if it trades below the $3,125 support.

Ethereum Price Faces Resistance

Ethereum price struggled to recover and extended losses below the $3,100 level. ETH traded as low as $3,074 and is currently attempting another recovery wave, like Bitcoin.

There was a minor increase above the $3,125 resistance. The price climbed above the 23.6% Fib retracement level of the recent drop from the $3,292 swing high to the $3,074 low. However, the bears are active near the $3,200 resistance zone.

Ethereum is now trading below $3,180 and the 100-hourly Simple Moving Average. There is also a key rising channel forming with support at $3,140 on the hourly chart of ETH/USD. Immediate resistance is near the $3,180 level and the 100-hourly Simple Moving Average.

The first major resistance is near the $3,200 level or the 61.8% Fib retracement level of the recent drop from the $3,292 swing high to the $3,074 low.

Ethereum Price

Source: ETHUSD on TradingView.com

The next key resistance sits at $3,240, above which the price might gain traction and rise toward the $3,280 level. A close above the $3,280 resistance could send the price toward the $3,350 resistance. If there is a move above the $3,350 resistance, Ethereum could even test the $3,500 resistance. Any more gains could send Ether toward the $3,550 resistance zone.

More Downsides In ETH?

If Ethereum fails to clear the $3,180 resistance, it could continue to move down. Initial support on the downside is near the $3,125 level. The first major support is near the $3,075 zone.

The main support is near the $3,030 level. A clear move below the $3,030 support might set the pace for more losses and send the price toward $2,880. Any more losses might send the price toward the $2,750 level in the near term.

Technical Indicators

Hourly MACDThe MACD for ETH/USD is losing momentum in the bearish zone.

Hourly RSIThe RSI for ETH/USD is now below the 50 level.

Major Support Level – $3,125

Major Resistance Level – $3,200

Bitcoin Price Turns Red And At Risk of More Downsides Below $63K

Bitcoin price failed to recover above the $65,500 resistance. BTC is again moving lower and there is a risk of more downsides below $63,000.

  • Bitcoin started another decline after it failed to surpass the $65,500 resistance zone.
  • The price is trading below $64,500 and the 100 hourly Simple moving average.
  • There is a connecting bearish trend line forming with resistance at $64,500 on the hourly chart of the BTC/USD pair (data feed from Kraken).
  • The pair could accelerate lower if there is a daily close below the $63,000 support zone.

Bitcoin Price Faces Hurdles

Bitcoin price started a recovery wave from the $62,750 support zone. BTC was able to climb above the $64,000 and $64,500 resistance levels. However, the price failed to clear the $65,500 resistance zone.

A high was formed at $65,300 and the price started another decline. There was a move below the $64,500 level. The price tested the 50% Fib retracement level of the recovery wave from the $62,743 swing low to the $65,300 high.

Bitcoin is now trading below $64,500 and the 100 hourly Simple moving average. There is also a connecting bearish trend line forming with resistance at $64,500 on the hourly chart of the BTC/USD pair.

Immediate resistance is near the $64,500 level or the trend line. The first major resistance could be $65,350 or $65,500. A clear move above the $65,500 resistance might send the price higher. The next resistance now sits at $66,200.

Bitcoin Price

Source: BTCUSD on TradingView.com

If there is a clear move above the $66,200 resistance zone, the price could continue to move up. In the stated case, the price could rise toward $67,000. The next major resistance is near the $67,400 zone. Any more gains might send Bitcoin toward the $68,800 resistance zone in the near term.

More Losses In BTC?

If Bitcoin fails to rise above the $64,500 resistance zone, it could continue to move down. Immediate support on the downside is near the $64,000 level.

The first major support is $63,750 or the 61.8% Fib retracement level of the recovery wave from the $62,743 swing low to the $65,300 high. If there is a close below $63,750, the price could start to drop toward $62,750. Any more losses might send the price toward the $61,200 support zone in the near term.

Technical indicators:

Hourly MACD – The MACD is now gaining pace in the bearish zone.

Hourly RSI (Relative Strength Index) – The RSI for BTC/USD is now below the 50 level.

Major Support Levels – $64,000, followed by $63,750.

Major Resistance Levels – $64,500, $65,350, and $66,200.

SOL Price Topside Bias Vulnerable If Solana Continues To Struggle Below $170

Solana attempted a recovery wave above the $140 level. SOL price is now struggling to clear the $160 and $170 resistance levels.

  • SOL price recovered higher and tested the $160 resistance against the US Dollar.
  • The price is now trading below $160 and the 100 simple moving average (4 hours).
  • There is a key bullish trend line forming with support at $146 on the 4-hour chart of the SOL/USD pair (data source from Kraken).
  • The pair could start another decline if it stays below $160 and $170 for a long time.

Solana Price Faces Resistance

Solana price started a major decline below the $170 and $160 support levels. SOL tested the $115 zone and recently started an upside correction, like Bitcoin and Ethereum.

There was a decent increase above the $130 and $140 levels. The price climbed above the 23.6% Fib retracement level of the downward wave from the $205 swing high to the $115 low. It even spiked above the $155 zone and the 100 simple moving average (4 hours).

However, the bears are active near the $160 zone and the 50% Fib retracement level of the downward wave from the $205 swing high to the $115 low. The price struggled and corrected gains.

SOL Price

Source: SOLUSD on TradingView.com

Solana is now trading below $160 and the 100 simple moving average (4 hours). There is also a key bullish trend line forming with support at $146 on the 4-hour chart of the SOL/USD pair. Immediate resistance is near the $155 level. The next major resistance is near the $160 level. A successful close above the $160 resistance could set the pace for another major increase. The next key resistance is near $170. Any more gains might send the price toward the $188 level.

Another Decline in SOL?

If SOL fails to rally above the $160 resistance, it could start another decline. Initial support on the downside is near the $145 level and the trend line.

The first major support is near the $132 level, below which the price could test $120. If there is a close below the $120 support, the price could decline toward the $100 support in the near term.

Technical Indicators

4-Hours MACD – The MACD for SOL/USD is gaining pace in the bearish zone.

4-Hours RSI (Relative Strength Index) – The RSI for SOL/USD is below the 50 level.

Major Support Levels – $146, and $132.

Major Resistance Levels – $155, $160, and $170.

Ethereum Price Faces Rejection, Is This A Fresh Bearish Signal?

Ethereum price failed to clear the $3,280 resistance zone. ETH declined below the $3,200 support and is now consolidating losses above $3,100.

  • Ethereum struggled to clear the $3,250 and $3,280 resistance levels.
  • The price is trading below $3,200 and the 100-hourly Simple Moving Average.
  • There was a break below a key bullish trend line with support at $3,190 on the hourly chart of ETH/USD (data feed via Kraken).
  • The pair could continue to move down if it trades below the $3,100 support.

Ethereum Price Trims Gains

Ethereum price struggled to clear the $3,250 and $3,280 resistance levels. ETH started a fresh decline and traded below the $3,200 support to enter a short-term bearish zone, like Bitcoin.

Besides, there was a break below a key bullish trend line with support at $3,190 on the hourly chart of ETH/USD. The pair even declined below $3,150 and tested $3,100. A low has formed at $3,105 and the price is now consolidating losses.

Ethereum is now trading below $3,200 and the 100-hourly Simple Moving Average. It is testing the 23.6% Fib retracement level of the recent decline from the $3,291 swing high to the $3,105 low.

Immediate resistance is near the $3,180 level and the 100-hourly Simple Moving Average. The first major resistance is near the $3,200 level or the 50% Fib retracement level of the recent decline from the $3,291 swing high to the $3,105 low.

Ethereum Price

Source: ETHUSD on TradingView.com

The next key resistance sits at $3,220, above which the price might gain traction and rise toward the $3,250 level. A close above the $3,250 resistance could send the price toward the $3,280 resistance. If there is a move above the $3,280 resistance, Ethereum could even test the $3,350 resistance. Any more gains could send Ether toward the $3,500 resistance zone.

More Losses In ETH?

If Ethereum fails to clear the $3,200 resistance, it could continue to move down. Initial support on the downside is near the $3,120 level. The first major support is near the $3,100 zone.

The main support is near the $3,030 level. A clear move below the $3,030 support might increase selling pressure and send the price toward $2,850. Any more losses might send the price toward the $2,650 level in the near term.

Technical Indicators

Hourly MACDThe MACD for ETH/USD is losing momentum in the bearish zone.

Hourly RSIThe RSI for ETH/USD is now below the 50 level.

Major Support Level – $3,100

Major Resistance Level – $3,200

Bitcoin Price Trims Gains Amid War Escalation, Can Bulls Save The Day?

Bitcoin price failed to clear the $67,000 resistance. BTC trimmed gains and is now struggling to stay above the $63,650 support zone.

  • Bitcoin started another decline after it failed to surpass the $67,200 resistance zone.
  • The price is trading below $65,000 and the 100 hourly Simple moving average.
  • There was a break below a key bullish trend line with support at $66,200 on the hourly chart of the BTC/USD pair (data feed from Kraken).
  • The pair could correct higher, but the bears might remain active near the $65,500 zone.

Bitcoin Price Dips Again

Bitcoin price struggled to clear the $67,000 and $67,200 resistance levels. BTC formed a short-term topping pattern and started a fresh decline below the $66,000 level.

There was a move below the $65,500 support. Besides, there was a break below a key bullish trend line with support at $66,200 on the hourly chart of the BTC/USD pair. The pair even spiked below $63,650. A low was formed at $63,583 and the price is now consolidating losses.

Bitcoin price is now trading below $65,500 and the 100 hourly Simple moving average. Immediate resistance is near the $64,500 level or the 23.6% Fib retracement level of the downward move from the $67,195 swing high to the $63,583 low.

The first major resistance could be $65,350 or the 50% Fib retracement level of the downward move from the $67,195 swing high to the $63,583 low. A clear move above the $65,350 resistance might send the price higher. The next resistance now sits at $65,850. If there is a clear move above the $65,850 resistance zone, the price could continue to move up. In the stated case, the price could rise toward $67,000.

Bitcoin Price

Source: BTCUSD on TradingView.com

The next major resistance is near the $67,200 zone. Any more gains might send Bitcoin toward the $68,800 resistance zone in the near term.

More Losses In BTC?

If Bitcoin fails to rise above the $65,350 resistance zone, it could continue to move down. Immediate support on the downside is near the $63,500 level.

The first major support is $62,600. If there is a close below $62,600, the price could start to drop toward $61,200. Any more losses might send the price toward the $60,000 support zone in the near term.

Technical indicators:

Hourly MACD – The MACD is now losing pace in the bearish zone.

Hourly RSI (Relative Strength Index) – The RSI for BTC/USD is now below the 50 level.

Major Support Levels – $63,500, followed by $62,600.

Major Resistance Levels – $65,350, $65,850, and $67,000.

XRP Price Reclaims $0.50 and Indicators Suggest Fresh Surge To $0.70

XRP price is recovering higher above the $0.500 resistance. The price is signaling a positive bias and might rally above the $0.580 and $0.600 levels.

  • XRP is attempting a recovery wave above the $0.50 zone.
  • The price is now trading above $0.5150 and the 100 simple moving average (4 hours).
  • There was a break above a key bearish trend line with resistance at $0.5220 on the 4-hour chart of the XRP/USD pair (data source from Kraken).
  • The pair could gain bullish momentum if there is a close above the $0.580 resistance.

XRP Price Aims Higher

After a sharp decline, XRP price found support near the $0.3880 zone. It formed a base and started a fresh increase above the $0.450 resistance, like Bitcoin and Ethereum. The bulls were able to push the price above the $0.50 resistance.

The price climbed above the 50% Fib retracement level of the downward move from the $0.6420 swing high to the $0.3875 low. Besides, there was a break above a key bearish trend line with resistance at $0.5220 on the 4-hour chart of the XRP/USD pair.

The price is now trading above $0.5150 and the 100 simple moving average (4 hours). Immediate resistance is near the $0.5650 level. The next key resistance is near $0.5820 or the 76.4% Fib retracement level of the downward move from the $0.6420 swing high to the $0.3875 low.

XRP Price

Source: XRPUSD on TradingView.com

A close above the $0.5820 resistance zone could spark a strong increase. The next key resistance is near $0.620. If the bulls remain in action above the $0.620 resistance level, there could be a rally toward the $0.680 resistance. Any more gains might send the price toward the $0.700 resistance.

Another Drop?

If XRP fails to clear the $0.5820 resistance zone, it could start another decline. Initial support on the downside is near the $0.540 level.

The next major support is at $0.5150. If there is a downside break and a close below the $0.5150 level, the price might accelerate lower. In the stated case, the price could retest the $0.4650 support zone.

Technical Indicators

4-Hours MACD – The MACD for XRP/USD is now gaining pace in the bullish zone.

4-Hours RSI (Relative Strength Index) – The RSI for XRP/USD is now above the 50 level.

Major Support Levels – $0.540, $0.5150, and $0.4650.

Major Resistance Levels – $0.5650, $0.5820, and $0.6200.

Ethereum Price Holds Support – Why ETH Could Soon Rally 5%

Ethereum price is holding gains above the $3,120 resistance zone. ETH could soon rally if it clears the $3,280 resistance zone.

  • Ethereum extended its increase above the $3,220 resistance zone.
  • The price is trading above $3,165 and the 100-hourly Simple Moving Average.
  • There is a key bullish trend line forming with support at $3,170 on the hourly chart of ETH/USD (data feed via Kraken).
  • The pair could continue to move up if it clears the $3,280 resistance zone.

Ethereum Price Aims Higher

Ethereum price remained in a positive zone above the $3,000 level, like Bitcoin. ETH extended its increase above the $3,150 and $3,165 resistance levels. It even spiked above the $3,250 resistance.

It traded to a new weekly high at $3,263 and recently corrected lower. There was a minor decline below the $3,220 level. Ether dipped below the 50% Fib retracement level of the recent wave from the $3,154 swing low to the $3,263 high.

However, the bulls were active above the $3,200 level. The 61.8% Fib retracement level of the recent wave from the $3,154 swing low to the $3,263 high acted as a support.

Ethereum is now trading above $3,200 and the 100-hourly Simple Moving Average. There is also a key bullish trend line forming with support at $3,170 on the hourly chart of ETH/USD. Immediate resistance is near the $3,250 level. The first major resistance is near the $3,280 level.

Ethereum Price

Source: ETHUSD on TradingView.com

The next key resistance sits at $3,350, above which the price might gain traction and rise toward the $3,500 level. A close above the $3,500 resistance could send the price toward the $3,550 resistance. If there is a move above the $3,550 resistance, Ethereum could even test the $3,750 resistance. Any more gains could send Ether toward the $3,880 resistance zone in the coming days.

Another Drop In ETH?

If Ethereum fails to clear the $3,280 resistance, it could start a downside correction. Initial support on the downside is near the $3,200 level. The first major support is near the $3,180 zone and the trend line.

The main support is near the $3,120 level. A clear move below the $3,120 support might increase selling pressure and send the price toward $3,030. Any more losses might send the price toward the $2,850 level in the near term.

Technical Indicators

Hourly MACDThe MACD for ETH/USD is gaining momentum in the bullish zone.

Hourly RSIThe RSI for ETH/USD is now above the 50 level.

Major Support Level – $3,120

Major Resistance Level – $3,280

Bitcoin Price Eyes Next Breakout As The Bulls Aim For $70K

Bitcoin price climbed above the $66,000 resistance zone and started consolidation. BTC is now eyeing the next move above the $67,200 resistance zone.

  • Bitcoin is eyeing a decent increase above the $67,200 resistance zone.
  • The price is trading above $65,500 and the 100 hourly Simple moving average.
  • There is a connecting bullish trend line forming with support at $65,900 on the hourly chart of the BTC/USD pair (data feed from Kraken).
  • The pair could gain bullish momentum if it clears the $67,200 resistance zone.

Bitcoin Price Eyes More Upsides

Bitcoin price started a fresh increase above the $65,500 and $66,000 resistance levels. BTC even climbed above the $67,000 level. It traded as high as $67,200 and is currently consolidating gains.

There was a minor decline below the $66,500 level, but the price remained stable above the 23.6% Fib retracement level of the upward move from the $64,280 swing low to the $67,200 low. Bitcoin price is still trading above $65,500 and the 100 hourly Simple moving average.

There is also a connecting bullish trend line forming with support at $65,900 on the hourly chart of the BTC/USD pair. The trend line is near the 50% Fib retracement level of the upward move from the $64,280 swing low to the $67,200 low.

Immediate resistance is near the $67,000 level. The first major resistance could be $67,200. A clear move above the $67,200 resistance might send the price higher. The next resistance now sits at $68,500. If there is a clear move above the $68,500 resistance zone, the price could continue to move up. In the stated case, the price could rise toward $70,000.

Bitcoin Price

Source: BTCUSD on TradingView.com

The next major resistance is near the $70,500 zone. Any more gains might send Bitcoin toward the $72,000 resistance zone in the near term.

Are Dips Limited In BTC?

If Bitcoin fails to rise above the $67,000 resistance zone, it could start a downside correction. Immediate support on the downside is near the $66,200 level.

The first major support is $66,000 or the trend line. If there is a close below $66,000, the price could start to drop toward $65,400. Any more losses might send the price toward the $64,200 support zone in the near term.

Technical indicators:

Hourly MACD – The MACD is now losing pace in the bullish zone.

Hourly RSI (Relative Strength Index) – The RSI for BTC/USD is now above the 50 level.

Major Support Levels – $66,200, followed by $66,000.

Major Resistance Levels – $67,000, $67,200, and $68,500.

BNB Price Reclaims $600 and Bulls Could Now Aim For New 2024 High

BNB price is attempting a fresh increase from the $550 zone. The price cleared the $600 resistance and might extend its increase above $630.

  • BNB price started a fresh increase after it cleared the $550 resistance zone.
  • The price is now trading above $580 and the 100 simple moving average (4 hours).
  • There is a key bullish trend line forming with support at $592 on the 4-hour chart of the BNB/USD pair (data source from Binance).
  • The pair could gain bullish momentum if it clears the $608-$610 resistance zone.

BNB Price Gains Strength

After forming a base above the $520 level, BNB price started a fresh increase. There was a steady increase above the $550 and $565 resistance levels, like Ethereum and Bitcoin.

The bulls pushed the price above the $580 pivot level and the 61.8% Fib retracement level of the downward wave from the $630 swing high to the $512 low. More importantly, the price is now trading above $580 and the 100 simple moving average (4 hours).

It is consolidating just above the 76.4% Fib retracement level of the downward wave from the $630 swing high to the $512 low. There is also a key bullish trend line forming with support at $592 on the 4-hour chart of the BNB/USD pair.

BNB Price

Source: BNBUSD on TradingView.com

Immediate resistance is near the $608 level. The next resistance sits near the $630 level. A clear move above the $630 zone could send the price further higher. In the stated case, BNB price could test $650. A close above the $650 resistance might set the pace for a larger increase toward the $680 resistance. Any more gains might call for a test of the $720 level in the coming days.

Are Dips Supported?

If BNB fails to clear the $608 resistance, it could start a downside correction. Initial support on the downside is near the $592 level and the trend line.

The next major support is near the $585 level. The main support sits at $570. If there is a downside break below the $570 support, the price could drop toward the $550 support. Any more losses could initiate a larger decline toward the $532 level.

Technical Indicators

4-Hours MACD – The MACD for BNB/USD is gaining pace in the bullish zone.

4-Hours RSI (Relative Strength Index) – The RSI for BNB/USD is currently above the 50 level.

Major Support Levels – $592, $585, and $570.

Major Resistance Levels – $608, $630, and $650.

Ethereum Price Signals Reversal and $3,400 Is Imminent, Here’s Why

Ethereum price is gaining pace above the $3,120 resistance zone. ETH could continue to move up unless there is a daily close below the $3,030 level.

  • Ethereum extended its increase above the $3,150 resistance zone.
  • The price is trading above $3,150 and the 100-hourly Simple Moving Average.
  • There is a connecting bullish trend line forming with support at $3,160 on the hourly chart of ETH/USD (data feed via Kraken).
  • The pair could continue to move up unless the bears push it below the $3,030 zone.

Ethereum Price Extends Increase

Ethereum price started a recovery wave and was able to clear the $3,000 resistance, like Bitcoin. ETH even climbed above the $3,050 and $3,120 resistance levels to move into a positive zone.

It traded to a new weekly high at $3,234 and is currently consolidating gains. There was a minor decline below the $3,200 level. Ether dipped below the 23.6% Fib retracement level of the recent increase from the $3,120 swing low to the $3,234 high.

Ethereum is now trading above $3,150 and the 100-hourly Simple Moving Average. There is also a connecting bullish trend line forming with support at $3,160 on the hourly chart of ETH/USD. The trend line is close to the 61.8% Fib retracement level of the recent increase from the $3,120 swing low to the $3,234 high.

Immediate resistance is near the $3,210 level. The first major resistance is near the $3,235 level. The next key resistance sits at $3,280, above which the price might gain traction and rise toward the $3,350 level.

Ethereum Price

Source: ETHUSD on TradingView.com

A close above the $3,350 resistance could send the price toward the $3,500 resistance. If there is a move above the $3,500 resistance, Ethereum could even test the $3,550 resistance. Any more gains could send Ether toward the $3,720 resistance zone in the coming days.

Downside Correction In ETH?

If Ethereum fails to clear the $3,235 resistance, it could start a downside correction. Initial support on the downside is near the $3,175 level. The first major support is near the $3,160 zone and the trend line.

The main support is near the $3,150 level and the 100-hourly Simple Moving Average. A clear move below the $3,150 support might increase selling pressure and send the price toward $3,030. Any more losses might send the price toward the $2,850 level in the near term.

Technical Indicators

Hourly MACDThe MACD for ETH/USD is losing momentum in the bullish zone.

Hourly RSIThe RSI for ETH/USD is now below the 50 level.

Major Support Level – $3,150

Major Resistance Level – $3,235

Bitcoin Price Extends Increase, Why Dips Turned Attractive In Short-Term

Bitcoin price extended its increase and climbed above the $66,000 resistance zone. BTC is now showing positive signs and might find bids near $65,500.

  • Bitcoin gained pace for a move above the $65,500 resistance zone.
  • The price is trading above $65,500 and the 100 hourly Simple moving average.
  • There is a key bullish trend line forming with support at $65,700 on the hourly chart of the BTC/USD pair (data feed from Kraken).
  • The pair could correct lower, but the bulls might remain active near the $65,500 support.

Bitcoin Price Gains Strength

Bitcoin price started a fresh increase above the $64,500 and $65,000 resistance levels. BTC bulls even pushed the price above the $66,000 resistance. It traded to a new weekly high at $67,200 and is currently consolidating gains.

The price is slowly moving lower toward the 23.6% Fib retracement level of the upward move from the $64,281 swing low to the $67,200 low. Bitcoin price is still trading above $65,500 and the 100 hourly Simple moving average.

There is also a key bullish trend line forming with support at $65,700 on the hourly chart of the BTC/USD pair. The trend line is near the 50% Fib retracement level of the upward move from the $64,281 swing low to the $67,200 low.

Immediate resistance is near the $67,000 level. The first major resistance could be $67,200. The next resistance now sits at $68,500. If there is a clear move above the $68,500 resistance zone, the price could continue to move up. In the stated case, the price could rise toward $70,000.

Bitcoin Price

Source: BTCUSD on TradingView.com

The next major resistance is near the $70,500 zone. Any more gains might send Bitcoin toward the $72,000 resistance zone in the near term.

Downside Correction In BTC?

If Bitcoin fails to rise above the $67,000 resistance zone, it could start a downside correction. Immediate support on the downside is near the $66,500 level.

The first major support is $65,700 or the trend line. If there is a close below $65,500, the price could start to drop toward $65,000. Any more losses might send the price toward the $64,200 support zone in the near term.

Technical indicators:

Hourly MACD – The MACD is now losing pace in the bullish zone.

Hourly RSI (Relative Strength Index) – The RSI for BTC/USD is now above the 50 level.

Major Support Levels – $66,500, followed by $65,500.

Major Resistance Levels – $67,000, $67,200, and $68,500.

DOGE Price Prediction – Dogecoin Recovery Could Stall At $0.170

Dogecoin is attempting a recovery wave above the $0.150 resistance zone against the US Dollar. DOGE could struggle to clear the $0.170 resistance zone.

  • DOGE started a recovery wave from the $0.1280 support zone against the US dollar.
  • The price is trading above the $0.1500 level and the 100 simple moving average (4 hours).
  • There is a key bearish trend line forming with resistance at $0.170 on the 4-hour chart of the DOGE/USD pair (data source from Kraken).
  • The price must settle above $0.170 to move into a positive zone and start a fresh surge.

Dogecoin Price Faces Hurdles

After a major decline, Dogecoin price found support at $0.1280. A low was formed at $0.1283 and DOGE started a decent recovery wave, like Bitcoin and Ethereum. There was a move above the $0.1350 and $0.140 resistance levels.

The price climbed above the 23.6% Fib retracement level of the downward wave from the $0.2093 swing high to the $0.1283 low. However, the bears are still active and protecting more gains. There is also a key bearish trend line forming with resistance at $0.170 on the 4-hour chart of the DOGE/USD pair.

Dogecoin is also below the $0.1650 level and the 100 simple moving average (4 hours). On the upside, the price is facing resistance near the $0.1690 level or the 50% Fib retracement level of the downward wave from the $0.2093 swing high to the $0.1283 low.

DOGE Price Prediction

Source: DOGEUSD on TradingView.com

The next major resistance is near the $0.170 level. A close above the $0.170 resistance might send the price toward the $0.1880 resistance. The next major resistance is near $0.200. Any more gains might send the price toward the $0.220 level.

Another Decline in DOGE?

If DOGE’s price fails to gain pace above the $0.170 level, it could start another decline. Initial support on the downside is near the $0.1525 level.

The next major support is near the $0.1475 level. If there is a downside break below the $0.1750 support, the price could decline further. In the stated case, the price might decline toward the $0.1280 level.

Technical Indicators

4 Hours MACD – The MACD for DOGE/USD is now gaining momentum in the bullish zone.

4 Hours RSI (Relative Strength Index) – The RSI for DOGE/USD is now above the 50 level.

Major Support Levels – $0.1525, $0.1475 and $0.1280.

Major Resistance Levels – $0.1690, $0.1700, and $0.200.

Ethereum Price Hints At Potential Fresh Rally, Buy The Dip?

Ethereum price is moving higher above the $3,120 resistance zone. ETH could start a fresh rally if it clears the $3,280 resistance zone.

  • Ethereum is recovering higher and approaching the $3,280 resistance zone.
  • The price is trading above $3,100 and the 100-hourly Simple Moving Average.
  • There was a break above two connecting bearish trend lines with resistance at $3,070 and $3,150 on the hourly chart of ETH/USD (data feed via Kraken).
  • The pair could gain bullish momentum if it closes above the $3,250 zone.

Ethereum Price Regains Strength

Ethereum price formed a base above the $2,850 level and started a recovery wave, like Bitcoin. ETH cleared a few key hurdles near $3,000 to enter a positive zone.

There was a break above two connecting bearish trend lines with resistance at $3,070 and $3,150 on the hourly chart of ETH/USD. The pair surpassed the 50% Fib retracement level of the downward move from the $3,278 swing high to the $2,867 low.

Ethereum is now trading above $3,120 and the 100-hourly Simple Moving Average. It is also consolidating above the 76.4% Fib retracement level of the downward move from the $3,278 swing high to the $2,867 low. Immediate resistance is near the $3,200 level.

The first major resistance is near the $3,250 level. The next key resistance sits at $3,280, above which the price might gain traction and rise toward the $3,350 level.

Ethereum Price

Source: ETHUSD on TradingView.com

A close above the $3,350 resistance could send the price toward the $3,420 pivot level. If there is a move above the $3,420 resistance, Ethereum could even climb toward the $3,550 resistance. Any more gains could send Ether toward the $3,880 resistance zone in the coming days.

Another Decline In ETH?

If Ethereum fails to clear the $3,250 resistance, it could start another decline. Initial support on the downside is near the $3,150 level. The first major support is near the $3,120 zone and the 100-hourly Simple Moving Average.

A clear move below the $3,120 support might increase selling pressure and send the price toward $3,020. Any more losses might send the price toward the $2,965 level in the near term.

Technical Indicators

Hourly MACDThe MACD for ETH/USD is gaining momentum in the bullish zone.

Hourly RSIThe RSI for ETH/USD is now above the 50 level.

Major Support Level – $3,150

Major Resistance Level – $3,280

Bitcoin Price Approaches Breakout, Can BTC Pump Above $66K?

Bitcoin price recovered and climbed above the $64,000 resistance zone. BTC is now facing hurdles near the $65,500 and $66,000 levels.

  • Bitcoin is now struggling to gain pace for a move above the $65,500 resistance zone.
  • The price is trading above $64,000 and the 100 hourly Simple moving average.
  • There is a key contracting triangle forming with resistance at $65,100 on the hourly chart of the BTC/USD pair (data feed from Kraken).
  • The pair could start a fresh surge if it clears the $65,500 resistance zone.

Bitcoin Price Starts Increase

Bitcoin price found support above $60,000 and started a fresh increase. BTC climbed above the $62,500 and $63,500 resistance levels. The bulls even pushed the price above the $65,000 level.

However, the bears seem to be active near the $65,500 zone. The recent high was formed at $65,598 and the price is now consolidating gains. There was a drop below the $65,000 level, but the price is still above the 23.6% Fib retracement level of the upward move from the $59,666 swing low to the $65,598 low.

Bitcoin price is trading above $64,000 and the 100 hourly Simple moving average. Immediate resistance is near the $65,100 level. There is also a key contracting triangle forming with resistance at $65,100 on the hourly chart of the BTC/USD pair.

The first major resistance could be $65,500. The next resistance now sits at $66,000. If there is a clear move above the $66,000 resistance zone, the price could continue to move up. In the stated case, the price could rise toward $67,500.

Bitcoin Price

Source: BTCUSD on TradingView.com

The next major resistance is near the $68,500 zone. Any more gains might send Bitcoin toward the $70,000 resistance zone in the near term.

Downside Correction In BTC?

If Bitcoin fails to rise above the $65,500 resistance zone, it could start a downside correction. Immediate support on the downside is near the $64,500 level.

The first major support is $64,000. If there is a close below $64,000, the price could start to drop toward the 50% Fib retracement level of the upward move from the $59,666 swing low to the $65,598 low at $62,500. Any more losses might send the price toward the $61,200 support zone in the near term.

Technical indicators:

Hourly MACD – The MACD is now losing pace in the bullish zone.

Hourly RSI (Relative Strength Index) – The RSI for BTC/USD is now near the 50 level.

Major Support Levels – $64,500, followed by $64,000.

Major Resistance Levels – $65,100, $65,500, and $66,000.

BNB Price May Have Another Chance For A Bullish Streak: Here’s How

BNB price is attempting a fresh increase from the $515 zone. The price could gain bullish momentum if it clears the $572 resistance zone.

  • BNB price started a fresh increase after it found support near the $515 zone.
  • The price is now trading below $555 and the 100 simple moving average (4 hours).
  • There was a break above a key bearish trend line with resistance at $540 on the 4-hour chart of the BNB/USD pair (data source from Binance).
  • The pair could gain bullish momentum if it clears the $572 resistance zone.

BNB Price Faces Hurdles

After a downside correction below $550, BNB price found support near the $515 zone. A low was formed at $513.6 and the price started a recovery wave, like Ethereum and Bitcoin.

There was a move above the $525 and $530 resistance levels. The bulls pushed the price above the $540 pivot level and the 23.6% Fib retracement level of the downward move from the $630 swing high to the $513 low. There was also a break above a key bearish trend line with resistance at $540 on the 4-hour chart of the BNB/USD pair.

The price is still trading below $550 and the 100 simple moving average (4 hours). Immediate resistance is near the $555 level. The next resistance sits near the $572 level or the 50% Fib retracement level of the downward move from the $630 swing high to the $513 low.

BNB Price

Source: BNBUSD on TradingView.com

A clear move above the $572 zone could send the price further higher. In the stated case, BNB price could test $600. A close above the $600 resistance might set the pace for a larger increase toward the $630 resistance. Any more gains might call for a test of the $650 level in the coming days.

Another Decline?

If BNB fails to clear the $572 resistance, it could start another decline. Initial support on the downside is near the $532 level.

The next major support is near the $520 level. The main support sits at $515. If there is a downside break below the $515 support, the price could drop toward the $500 support. Any more losses could initiate a larger decline toward the $465 level.

Technical Indicators

4-Hours MACD – The MACD for BNB/USD is losing pace in the bullish zone.

4-Hours RSI (Relative Strength Index) – The RSI for BNB/USD is currently below the 50 level.

Major Support Levels – $532, $520, and $515.

Major Resistance Levels – $555, $572, and $600.

Ethereum Price Faces Crucial Test: Will $2,850 Withstand the Pressure?

Ethereum price is still consolidating near the $3,000 zone. ETH could start a steady increase if the bulls push the price above the $3,100 resistance.

  • Ethereum is still struggling to recover above the $3,100 resistance zone.
  • The price is trading below $3,100 and the 100-hourly Simple Moving Average.
  • There is a key bearish trend line forming with resistance at $3,070 on the hourly chart of ETH/USD (data feed via Kraken).
  • The pair could accelerate lower if there is a close below the $2,850 support zone.

Ethereum Price Consolidates

Ethereum price attempted another recovery wave and remained stable above the $3,000 level. However, the bears defended the $3,100 resistance zone, like Bitcoin.

There was another decline below $3,000. The price even spiked below the $2,900 support. A low was formed at $2,867 and the price is now recovering losses. It climbed above the 23.6% Fib retracement level of the downward move from the $3,278 swing high to the $2,867 low.

Ethereum is still trading below $3,100 and the 100-hourly Simple Moving Average. Immediate resistance is near the $3,020 level. The first major resistance is near the $3,070 level and the 100-hourly Simple Moving Average.

There is also a key bearish trend line forming with resistance at $3,070 on the hourly chart of ETH/USD. The trend line is close to the 50% Fib retracement level of the downward move from the $3,278 swing high to the $2,867 low. The next key resistance sits at $3,120, above which the price might rise toward the $3,200 level.

Ethereum Price

Source: ETHUSD on TradingView.com

The main downtrend resistance sits at $3,280. A close above the $3,280 resistance could send the price toward the $3,350 pivot level. If there is a move above the $3,350 resistance, Ethereum could even climb toward the $3,550 resistance.

More Losses In ETH?

If Ethereum fails to clear the $3,100 resistance, it could start another decline. Initial support on the downside is near the $2,920 level. The first major support is near the $2,850 zone.

A clear move below the $2,850 support might send the price toward $2,620. Any more losses might send the price toward the $2,550 level in the near term.

Technical Indicators

Hourly MACDThe MACD for ETH/USD is gaining momentum in the bearish zone.

Hourly RSIThe RSI for ETH/USD is now below the 50 level.

Major Support Level – $2,850

Major Resistance Level – $3,100

Bitcoin Price Still At Risk of Major Downside Break Below $60K

Bitcoin price is showing bearish signs below the $63,000 resistance zone. BTC must stay above the $60,000 support zone to avoid a major decline.

  • Bitcoin is still struggling to start a recovery wave above the $63,000 resistance zone.
  • The price is trading below $62,800 and the 100 hourly Simple moving average.
  • There was a break below a connecting bullish trend line with support at $62,400 on the hourly chart of the BTC/USD pair (data feed from Kraken).
  • The pair could gain bearish momentum if it settles below the $60,000 support zone.

Bitcoin Price Struggle Continues

Bitcoin price started another increase above the $61,500 resistance zone. BTC cleared the $62,500 and $63,000 resistance levels. It even spiked above $64,000 but failed to surpass the key level at $65,000.

A high was formed at $64,142 before there was a sharp decline. There was a break below a connecting bullish trend line with support at $62,400 on the hourly chart of the BTC/USD pair. It dived below the $60,800 level and retested $59,650.

A low was formed near $59,666 and the price is now attempting a fresh recovery wave. The price climbed above the 23.6% Fib retracement level of the recent decline from the $64,142 swing high to the $59,666 low.

Bitcoin price is trading below $62,800 and the 100 hourly Simple moving average. Immediate resistance is near the $62,000 level. It is close to the 50% Fib retracement level of the recent decline from the $64,142 swing high to the $59,666 low.

The first major resistance could be $63,000. The next resistance now sits at $64,200. If there is a clear move above the $64,200 resistance zone, the price could continue to move up. In the stated case, the price could rise toward $65,000.

Bitcoin Price

Source: BTCUSD on TradingView.com

The next major resistance is near the $66,500 zone. Any more gains might send Bitcoin toward the $67,500 resistance zone in the near term.

More Losses In BTC?

If Bitcoin fails to rise above the $62,000 resistance zone, it could start another decline. Immediate support on the downside is near the $60,800 level.

The first major support is $60,000. If there is a close below $60,000, the price could start to drop toward the $59,550 level. Any more losses might send the price toward the $58,500 support zone in the near term.

Technical indicators:

Hourly MACD – The MACD is now gaining pace in the bearish zone.

Hourly RSI (Relative Strength Index) – The RSI for BTC/USD is now below the 50 level.

Major Support Levels – $60,800, followed by $60,000.

Major Resistance Levels – $62,000, $63,000, and $64,200.

LINK Price Eyes Recovery If It’s Able to Hold One Crucial Level

Chainlink’s LINK price retested the $12.00 support zone. The price is now eyeing a recovery wave above the $13.50 and $15.00 resistance levels.

  • Chainlink price is showing bearish signs below the $15.00 resistance against the US dollar.
  • The price is trading below the $14.20 level and the 100 simple moving average (4 hours).
  • There is a key bearish trend line forming with resistance near $13.50 on the 4-hour chart of the LINK/USD pair (data source from Kraken).
  • The price could start a decent increase if it clears the $15.00 resistance zone.

Chainlink (LINK) Price Eyes Steady Increase

In the past few days, Chainlink saw a major decline from well above the $18.00 level. LINK price declined below the $15.00 pivot level to enter a short-term bearish zone, like Bitcoin and Ethereum.

The price tested the $12.00 support zone. A low was formed at $11.92 and the price is now attempting a recovery wave. There was a move above the $12.50 level. It even jumped above the 23.6% Fib retracement level of the downward move from the $18.66 swing high to the $11.92 low.

LINK price is still trading below the $14.20 level and the 100 simple moving average (4 hours). Immediate resistance is near the $13.50 level. There is also a key bearish trend line forming with resistance near $13.50 on the 4-hour chart of the LINK/USD pair.

LINK Price

Source: LINKUSD on TradingView.com

The next major resistance is near the $15.00 zone. A clear break above $15.00 may possibly start a steady increase toward the $16.00 level or the 61.8% Fib retracement level of the downward move from the $18.66 swing high to the $11.92 low. The next major resistance is near the $18.00 level, above which the price could test $20.00.

More Losses?

If Chainlink’s price fails to climb above the $13.50 resistance level, there could be a fresh decline. Initial support on the downside is near the $12.80 level.

The next major support is near the $12.00 level, below which the price might test the $10.80 level. Any more losses could lead LINK toward the $10.00 level in the near term.

Technical Indicators

4 hours MACD – The MACD for LINK/USD is gaining momentum in the bearish zone.

4 hours RSI (Relative Strength Index) – The RSI for LINK/USD is now below the 50 level.

Major Support Levels – $12.80 and $12.00.

Major Resistance Levels – $13.50 and $14.00.

Ethereum Price Holds Strong At $3K But Can Bulls Clear This Hurdle?

Ethereum price is consolidating near the $3,000 zone. ETH could start a decent recovery wave if it clears the $3,100 and $3,200 resistance levels.

  • Ethereum is struggling to recover above the $3,100 resistance zone.
  • The price is trading below $3,120 and the 100-hourly Simple Moving Average.
  • There is a major bearish trend line forming with resistance at $3,035 on the hourly chart of ETH/USD (data feed via Kraken).
  • The pair could start another decline if it stays below the $3,100 resistance zone.

Ethereum Price Holds Ground

Ethereum price slowly moved lower after it failed to clear the $3,200 resistance zone. ETH remained in a bearish zone below $3,100 and showed bearish signs, like Bitcoin.

Recently, the bears were able to push the price below the $3,000 support zone. However, the bulls were active near the 50% Fib retracement level of the upward wave from the $2,535 swing low to the $3,279 high. Ethereum is now trading below $3,120 and the 100-hourly Simple Moving Average.

Immediate resistance is near the $3,030 level. There is also a major bearish trend line forming with resistance at $3,035 on the hourly chart of ETH/USD. The first major resistance is near the $3,100 level and the 100-hourly Simple Moving Average.

Ethereum Price

Source: ETHUSD on TradingView.com

The next key resistance sits at $3,200, above which the price might rise toward the $3,280 level. A close above the $3,280 resistance could send the price toward the $3,500 pivot level. If there is a move above the $3,500 resistance, Ethereum could even climb toward the $3,650 resistance in the coming sessions.

More Losses In ETH?

If Ethereum fails to clear the $3,100 resistance, it could start another decline. Initial support on the downside is near the $3,000 level. The first major support is near the $2,900 zone.

The next key support could be the $2,820 zone or the 61.8% Fib retracement level of the upward wave from the $2,535 swing low to the $3,279 high. A clear move below the $2,820 support might send the price toward $2,600. Any more losses might send the price toward the $2,550 level in the near term.

Technical Indicators

Hourly MACDThe MACD for ETH/USD is gaining momentum in the bearish zone.

Hourly RSIThe RSI for ETH/USD is now below the 50 level.

Major Support Level – $2,900

Major Resistance Level – $3,100