In a controversial report, Forbes unveiled a list of 20 “crypto billion-dollar zombies,” Layer 1 (L1) tokens, which the news outlet defines as crypto assets with substantial valuations but “limited utility beyond speculative trading.”
These cryptocurrencies and projects include Ripple, XRP, Ethereum Classic (ETC), Tezos (XTZ), Algorand (ALGO), and Cardano (ADA), among others.
XRP And Ethereum Classic In The Spotlight
Ripple Labs, the company behind XRP, was highlighted as a prominent crypto zombie. Despite XRP’s active trading volume of around $2 billion daily, Forbes asserts that the token’s primary purpose remains “speculative” and “lacking meaningful utility.”
However, Ripple Labs and XRP are not alone in this regard. Forbes reveals that 50 blockchains, excluding Bitcoin (BTC) and Ethereum (ETH), currently trade at values surpassing $1 billion, with at least 20 of them classified as “functional zombies.” Collectively, these 20 blockchains hold a market value of $116 billion, despite having “limited user bases.”
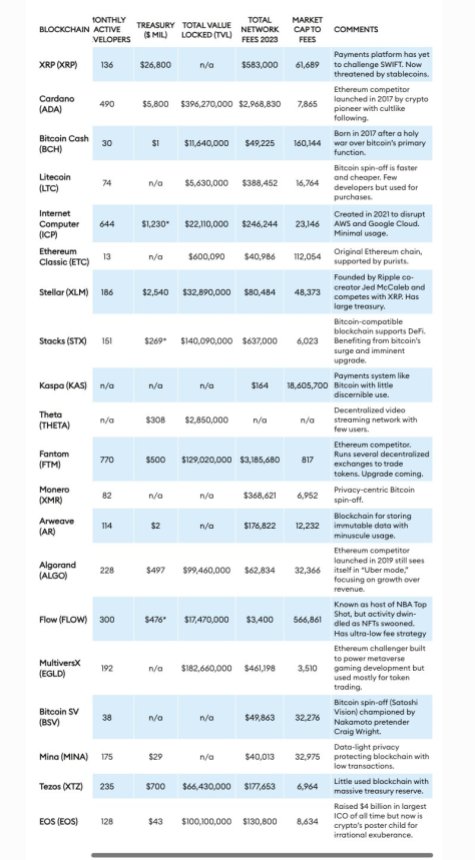
According to Forbes, an example of a “functional zombie” is Ethereum Classic, which maintains the distinction of being the original Ethereum chain.
While ETC has a market value of $4.6 billion, its fee generation in 2023 was less than $41,000, raising questions about the blockchain’s viability for the news organization.
Another crypto project in Forbes’ report is Tezos, which raised $230 million through an initial coin offering (ICO) in 2017.
Tezos’ XTZ token currently holds a market capitalization of $1.2 billion. However, the blockchain’s fee earnings were meager, with $5,640 in February 2024 and a total of $177,653 for all of 2023.
Algorand, once hailed as an “Ethereum killer” due to its capability of processing 7,500 transactions per second, faces similar challenges.
Despite a market cap of $2 billion and a treasury holding of $500 million, Algorand earned $63,000 in blockchain transaction fees throughout 2023. For Forbes, this casts doubt on its actual adoption and utility.
Crypto ‘Zombie’ Blockchains
The zombie blockchains are categorized into two groups by Forbes: spin-offs and direct competitors to established blockchains like Bitcoin and Ethereum.
Spin-off zombies include Bitcoin Cash (BCH), Litecoin (LTC), Monero (XMR), Bitcoin SV (BSV), and Ethereum Classic.
These blockchains, collectively valued at $23 billion, reportedly emerged from “disagreements” among programmers regarding the governance and direction of the original chains.
Forbes notes that when such conflicts arise, hard forks occur, resulting in new networks that share the same transaction history as their predecessors. The agency claims that their market value “often exceeds” their real-world usage.
Overall, The report highlights a growing disparity between the valuations of certain projects in the cryptocurrency industry and their actual utility and usage. Consequently, Forbes refers to these projects as “zombies.”
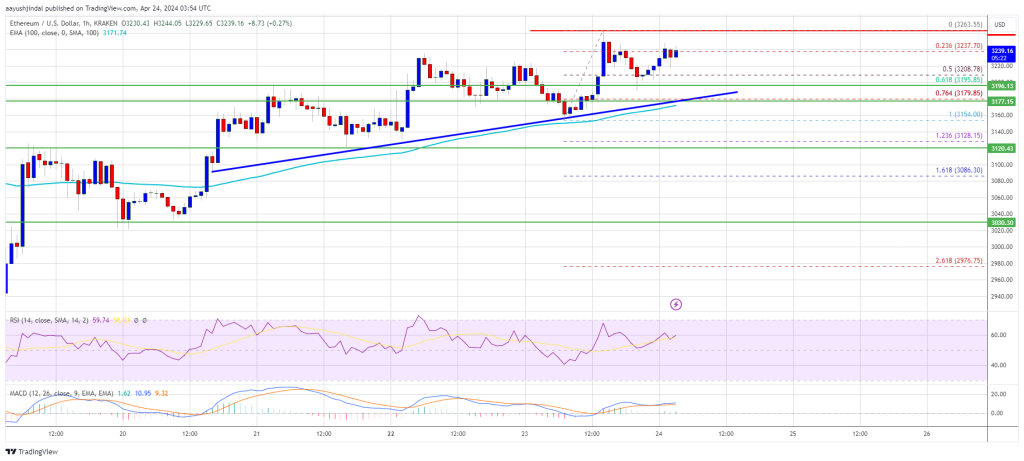
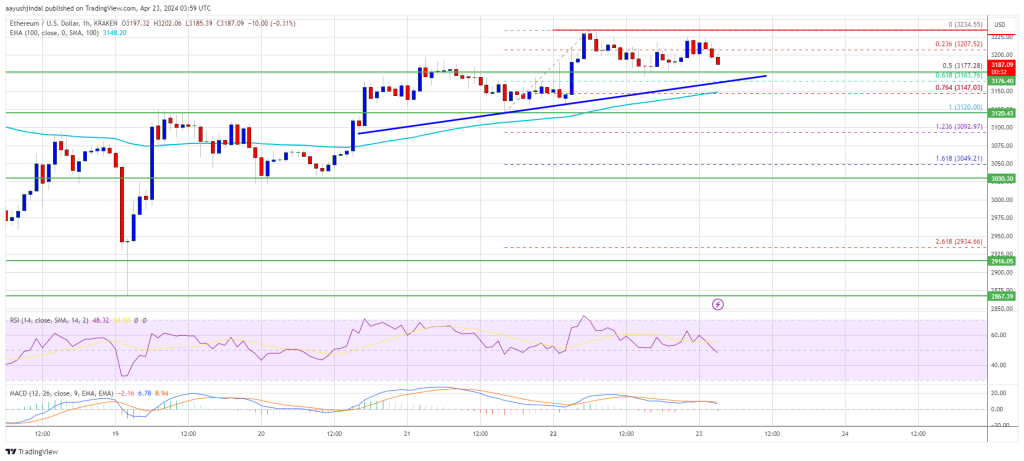
Featured image from Shutterstock, chart from TradingView.com


