Analyst Shares Bitcoin Cheat Sheet Showing When The Bull Run Begins

Bitcoin has held steady around the $108,000 price level in recent days. After bouncing back from a brief pullback near $105,500 on Wednesday, Bitcoin recently tested $109,000 again in the past 24 hours.

A popular crypto analyst has shared a long-term “Bitcoin Bull Run Cheat Sheet” that claims that the cryptocurrency has now entered into the final phase that will lead to massive price gains.

Bitcoin Cheat Sheet Declares Start Of Final Bull Phase

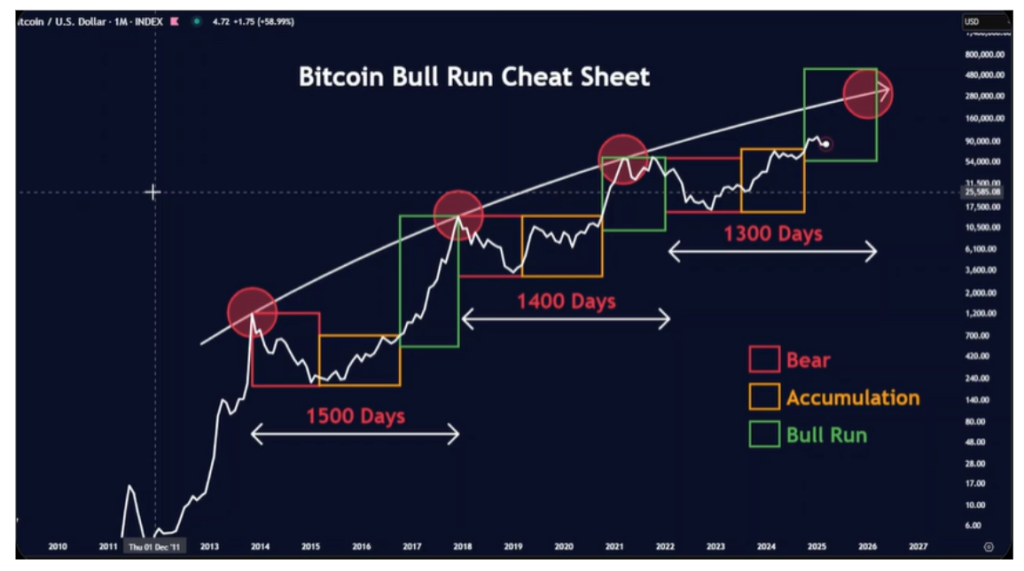
In a recent post on X, Merlijn The Trader released what he dubbed the “Bitcoin Bull Run Cheat Sheet.” This cheat sheet is a breakdown of Bitcoin’s past market movements that shows the distinct phases of bear markets, accumulation zones, and subsequent parabolic bull runs. 

The cheat sheet divides each of Bitcoin’s two previous cycles from 2014 into three colored boxes: red for bear markets, orange for accumulation, and green for bull runs. Merlijn’s chart traces this repeating structure over the past decade, showing how each bull market followed a similar rhythm that began after a lengthy consolidation period and ended with a strong price explosion.

The first full cycle began with Bitcoin’s peak around $1,000 in December 2013. Following that top, the price entered a long, painful bear market that spanned into 2015. This red-box phase eventually transitioned into accumulation, where Bitcoin traded sideways between $80 and $500 for a prolonged period. The green bull run box on the chart began around early 2017, and eventually ended with a peak just below $20,000 in late 2017. According to the cheat sheet, this entire cycle from peak to new peak lasted 1500 days.

Bitcoin’s second cycle kicked off after its December 2017 top. A long drawdown followed, and the bear market phase dragged Bitcoin down to $3,000 by the end of 2018. The chart marks this point with another red box, followed by the orange accumulation zone that stretched well into 2020. 

The cheat sheet’s green box reappeared in late 2020 right as Bitcoin broke above its previous highs. The price shot up throughout 2021 and eventually reached a new all-time high around $69,000 in November of that year. This second full cycle was shorter than the first and spanned around 1400 days from the previous top.

When Will The Next Bull Run Begin?

The current cycle began with Bitcoin’s all-time high in November 2021. Since then, the market has gone through its familiar sequence. A sharp decline into 2022 which bottomed around $15,000 represents the bear market phase. The decline was followed by nearly a year of sideways movement and slow recovery up until early 2025. This is represented as the orange accumulation box on the cheat sheet above.

According to the analyst, Bitcoin is now in the next bull phase, and possibly the largest one yet. The chart projects a continuation along the long-term growth curve, possibly toward the $250,000 to $300,000 range over the coming year. Notably, the timeline for the entire cycle this time should take about 1,300 days from late 2021 to complete.

At the time of writing, Bitcoin is trading at $108,260.

Featured image from Pixabay, chart from TradingView

Ethereum Touted as ‘Foundational Layer for Global Finance’ by Firm With $500M ETH Bet

At the time of writing, Ether (ETH) is trading at around $2,505, up 0.56% in the past 24-hours, according to CoinDesk Research's technical analysis model. As for the broader crypto market as gauged by the CoinDesk 20 Index (CD20), it is up 0.34% during the same period.

SharpLink Gaming, Inc. (SBET) is a pioneering online performance marketing company specializing in the sports betting and iGaming industries. Headquartered in Minneapolis, SharpLink leverages its AI-powered C4 platform to deliver personalized, data-driven marketing content that enhances customer acquisition and retention for sportsbook and casino operators. The company has expanded through strategic acquisitions and partnerships, establishing itself as a leader in the evolving sports betting ecosystem.

On July 4, 2025, SharpLink announced on X that it has become the first publicly listed company to adopt ETH as its primary treasury reserve asset. The company outlined a comprehensive treasury strategy focused on accumulating ETH, staking it, and growing ETH-per-share to create long-term shareholder value.

SharpLink emphasized that its goal is not just to hold ETH but to actively deploy it through native staking, restaking, and Ethereum-based yield strategies. The company highlighted ETH's advantages as a corporate reserve asset: it is productive via staking rewards, composable across decentralized finance protocols, scarce, secure, and aligned with the infrastructure of the future internet. This approach represents a bold redefinition of traditional treasury management, integrating decentralized finance principles into corporate finance.

This strategic pivot began with a $425 million private placement announced on May 27, led by Consensys and other prominent crypto investors, to fund the acquisition of ETH as SharpLink’s primary treasury asset. Joseph Lubin, Ethereum co-founder and founder of Consensys, joined SharpLink’s Board of Directors as Chairman upon closing this placement, reinforcing the company’s commitment to blockchain innovation.

Since officially launching its ETH treasury strategy on June 2, SharpLink has aggressively expanded its Ethereum holdings. Between May 30 and June 12, 2025, the company acquired approximately 176,271 ETH for about $463 million at an average price of $2,626 per ETH.

Following this, from June 16 to June 20, SharpLink purchased an additional 12,207 ETH for roughly $30.7 million, funded in part by $27.7 million raised through At-The-Market (ATM) equity sales.

By June 24, SharpLink’s ETH holdings reached 188,478 ETH, with 100% of these reserves deployed in staking solutions generating staking rewards. And by July 1, the treasury expanded further to 198,478 ETH, yielding over 220 ETH in staking rewards since the strategy’s inception.

Joseph Lubin has stated that embedding Ethereum at the core of SharpLink’s capital strategy embodies technological progress and institutional trust, positioning the company to lead the evolution of digital commerce. Meanwhile, CEO Rob Phythian has noted that SharpLink’s upcoming Nasdaq closing bell ceremony on July 7, 2025, will symbolize this new chapter, showcasing how digital assets can coexist with public market discipline and corporate governance.

SharpLink’s Ethereum treasury strategy uniquely positions the company at the crossroads of sports betting, blockchain technology, and decentralized finance, offering investors regulated and transparent exposure to Ethereum’s growth potential while advancing SharpLink’s mission to innovate the multi-billion-dollar iGaming industry.

Technical Analysis Highlights

  • ETH gained 2.2% from July 4 15:00 to July 5 14:00, climbing from $2,475.48 to $2,530.02.
  • A sharp sell-off between 13:06 and 14:05 pushed ETH down to $2,514.85 before buyers stepped in.
  • Strong support formed between $2,480 and $2,500 during the July 5 16:00 hour, with 382,821 ETH traded.
  • A bullish breakout on July 4 at 22:00 lifted ETH above $2,520, with resistance confirmed near $2,530.
  • ETH consolidated around $2,515 with signs of reduced volatility and an ascending recovery trendline after 13:40.
  • Momentum remains neutral short-term but structurally bullish given broader uptrend since late June.

Disclaimer: Parts of this article were generated with the assistance from AI tools and reviewed by our editorial team to ensure accuracy and adherence to our standards. For more information, see CoinDesk's full AI Policy.

No Need To Panic, Bitcoin’s Peak Still Coming In October 2025 – Analyst

Bitcoin prices dipped by 0.93% in the last day after the premier cryptocurrency suffered another price rejection in the $110,000 range. This latest price pullback forces Bitcoin to maintain a consolidatory movement that has dominated the majority of last month drawing speculations about a potential market top. Interestingly, prominent market analyst Ted Pillows has weighed in on this discourse stating that historical data shows that Bitcoin is yet to achieve a peak price for the current market cycle.

Bitcoin’s Consolidation: A Preparation For Final Bull Leg

In an X post on July 4, Ted Pillows shares a bullish market insight following another Bitcoin price dip. Notably, the premier cryptocurrency seemed on course to resume its market uptrend after a significant price rebound from $99,000 in late June following weeks of downward consolidatory movement. However, another decisive rejection in the $110,000 indicates Bitcoin’s prices remain range-bound thereby worsening investors’ concern across the market.

In interpreting this situation, Pillows has called for calm stating the recent price dip is merely a “leverage flush” that requires no panic. Using a visual study on the BTC weekly chart, the renowned analyst shows that the current and previous price pullbacks are part of a predictable pattern that has played out across previous Bitcoin cycles.

Bitcoin

The chart shows that after each halving event, Bitcoin tends to peak approximately 18 months (518 days) later. With the most recent halving occurring in mid April 2024, the expected peak for this cycle would fall somewhere around Q4 2025, specifically on October 13, 2025, consistent with historical performance.

Furthermore, a recurring 140-day rally window is also depicted in the chart, usually forming the final leg of the bull run. In each previous cycle, this 10-bar stretch delivered parabolic price movements. If history is rhyming once again, Bitcoin is now within range of initiating this 10-week bull run, suggesting the equivalent rally seen in previous could soon kick in.

How High Can Bitcoin Price Go?

Based on Pillows’ recent analysis, Bitcoin may be gathering momentum for its final rally of the present market cycle. The extent of this anticipated uptrend remains unknown; however, the presence of bullish factors most notably the high influx of institutional investment and the US pro-crypto policies supports a range of sky scraping targets.

For example, Pillows has previously shared that the popular stock-to-flow model which uses Bitcoin’s scarcity to project long-term price trajectory has predicted a potential price target of $368,925 by 2025 end. If this prediction holds true, Bitcoin investors are eyeing an estimated 242% from current market prices.

At press time, Bitcoin continues to trade at $108,299 reflecting a 0.83% gain in the past week. 

Bitcoin

Litecoin Fate Tied To Bitcoin – Will $96 Resistance Crack?

In a recent X post, CryptoWzrd highlighted that Litecoin (LTC) closed the day on a slightly bearish note. He explained that LTC’s price action remains closely tied to Bitcoin’s movement and overall market sentiment, with the $96 level standing out as the next resistance.

Bearish Daily Close For Litecoin Amid Bitcoin Correlation

According to CryptoWzrd, Litecoin closed the day with a bearish daily candle, while mirroring Bitcoin’s price action. This alignment suggests that LTC remains heavily influenced by broader market sentiment and BTC’s directional moves. Meanwhile, the LTCBTC pair ended the session indecisively, offering no clear signal of strength or weakness against Bitcoin at the moment.

The analyst noted that for a sustained upside move in Litecoin, healthier and more constructive candles are needed on the LTCBTC chart. Without stronger signals from this pair, confidence in a breakout remains limited. Adding to the cautious tone, CryptoWzrd pointed out that a decline in Bitcoin dominance would be a critical factor in unlocking altcoin momentum, including for Litecoin.

From a technical standpoint, Litecoin is currently aiming for the $96 daily resistance level. CryptoWzrd explained that a successful push above this barrier could open the door for a stronger rally, potentially extending toward the $128 resistance zone. However, that scenario depends on supportive market conditions and renewed strength across altcoin charts.

Litecoin

On the downside, $80 stands out as the key daily support level that traders should monitor. A breakdown below this zone could trigger a deeper correction and delay any near-term bullish ambitions. Maintaining support above this level would be crucial in preserving the broader structure and keeping upward targets in play.

Looking ahead, CryptoWzrd emphasized his focus on the lower time frames to spot potential scalp opportunities. By analyzing intraday chart formations, he aims to capitalize on short-term price movements while the broader market context unfolds. Traders following LTC closely will want to keep an eye on these short-term setups for quick entries and exits amid ongoing volatility.

Intraday Volatility Signals Patience Over Action

In conclusion, CryptoWzrd noted that today’s intraday chart for Litecoin was marked by volatility and a bearish tone, making it a challenging environment for clean trade setups. He emphasized the importance of waiting for a more favorable trading location before entering any positions, as the current conditions lacked clear direction and structure.

According to the analyst, a move above the $90 intraday resistance would be a positive signal and could present a potential long opportunity. However, if the price gets rejected at that level, it may lead to further downside pressure. For now, CryptoWzrd remains patient, waiting for the market to establish a healthier setup before taking action.

Litecoin

Pundit Predicts XRP Price Will Surge 35,000% When These Two Things Happen

Crypto analyst Ripple Pundit has boldly predicted that the XRP price can surge 35,000%. He alluded to two things that need to happen for the altcoin to reach this ambitious target. 

Factors That Will Make XRP Price Surge 35,000%

In an X post, Ripple Pundit stated that the XRP price will jump by over 35,000% on the day that Ripple makes their banking license public. He added that the SEC announcement of dropping its appeal will also boost the altcoin further. Ripple has applied for a national banking license with the Office of the Comptroller of the Currency (OCC). 

This move is expected to expand the crypto firm’s services, which is bullish for the XRP price, considering the altcoin’s role in Ripple’s payment solutions. As such, XRP is likely to record more adoption, especially from institutional investors, as the crypto firm onboard more clients through this banking license. 

Crypto pundit Vincent Van Code also agrees that a Ripple banking license could have a massive impact on the XRP price. He recently predicted that the altcoin could rally to between $30 and $50. It is also worth noting that Brad Garlinghouse declared his 1,000% commitment to XRP, which indicates that the altcoin remains a huge part of the company’s plans.

Meanwhile, as Ripple Pundit predicts, an SEC announcement of its decision to drop its appeal in the lawsuit against Ripple would also boost the XRP price. Ripple has already announced its decision to drop its cross-appeal. All that is remaining for the long-running legal battle to end is for the Commission to also drop its appeal. A conclusion of the lawsuit would finally remove the legal uncertainty that had plagued the altcoin for a long while. 

The Next Wave For XRP Starts Here

In an X post, crypto analyst CasiTrades declared that the next wave for the XRP price starts from the $2.23 level. She claimed that the altcoin has continued to show strength during this consolidation. The analyst added that the Ripple bank charter application added serious momentum at just the right time. The news helped push XRP above the $2.25 resistance

Commenting on the current price action, CasiTrades stated that the XRP price is now seeing rejection at $2.268, which is the .382 retracement of the local wave. She remarked that this suggests that XRP needs another low before launching higher. The analyst said that based on the technical indicators, the next best entry is lining up at $2.235. She explained that this level is the .236 retracement and that multiple internal subwave targets are clustering there. 

At the time of writing, the XRP price is trading at around $2.22, down in the last 24 hours, according to data from CoinMarketCap.

XRP

Crypto, Cash, and Condos: Singapore Ends $2.2B Laundering Case With Fines

Singapore fined nine financial firms, including UBS and Citigroup, S$27.5 million ($21.5 million) after a probe into the country’s largest money laundering scandal, which involved the seizure of assets ranging from luxury real estate to cryptocurrency.

The Monetary Authority of Singapore (MAS) announced that Credit Suisse’s local unit, now part of UBS, faced the biggest penalty of S$5.8 million for gaps in anti-money laundering (AML) controls, Bloomberg reported. Citigroup’s Singapore business was also fined for compliance lapses.

The enforcement wraps up a two-year investigation into a sprawling S$3 billion ($2.2 billion) case revealed in 2023.

Ten individuals of Chinese origin, dubbed the Fujian gang, were convicted, while two ex-bankers were charged last year for their involvement.

Authorities seized cash, property, high-end goods, and cryptocurrency linked to the case. Involved firms are taking remedial steps, and the regulator plans to monitor progress closely.

Bitcoin Cash Rally Accelerates on Whale Activity and Bullish Technical Signals

Bitcoin Cash (BCH) traded at $482.54 on July 5, down 0.23% over the past 24 hours, following a broader retreat from its recent multi-month high, according to CoinDesk Research's technical analysis model. As for the broader crypto sector as gauged by the CoinDesk20 Index (CD20), it is up 0.27% during the same period.

On July 1, BCH reached $526.5 — its highest price in eight months — as market enthusiasm, whale accumulation, and speculative inflows helped propel the token more than 75% higher over the past three months.

The surge, briefly taking BCH above $528, coincided with a substantial increase in daily trading volume, which tripled to over 120,000 tokens exchanged within a 24-hour span. Much of the buying interest was attributed to capital rotation into mid-cap cryptocurrencies, as investors sought gains beyond the majors during a period of broader crypto market strength.

On-chain fundamentals, however, remain lackluster. Daily active BCH addresses have dropped to a six-year low, suggesting that the rally is being driven more by speculation than by increased network utility. Despite this disconnect, technical indicators point to further upside potential. In late June, a golden cross formation appeared on BCH’s hourly chart—where the 50-day moving average crossed above the 200-day MA—a historically bullish signal.

Adding to the speculative momentum, open interest in BCH derivatives rose 27.4% this past week to $578 million. Analysts are watching the $478 to $508 range closely, viewing it as a key support zone that could stabilize the current pullback.

On July 4, analytics firm IntoTheBlock reported a 122.45% increase in large whale transactions involving over $100,000 in BCH, totaling 957,440 tokens worth approximately $482 million. This sharp rise in high-value transfers echoed earlier activity spikes seen in February, May, and late June—all of which preceded major price movements.

A separate development on July 5 raised further intrigue, when a 10,000-BCH transaction worth roughly $5 million was flagged just prior to the historic movement of 80,000 dormant BTC — valued at over $8.5 billion. Experts suggest the BCH transfer may have served as a key test of wallet access before executing the massive Bitcoin transaction, which was the largest of its kind in over a decade.

Meanwhile, the Bitcoin Cash Foundation published its July 1 update highlighting the release of Knuth v0.68.0, which unifies the node’s codebase and lays the groundwork for future UTXO efficiency upgrades. While no major adoption headlines emerged this week, smaller community projects continue to explore BCH-based micropayments and NFTs. Roger Ver, a longtime proponent of Bitcoin Cash, remains publicly active in promoting BCH as a scalable alternative to bitcoin, though his recent advocacy has not been accompanied by any new institutional product launches.

Technical Analysis Highlights

  • BCH traded within a $7.52 (1.57%) range between $481.83 and $489.35 from July 4 15:00 to July 5 14:00.
  • Strong support was observed at $481.83 with elevated volume during the 04:00 hour on July 5.
  • Resistance formed at $489.43, where repeated selling pressure capped gains.
  • From 13:06 to 14:05 UTC on July 5, BCH gained $1.20 (0.25%), briefly breaking above $483.25 on rising volume.
  • Support in the final minutes of the session formed between $483.35 and $483.45, with price peaking at $483.81 during the 14:03 candle.

isclaimer: Parts of this article were generated with the assistance from AI tools and reviewed by our editorial team to ensure accuracy and adherence to our standards. For more information, see CoinDesk's full AI Policy.

U.S. Exceptionalism Is Alive and Well as Nasdaq Outperforms Global Peers: Macro Markets

U.S. exceptionalism, the notion that the U.S. economy and its financial markets are distinct compared to those of other nations, remains alive and well, at least according to the equity markets.

Since the early April slide, Wall Street's tech-heavy Nasdaq index has surged 31%, while the broader S&P 500 index has rallied 24%, according to data source TradingView. Other major indices, such as Germany's DAX, France's CAC, Japan's Nikkei, and China's Shanghai Composite, have lagged behind Wall Street.

Both Nasdaq and the S&P 500 traded at record highs Thursday. Demand for U.S. Treasury notes has held up amid concerns about fiscal sustainability, as noted by CoinDesk last month.

The data contradicts the popular narrative that capital flows are rebalancing away from the U.S. en masse due to debt jitters and President Donald Trump's trade war and repeated criticism of the Federal Reserve.

“Several key factors that underpinned U.S. exceptionalism remain fully intact and are perhaps even strengthening further,” Hani Redha, portfolio manager, head of strategy and research for global multi-asset at PineBridge Investments, wrote in a blog post published last month.

Redha pointed to deregulation under Trump as a key factor supporting the US’s productivity supercycle – unique among global peers – and its lead globally.

Economy validates U.S. exceptionalism

Other economic variables, such as the real per capita GDP growth, also support the exceptionalism narrative. The metric measures the rate at which the value of goods and services produced per person in an economy is adjusted for inflation.

“The U.S. massively outperforms the EU in terms of real per capita GDP growth. The reasons for that are deeply structural and haven't changed one bit. U.S. exceptionalism – for growth at least – is here to stay…,” Robin Brooks, senior fellow in the Global Economy and Development program at the Brookings Institution, said on X.

The U.S. jobs data released Thursday further added another stake in the ‘loss of American exceptionalism narrative, as Bruce J Clark, head of rates at Informa Global Markets, said on LinkedIn.

Implications for BTC and DXY

The return of U.S. exceptionalism to U.S. stocks can be viewed as a positive development for bitcoin (BTC) and the broader crypto market, given the historical positive correlation between the two.

BTC, the leading cryptocurrency by market value, has already risen 44% to $108,000, rallying swiftly from the early April lows of nearly $75,000, according to CoinDesk data. Moreover, with the pro-crypto president in the White House, one may argue that bitcoin is part of the U.S. exceptionalism play.

Meanwhile, the return of U.S. exceptionalism could also put a floor under the U.S. dollar. “With today’s jobs data putting another stake in the ‘loss of American exceptionalism’ narrative, the temptation to get long dollars here for a counter-trend trade is big and growing,” Clark noted, adding the ECB officials' growing discomfort with the strong euro.

Early this week, the FT reported, quoting a senior ECB official, that the central bank may need to signal that too much strengthening in the euro could be an issue, as it might lead inflation to hover below targets. Meanwhile, in an interview with Bloomberg, ECB Vice President Luis de Guindos said that “overshooting” of the euro should be avoided, flagging levels above 1.20 as complicated.

Drake Compares Fake Friends to Bitcoin’s Volatility: ‘Down This Week, Up Next’

Drake’s latest track, “What Did I Miss,” features lyrics about betrayal, luxury, and bitcoin. The rapper compares fickle friends to the cryptocurrency’s rollercoaster price moves, saying he looked at it “like a BTC”: “Could be down this week, then I’m up next week.”

It’s not the first time bitcoin has appeared in Drake’s orbit. In the past few years, the Canadian superstar has become one of crypto’s most visible celebrity community members.

The rapper shared a clip of Michael Saylor on his Instagram account, which at the time had over 146 million followers, where Strategy’s co-founder said bitcoin would “eat” gold.

He’s also dropped more than $1 million worth of bitcoin on losing bets for the Dallas Mavericks and Edmonton Oilers, with other high-profile punts on UFC fights and Formula One races.

Drake’s betting performance has inspired memes calling it the “Drake Curse,” referencing losses in the teams and athletes he bets on. The rapper addressed that curse, telling fans he’s just a “flawed sports bettor.”

Yet Drake isn’t just rolling dice. He has partnered with crypto gambling platform Stake, in a partnership that’s reported to be worth $100 million annually.

Outside the casino lights, Drake has made crypto investments in firms, including MoonPay and brandished hardware wallets on social media.

Interestingly, Drake’s nod to bitcoin’s volatility comes at a time that’s being interpreted as the calm before the storm. Deribit’s bitcoin volatility index (DVOL) has, in fact, dropped to a near two-year low at 38.

FLOKI Advances Blockchain Gaming Ambitions With Valhalla Mainnet Launch and Esports Partnership

FLOKI FLOKI traded near $0.00007417 on July 5, up 1.32% over the past 24 hours, according to CoinDesk Research's technical analysis model. As for the broader memecoin sector as gauged by the CoinDesk Memecoin Index(CDMEME), it is up 1.79% during the same period.

Although FLOKI is often categorized as a meme coin, its ecosystem has long featured gaming-related functionality, including NFT-based characters, play-to-earn mechanics, and token integration for in-game rewards. But the launch of the Valhalla mainnet marks its most ambitious gaming milestone to date.

On June 30, 2025, FLOKI officially launched Valhalla, a blockchain-based game inspired by Norse mythology. The game runs on opBNB, a Layer-2 network designed to enable fast and inexpensive transactions. Players take control of Veras — customizable NFT characters — in a browser-based, turn-based tactical MMORPG that blends combat, exploration, and questing with blockchain-backed rewards. The play-to-earn economy is built around FLOKI tokens, which players earn by completing in-game tasks and winning battles.

To support the game’s rollout, the FLOKI team has committed millions of dollars from its treasury to fund development, marketing campaigns, and in-game incentives. That long-term investment signals the project’s intention to build a sustainable blockchain gaming ecosystem rather than a short-term promotional play.

And on June 27, FLOKI announced a partnership with Method, a well-known esports organization recognized for its World of Warcraft dominance. Method will serve as a strategic content partner, producing onboarding materials, game guides, and live coverage to help Valhalla appeal to both traditional gamers and crypto-native audiences. The partnership will include branded jerseys and appearances in gaming tournaments throughout 2025 and 2026, designed to grow Valhalla’s player base and community awareness.

These developments represent a pivotal moment in FLOKI’s evolution, as the project attempts to move beyond its meme origins and establish itself at the intersection of Web3 technology, entertainment, and digital asset ownership.

Technical Analysis Highlights

  • FLOKI rose 4.7% from $0.0000749 to $0.0000741 during the 24-hour window from July 4 15:00 to July 5 14:00.
  • Peak price of $0.0000762 was recorded at 06:00 on July 5.
  • A breakout at 06:00 was accompanied by the session’s highest volume spike of 44.98 billion tokens.
  • Support formed near $0.0000737; resistance was established around $0.0000762.
  • Last-hour trading (13:06 to 14:05) saw a V-shaped recovery from $0.0000740 to $0.0000741.
  • A 3.08 billion token volume spike at 13:41 confirmed support around $0.0000742.

Disclaimer: Parts of this article were generated with the assistance from AI tools and reviewed by our editorial team to ensure accuracy and adherence to our standards. For more information, see CoinDesk's full AI Policy.

WIF Holds Key Support as Whales Accumulate Over 39M Tokens

Dogwifhat (WIF) continues to draw attention amid volatile market conditions, with the token consolidating around $0.8319 after dipping 1.17% over the past 24 hours, according to CoinDesk Research's technical analysis model. As for the greater memecoin section as gauged by the CoinDesk Memecoin Index(CDMEME), it is up 1.79% during the same period.

Price action formed a 5.1% range from $0.821 to $0.864, with critical support confirmed near $0.835 on significant volume. A sharp rally earlier this week to $0.92 drew profit-taking, but technical strength remains as WIF holds above its new local floor.

Blockchain analytics show whale wallets have accumulated more than 39 million tokens, a pattern that aligns with broader memecoin rotation underway across Solana-based assets. This trend comes as BONK surged earlier on ETF speculation, while WIF retests key zones with declining volume and fewer short liquidations.

The passage of President Trump’s “One Big Beautiful Bill” by Congress earlier this week brought short-term calm to risk markets. Combined with better-than-expected U.S. jobs data, sentiment around risk assets improved marginally, reducing macro-related selling pressure. Even as broader crypto faces headwinds from shifting trade and monetary policy dynamics, WIF's on-chain fundamentals remain constructive.

With derivatives markets booming — Binance has now facilitated $650 trillion in cumulative BTC futures volume — attention is turning to retail-driven tokens that continue to show resilience. If WIF maintains support and volume rebounds, a retest of $0.86 may be in play.

Technical Analysis Highlights

  • WIF traded between $0.821 and $0.864 over the 24-hour window ending July 5 at 14:00 UTC.
  • High-volume bounce from $0.835 to $0.861 confirmed strong support level.
  • Whale accumulation spiked during a 60.7M token volume surge over a 9-hour session.
  • In the final hour (13:06–14:05 UTC), WIF rebounded from $0.828 to $0.831.
  • Resistance formed at $0.838 with heavy sell pressure at 13:25–13:26.
  • Temporary support held at $0.828 after sharp sell-off between 13:54–13:56.
  • Modest late-session recovery hints at short-term consolidation range.

Disclaimer: Parts of this article were generated with the assistance from AI tools and reviewed by our editorial team to ensure accuracy and adherence to our standards. For more information, see CoinDesk's full AI Policy.

Crypto Market Cap On Track To $4.5 Trillion As Q3 Unfolds – Details

Popular market analyst and key opinion leader (KOL) Ted Pillows is projecting the crypto market to hit a $4.5 trillion valuation before Q3 2025 ends. This interestingly bullish forecast comes off the back of another Bitcoin price rejection allowing the total crypto market cap to maintain the choppy price movement seen in the last month.

Rally Ahead? Crypto Market Tests $3.5T Barrier

In an X post on July 4, Pillows shares an insightful technical analysis on the total crypto market cap. Using the daily CryptoCap chart from Tradingview, the renowned analyst highlights the recent formation of a bull flag hinting at an impending price breakout.

For context, the bull flag is a classic bullish continuation pattern. It starts with the formation of a flagpole i.e. a strong upward price movement, as seen between early April to late May when Bitcoin reached a new all-time high. This structure is followed by the “flag,” i.e., a descending price channel that reflects a period of consolidation. This market action is seen from late May to the present, as the crypto market cap entered a temporary pullback phase.

Crypto

Pillows’ analysis shows a complete bull flag formation. However, the crypto market cap must achieve a decisive price close above the $3.5 trillion mark which represents the upper boundary of the flag to confirm a price breakout. If this bullish scenario occurs, Ted Pillows predicts the crypto total market cap to surge to around $4.3 trillion – $4.5 trillion in Q3 2025.

Considering its market dominance levels of 62.77%, Bitcoin’s market cap could also rise to around $2.82 trillion in such bullish conditions providing a market price of $141,800 per unit. However, it’s worth noting that the occurrence of an altseason amidst this crypto price surge could alter the projected market status for the premier cryptocurrency.

Crypto Market Overview

According to data from Coingecko, the total cryptocurrency cap is presently valued at $3.39 trillion following a 5.21% decline in the past day in line with the negative price changes with the Bitcoin market. However, the ongoing crypto bull run has delivered an impressive 51.24% gain over the past year.

The market leader, Bitcoin, is presently valued at $108,118 reflecting a 1.46% loss in the last 24 hours as previously stated. The maiden cryptocurrency is also witnessing a 14.40% fall in daily trading volume indicating crash in transactions and market activity. 

crypto

U.S. Recession Odds on Polymarket Plunge to 22% as Trade Tensions Cool

Bets on a U.S. recession in 2025 have dropped sharply, with odds on crypto prediction platform Polymarket sinking to 22% this week, the lowest level since late February.

Recession fears ballooned earlier this year when the Atlanta Federal Reserve’s GDPNow indicator predicted a 1.5% contraction for the first quarter of the year, while the actual fall was softer at 0.5%.

Tensions escalated in March as U.S. President Donald Trump announced a series of reciprocal tariffs on what he branded “Liberation Day,” rattling investors already wary of a slowing economy. The Fed’s decision to slow the pace of shrinking its balance sheet added fuel to concerns.

By April, Wall Street giants like Goldman Sachs and JPMorgan were raising red flags. Goldman put recession odds at 45% at the time, and Polymarket odds climbed as high as 66%. Another spike came in May after former U.S. Treasury Secretary Janet Yellen warned that Trump’s tariffs could have a “tremendously adverse” effect on the economy.

Yet behind the headlines, negotiations with China progressed. The market coined the so-called TACO (Trump Always Chicken Out) trade, referencing the U.S. President’s negotiations pattern, where tariffs are announced but then reversed.

Goldman Sachs cut its 12-month recession odds to 30% last month, reflecting a more optimistic outlook as financial conditions eased and trade threats receded.

Whether a recession hits in 2025 remains uncertain. On Polymarket, a recession bet pays out if the National Bureau of Economic Research declares one or if the U.S. posts two straight quarters of negative GDP growth.

Ex-ECB Official Urges Europe to Back Euro Stablecoins or Risk Losing Financial Power

Stablecoins are growing fast. Most of the $255 billion sector is currently concentrated in U.S. dollar-backed tokens, which account for $241 billion of that total, according to RWA.xyz data.

Former European Central Bank board member and chair of Société Générale, Lorenzo Bini Smaghi, has said that the imbalance could sideline Europe in the next phase of global finance.

Writing in the Financial Times, Bini Smaghi noted that the European Union already has the Markets in Crypto-Assets (MiCA) law, which forces issuers to back tokens with cash and high-grade sovereign bonds.

The bloc also runs a pilot regime for trading on distributed ledgers. Yet the euro barely features in today’s stablecoin market because banks and policymakers shy away from the new technology, he wrote.

Société Générale, it’s worth adding, launched its own euro-backed stablecoin back in 2023. Last month, it also launched a U.S. dollar-backed one.

He says the hesitation risks European monetary sovereignty. If consumers and companies adopt dollar stablecoins for everyday payments and savings, deposits could drain from euro-area banks to US-linked platforms.

That shift would erode the ECB’s grip on money flows and blunt its ability to steer rates or calm markets, Bini Smaghi added. He argued that regulators should lean in, not block progress.

By sponsoring euro-pegged tokens and coordinating standards, the ECB could modernize cross-border payments and help unify Europe’s capital markets.

Should Europe stay on the sidelines, “it will be accepting its marginalization in the future of global finance,” he wrote.