Expert Says Bitcoin Price Has Topped And Is In Exponential Decay, Why This Is Not A Bad Thing

Crypto expert Peter Brandt has boldly claimed that the Bitcoin top for this market cycle may already be in. He made this conclusion based on his “exponential decay” thesis, which he noted may actually be good for the Bitcoin ecosystem.

Why Bitcoin’s Price Has Topped

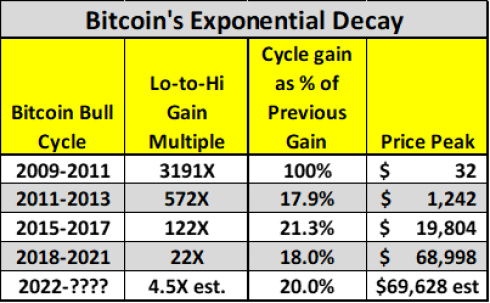
Brandt explained that historical data suggests that Bitcoin’s price has topped. He further alluded to an “exponential decay,” which he noted could be used to describe Bitcoin. Brandt’s exponential decay thesis is based on the fact that Bitcoin’s percentage gain has significantly reduced in every subsequent bull cycle. 

For context, Bitcoin, according to the crypto expert, recorded a 122x increase from its market low to market high between 2015 and 2017. However, that was only 21.3% of Bitcoin’s price gain in the previous cycle (between 2011 and 2013).

Bitcoin price

Source: X

Brandt further noted that the same thing happened between 2018 and 2021. Despite a 22x increase from its market low to market high, Bitcoin only recorded 18% of the price increase it saw in the previous cycle. Having laid this premise, the crypto expert concluded that this market cycle shouldn’t be any different as Bitcoin will likely see about 20% of the price gain recorded in the previous cycle. 

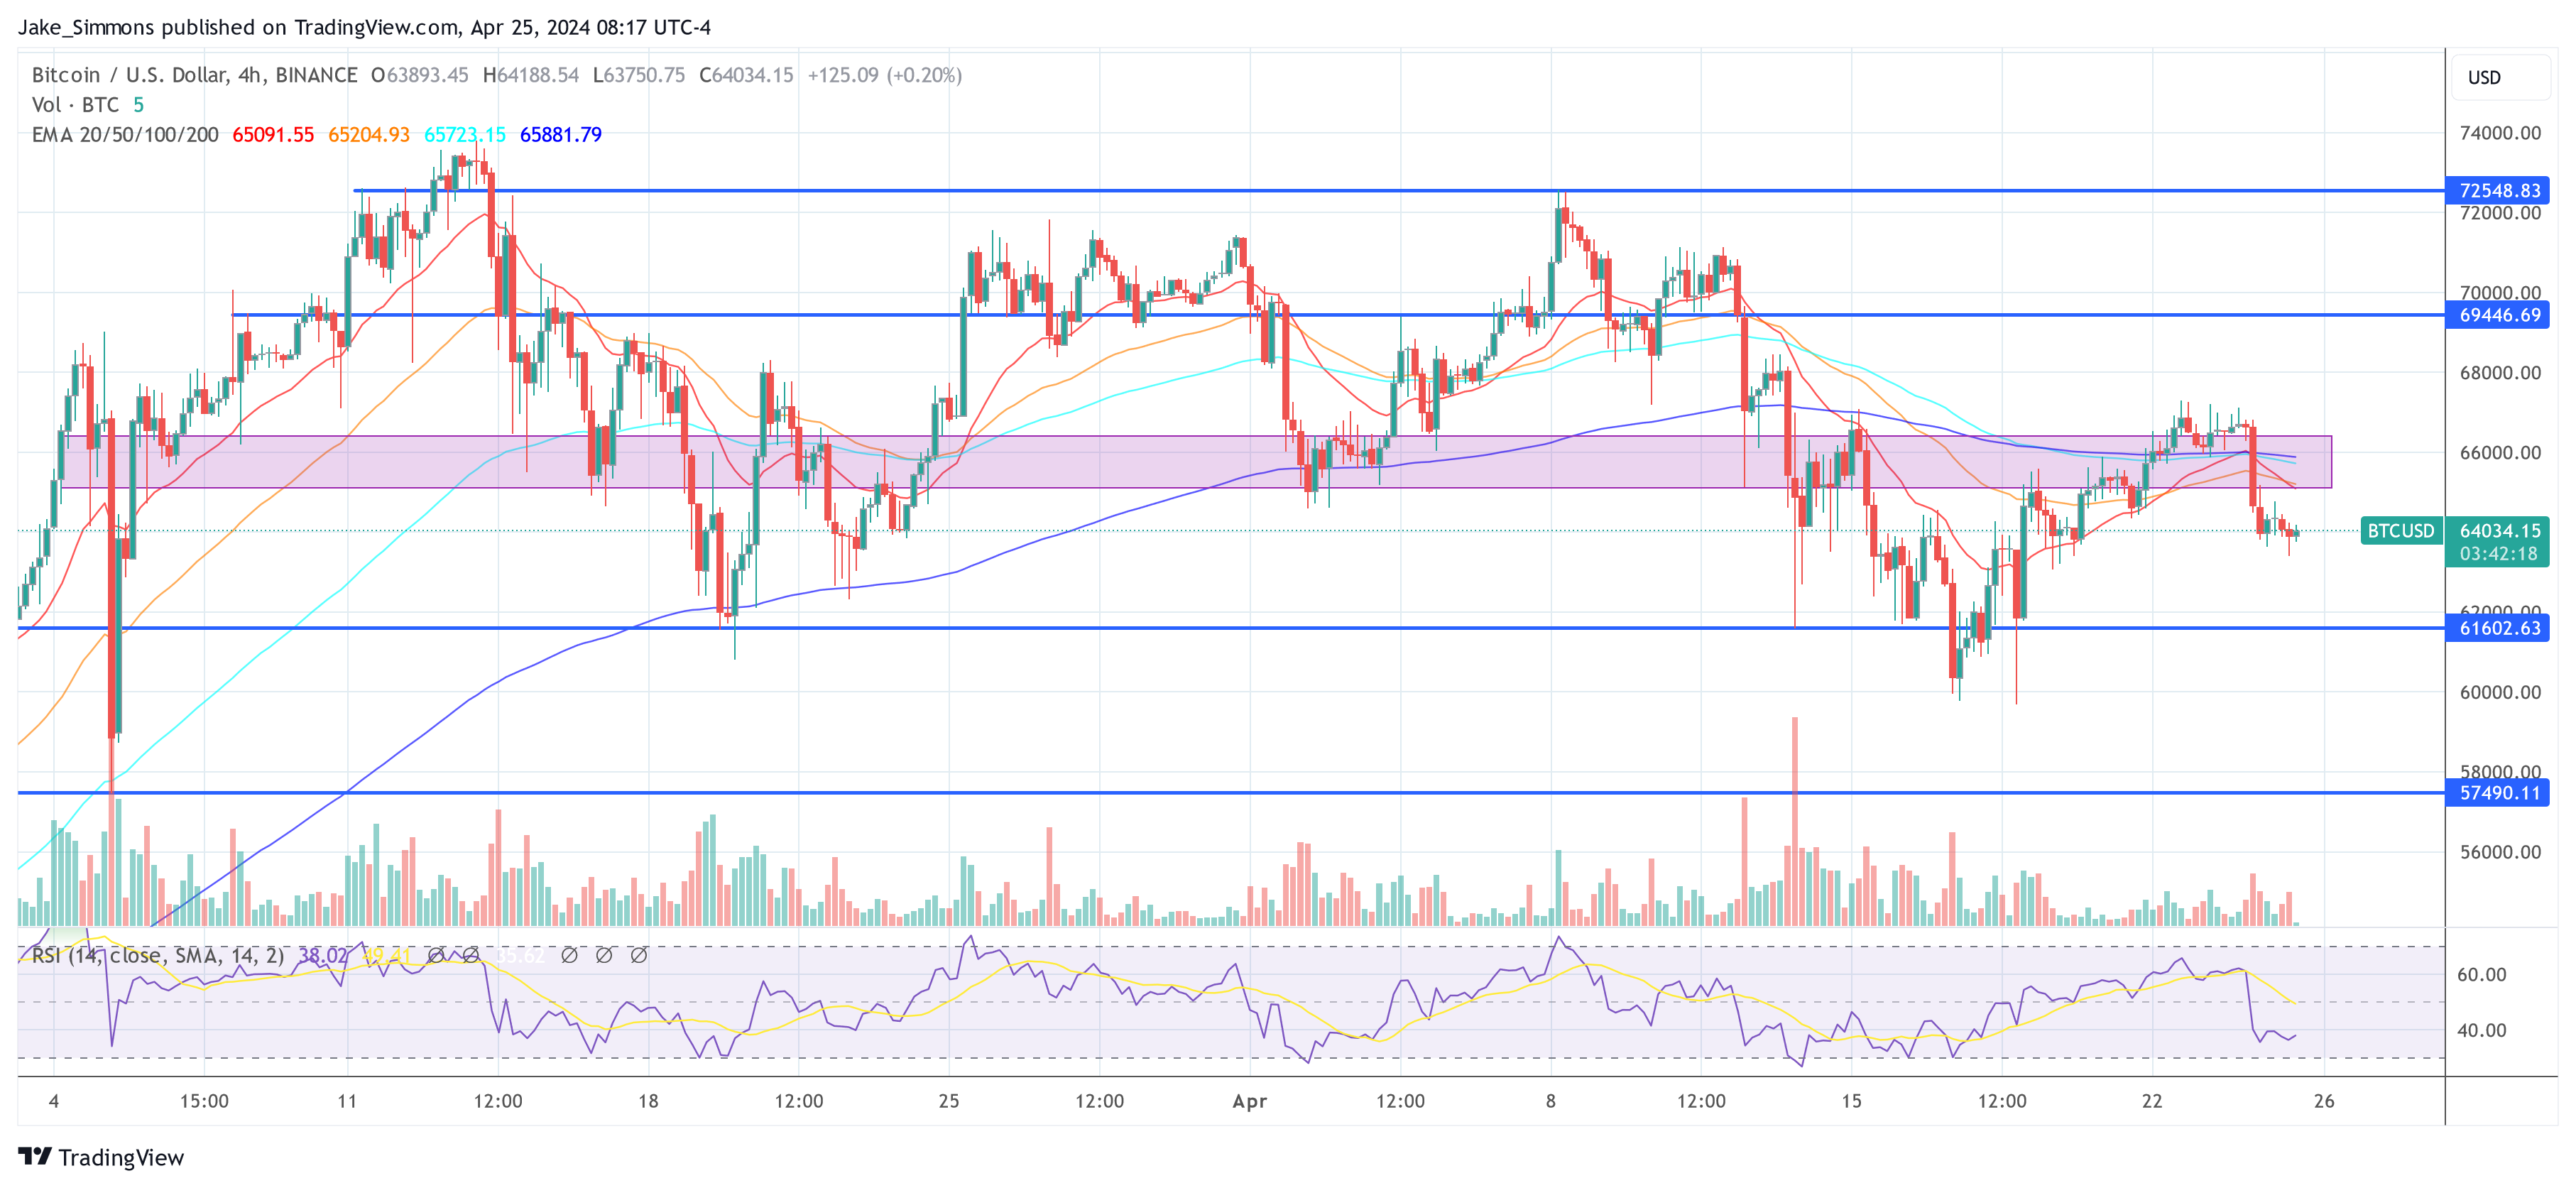
Taking $15,473 as the market low for this cycle, he noted that 20% of the previous cycle’s gain would mean that the market high for this cycle was supposed to be $72,723, a price level that Bitcoin already hit on its way to a new all-time high (ATH) of $73,750. 

Meanwhile, the crypto expert acknowledged that Bitcoin historically records its most price gains after the Bitcoin halving, which just recently occurred. However, he added that the crypto community has to deal with the fact of the exponential decay, which has made him believe there is a 25% chance that Bitcoin has already topped this cycle.”

Why The Exponential Decay Might Be Bullish For Bitcoin

Brandt mentioned that Bitcoin would likely drop to the mid $30,000 or its 2021 lows if it has indeed topped. He, however, added that this decline could be the “most bullish thing that could happen from a long-term view.”

Related Reading: Brace For Price Impact: Dogecoin Whales Move Massive 456 Million DOGE To Exchanges

From a “classical charting point of view,” the crypto expert hinted that Bitcoin was still primed for major parabolic moves to the upside, even though it doesn’t happen now. 

He also shared an example of what Bitcoin’s chart could look like when this move happens with the crypto token rallying above $100,000. Brandt also alluded to Gold’s chart from August 2020 to March 2024 as an example of what Bitcoin’s price action could look like soon enough. Interestingly, he recently predicted that Bitcoin will soon be “King over Gold.”

Bitcoin price chart from Tradingview.com

Forbes Unveils 20 Crypto ‘Zombies,’ Declares Ripple And XRP Among The Undead

In a controversial report, Forbes unveiled a list of 20 “crypto billion-dollar zombies,” Layer 1 (L1) tokens, which the news outlet defines as crypto assets with substantial valuations but “limited utility beyond speculative trading.” 

These cryptocurrencies and projects include Ripple, XRP, Ethereum Classic (ETC), Tezos (XTZ), Algorand (ALGO), and Cardano (ADA), among others. 

XRP And Ethereum Classic In The Spotlight

Ripple Labs, the company behind XRP, was highlighted as a prominent crypto zombie. Despite XRP’s active trading volume of around $2 billion daily, Forbes asserts that the token’s primary purpose remains “speculative” and “lacking meaningful utility.” 

However, Ripple Labs and XRP are not alone in this regard. Forbes reveals that 50 blockchains, excluding Bitcoin (BTC) and Ethereum (ETH), currently trade at values surpassing $1 billion, with at least 20 of them classified as “functional zombies.” Collectively, these 20 blockchains hold a market value of $116 billion, despite having “limited user bases.”

Crypto

According to Forbes, an example of a “functional zombie” is Ethereum Classic, which maintains the distinction of being the original Ethereum chain. 

While ETC has a market value of $4.6 billion, its fee generation in 2023 was less than $41,000, raising questions about the blockchain’s viability for the news organization.

Another crypto project in Forbes’ report is Tezos, which raised $230 million through an initial coin offering (ICO) in 2017. 

Tezos’ XTZ token currently holds a market capitalization of $1.2 billion. However, the blockchain’s fee earnings were meager, with $5,640 in February 2024 and a total of $177,653 for all of 2023. 

Algorand, once hailed as an “Ethereum killer” due to its capability of processing 7,500 transactions per second, faces similar challenges. 

Despite a market cap of $2 billion and a treasury holding of $500 million, Algorand earned $63,000 in blockchain transaction fees throughout 2023. For Forbes, this casts doubt on its actual adoption and utility.

Crypto ‘Zombie’ Blockchains

The zombie blockchains are categorized into two groups by Forbes: spin-offs and direct competitors to established blockchains like Bitcoin and Ethereum. 

Spin-off zombies include Bitcoin Cash (BCH), Litecoin (LTC), Monero (XMR), Bitcoin SV (BSV), and Ethereum Classic. 

These blockchains, collectively valued at $23 billion, reportedly emerged from “disagreements” among programmers regarding the governance and direction of the original chains

Forbes notes that when such conflicts arise, hard forks occur, resulting in new networks that share the same transaction history as their predecessors. The agency claims that their market value “often exceeds” their real-world usage.

Overall, The report highlights a growing disparity between the valuations of certain projects in the cryptocurrency industry and their actual utility and usage. Consequently, Forbes refers to these projects as “zombies.”

Crypto

Featured image from Shutterstock, chart from TradingView.com 

Expert Makes Bold Call: It’s Time To Swap Your Dollars For Bitcoin

Billionaire investor Anthony Scaramucci, the founder of SkyBridge Capital, recently discussed the viability of financial assets. He took to X, a social media platform previously known as Twitter and owned by Elon Musk, to highlight the decreasing purchasing power of the United States dollar in comparison to the potential of Bitcoin (BTC).

US Dollar Vs. Bitcoin Value Performance

In the post on X, the SkyBridge Capital founder pointed out that a dollar from 2020 is now only worth about 75 cents, underscoring a significant devaluation due to inflation.

According to Scaramucci, this scenario illustrates why investors should reconsider traditional fiat currencies as a reliable store of value, advocating instead for the inherent benefits of digital assets like Bitcoin.

Scaramucci’s critique comes at a time when the global economy grapples with heightened inflation rates, which have eroded the real value of fiat money.

He specifically cited a “25.14% compounded inflation rate” as a critical indicator of why the dollar is losing ground. In contrast, Bitcoin has not only maintained a strong profile but has also appreciated in value, further cementing its position as a viable hedge against inflation and a potential safe haven for investors.

So far, Bitcoin’s market performance has been quite appealing. Particularly, despite the significant downturn experienced in the past few years, the asset has managed to come out of the bloodbath and recently soared to an all-time high above $73,000 in March.

This peak performance labels Bitcoin as not just a digital asset but a major player in the global financial landscape.

However, despite Scaramucci’s bullish outlook, it’s worth noting that Bitcoin has seen its share of volatility. It has been struggling to maintain its appeal recently, with a modest 0.9% increase in the last 24 hours – a slight recovery from a 2% drop over the past week.

Bitcoin (BTC) price chart on TradingView

BTC Shifting Market Sentiments

Further insights into the market’s behavior towards Bitcoin reveal changing dynamics. Data from CryptoQuant highlighted a negative turn in the Bitcoin funding rate for the first time since October 2023, indicating a cooling interest in speculative trading on the asset.

This shift suggests that while the long-term outlook might still be strong, short-term investor sentiment has become cautious, possibly awaiting clearer signals before making further commitments.

The current market sentiment is also reflected in the technical analysis of a prominent crypto analyst, Ali. In Ali’s recent post on X, a notable mention was made of a “death cross” seen in Bitcoin’s 12-hour chart, where the short-term moving average dips below a long-term counterpart, traditionally a bearish signal.

Additionally, the Tom Demark (TD) Sequential indicator points to potential price reversals after a consistent trend, adding another layer of complexity to Bitcoin’s trading strategy.

Despite these potentially bearish indicators, on-chain data from Santiment shows an interesting trend: Bitcoin whales have increased their holdings significantly, now owning 25.16% of the total supply.

This accumulation suggests that while retail sentiment may be bearish, large-scale investors are seeing the dips as buying opportunities, potentially prepping for a future bullish run.

Featured image from Unsplash, Chart from TradingView

Timing The Breakout: When Will Bitcoin Escape The Post-Halving Consolidation?

Bitcoin (BTC), the largest cryptocurrency in the market, has been trading within a re-accumulation range between the $59,000 and $70,000 price levels for the past month and a half. 

Crypto analyst Rekt Capital recently shared its perspective on this phase and its potential duration, drawing from historical patterns and data in a post on social media platform X (formerly Twitter).

Breakout Timing And Historical Patterns

According to Rekt’s analysis, Bitcoin tends to experience a re-accumulation range following the Halving event, which occurs every four years to counteract any inflationary effect on Bitcoin by lowering the reward amount for miners and maintaining scarcity. 

Historically, This consolidation phase lasts up to 150 days before Bitcoin breaks into a parabolic uptrend. Based on this pattern, if Bitcoin continues to consolidate for the next 150 days, Rekt suggests a breakout would be expected in September 2024.

The ideal duration of a re-accumulation range is crucial in determining Bitcoin’s future trajectory. Rekt Capital noted that when Bitcoin reached a new all-time high (ATH) of $73,700 in mid-March, it accelerated its cycle by 260 days. However, with over 49 days of consolidation, the acceleration has reduced to approximately 210 days.

Resetting The Bitcoin Halving Cycle

Repeating historical trends, where Bitcoin consolidates for 150 days after the Halving, would still indicate an acceleration in the current cycle, albeit by a lesser extent of 60 days. 

Nevertheless, Rekt contends that Bitcoin would ideally need to consolidate for at least 210 days to fully resynchronize with its historical Halving cycles and reset the current acceleration in this cycle to 0. This would bring the rate of acceleration to 0 days and potentially lead to a breakout around November 2024.

The analyst further suggested that to achieve a 200+ day post-Halving consolidation and fully resynchronize with historical Halving cycles, Bitcoin would need to replicate its mid-2023 re-accumulation range, which lasted 224 days before a new uptrend emerged. Rekt concluded:

Overall, how long this current Re-Accumulation Range will last will dictate the remaining acceleration in this cycle and ultimately influence where Bitcoin will finally peak in its Bull Market. 

Bitcoin

The largest cryptocurrency, with a market capitalization of $1.2 billion, is currently trading at $64,400, showing minimal fluctuations compared to Thursday’s price movements. 

Recently, Bitcoin has encountered resistance at the $66,000 level, hindering its ability to consolidate above this threshold. Conversely, the $63,400 level may serve as a support base for the cryptocurrency in the event of heightened downward volatility over the weekend.

Featured image from Shutterstock, chart from TradingView.com

Bitcoin Under Pressure But Whales Hold Over $331 Billion Of BTC: A Sign To Buy?

While Bitcoin prices struggle for momentum and are caged inside a narrow range, on-chain data tells a different story. Taking to X, one analyst notes that whales, which are large crypto holders, are actively accumulating the world’s largest coin by market cap. 

BTC whales accumulating | Source: Analyst via X

Bitcoin Whales Accumulating Despite Weakness

By the time this data was shared, Bitcoin whales held over 5.1 million BTC worth a staggering $331 billion. That there is still demand when the coin moves in a narrow range flies in the face of recent market weakness and skeptics betting on even more price dumps.

Currently, Bitcoin is inside a range, with caps at $73,800 and $60,000. Despite overall market confidence, the coin has failed to pull higher, breaking above $70,000 even after Halving on April 20. Even though prices are firm, the absence of follow-through after April 21 and 22 hints at weakness.

Bitcoin price trending sideways on the daily chart | Source: BTCUSDT on Binance, TradingView

From the BTCUSDT price chart, the coin could explode should it break above the middle BB. If the leg up is accompanied by positive fundamental events, momentum could push the coin to all-time highs.

On the flip side, BTC is likely to slip even lower should sellers flow back. The sharp rejection of bulls on April 24 is bearish. As such, this might set a wave of lower lows in motion, taking the coin below April 2023 lows.

Traders Panicked Sold, Register Huge Losses

Parallel market data shows panic sellers on Binance and OKX, two major crypto exchanges by trading volumes, have dumped a combined 5,137 BTC at a loss over the past two weeks. As data shows, prices have been weaving lower during this time, with bulls failing to counter the dump, especially after two consecutive losses on April 12 and 13.

Meanwhile, there have been sharp outflows from ARKB, the spot Bitcoin exchange-traded fund (ETF). Data shows that ARKB sold 490 BTC, worth $31 million, on April 25. This is the third-largest single-day outflow in history.

ARKB outflows | Source: Analyst via X

Recent price pressures on BTC coincide with a marked drop in spot ETF inflows in the second half of April. On April 25, Lookonchain data revealed that GBTC and all the nine spot ETF issuers decreased over 2,100 BTC worth roughly $135 million.

Crypto Analyst Predicts Massive Move For Bitcoin, What’s The Target?

Despite BTC’s recent unimpressive price action, crypto analyst Doctor Profit has shared his bullish sentiment for Bitcoin and the broader crypto market. The analyst further suggested that a parabolic move was imminent and that crypto investors should position themselves accordingly. 

Crypto Market Preparing For A “Third Industrial Revolution”

Doctor Profit mentioned in an X (formerly Twitter) post that the crypto market “is preparing itself for the third Industrial Revolution,” thereby hinting at a trend reversal for Bitcoin and altcoins soon enough. “Be part of it, or regret for [a] lifetime,” the crypto analyst added as he warned crypto investors of missing this market rally.  

Related Reading: HBAR Prices Crashes 35% As BlackRock Denies Any Ties To Hedera

In a previous X post, Doctor Profit gave an idea of what to expect from the crypto market (Bitcoin in particular) when it makes its next leg up. He stated that the flagship crypto will rise to $84,000 after it is done trading the sideway range between $60,000 and $72,000. In another X post, he claimed that the super cycle will start after Bitcoin hits $72,000. 

Meanwhile, Doctor Profit suggested that the price corrections experienced were normal and usually occur in each crypto cycle. He further remarked that the 10 to 20% price fluctuations weren’t big moves. His statement echoes the sentiment of Alex Thorn, Head of Research at Galaxy Digital, who previously warned that bull markets weren’t “straight lines up.”

Bitcoin Is In The Re-Accumulation Period 

In a recent X (formerly Twitter) post, crypto analyst Rekt Capital confirmed that Bitcoin is currently in the Re-Accumulation phase, which occurs after the Bitcoin Halving. He further noted that the goal now “is for Bitcoin to move sideways to catch a breather, for the market to cool off after [a] fantastic Pre-Halving price performance.  

According to Rekt Capital, this Re-Accumulation period can last for multiple weeks “and even up to 150 days.” The analyst revealed that once this period is over, Bitcoin will experience a breakout from this sideways range, followed by a parabolic uptrend

This uptrend phase is said to last for over a year. However, with the probability of this being an accelerated market cycle, Rekt Capital remarked that the duration for this uptrend could be cut in half. Crypto analysts like Tom Dunleavy, Partner and Chief Investment Officer (CIO) at MV Capital, predict that the flagship crypto will rise as high as $100,000 when that time comes. 

At the time of writing, Bitcoin is trading at around $64,360, up in the last 24 hours according to data from CoinMarketCap.

Bitcoin price chart from Tradingview.com

Spot Bitcoin ETFs Rocked By Outflows, BTC Price Succumbs To Bears

The Spot Bitcoin ETFs have seen their demand drop since the start of this month, and this was again evident in the considerable outflows recorded on April 26. This poor run has had far-reaching effects on the broader crypto market as Bitcoin’s price has succumbed to unfavorable market conditions. 

Spot Bitcoin ETFS Record $217 Million Of Outflows

Farside Investors revealed in an X (formerly Twitter) post that the Spot Bitcoin ETFs recorded $217 million of net outflows on April 25, one of their largest this month. Grayscale’s Bitcoin Trust (GBTC) accounted for most of these outflows, with investors moving $139.4 million out of the fund. 

Related Reading: Why Is The Dogecoin Price Down Today?

Some other funds also recorded individual outflows. Ark Invest’s Spot Bitcoin ETF recorded $31.3 million in outflows, while Valkyrie and Bitwise’s ETFs saw $20 million and $6 million in daily outflows, respectively. Notably, Fidelity’s Wise Origin Bitcoin Fund (FBTC) recorded a net daily outflow for the first time since these funds were approved, with $22.6 being moved out of the fund on Thursday. 

Meanwhile, BlackRock’s dry spell continued with its iShares Bitcoin Trust (IBIT) recording zero inflows for the second consecutive day. Although the fund has yet to record net daily outflows since launching, this undoubtedly represents a setback, considering that it had, before April 24, recorded 71 consecutive days of daily inflows. 

These Spot Bitcoin ETFs’ outflows have led to a wave of sell-offs from the fund issuers to fulfill redemptions. As a result, Bitcoin’s price action has been rather unimpressive as of late, with the flagship crypto experiencing significant price declines due to the heightened selling pressure. This development has put the bears firmly in control, with data from Coinglass showing that more Bitcoin longs than shorts have been liquidated in the last 24 hours. 

Macro Economic Factors Also Affecting Bitcoin’s Price

An initial estimate released by the Bureau of Economic Analysis on April 25 showed that the US Gross Domestic Product (GDP) grew at an annual rate of 1.6% in the first quarter, which was way below expectations. This data report further diminishes hopes of rate cuts this year and looks to have played out in investors’ minds as Bitcoin briefly dropped below $63,000 following the report’s release. 

Meanwhile, the Personal Consumption Expenditures (PCE) inflation data is set to be released on April 26. This PCE report could come in higher than expectations, adding to the growing concerns about the unlikelihood of rate cuts this year.

Interest rates have significant implications on risk assets, including crypto, and if the Federal Reserve decides to take a hawkish stance, it could negatively impact the crypto market. 

Bitcoin price chart from Tradingview.com

Vertex AI Price Forecast: Bitcoin Has 60% Chance Of Hitting $100,000, Key Predictions Unveiled

On-chain analytics firm Spot On Chain’s team of analysts, using Google Cloud’s Vertex artificial intelligence (AI), has conducted an in-depth analysis to forecast the future price of Bitcoin (BTC). 

Their latest report provides valuable insights into the leading cryptocurrency’s short-, medium-, and long-term outlook.

Bitcoin Price Forecasts

According to Spot On Chain’s report, Bitcoin prices are expected to fluctuate between $56,000 and $70,000 during May, June, and July 2024. 

This projected range indicates the potential for market volatility, with a 48% probability assigned to the scenario where BTC prices may dip below $60,000. Moreover, the report advises a cautious approach, acknowledging the possibility of short-term fluctuations or corrections in the price.

Spot On Chain’s analysis reveals a significant movement in the latter half of 2024, with a compelling 63% probability of Bitcoin reaching $100,000. 

This mid-term projection reflects a prevailing bullish sentiment in the market, further fueled by anticipated rate cuts after the Federal Open Market Committee’s (FOMC) December 2023 meeting. 

These rate cuts aim to bring the federal funds rate down to 4.6% and are expected to boost demand for risk-on assets such as stocks and Bitcoin.

Looking ahead to the first half of 2025, Spot On Chain’s modeling indicates a strong probability that Bitcoin will cross the $150,000 threshold. Specifically, a 42% probability is assigned to this scenario, indicating a bullish outlook for Bitcoin’s price trajectory.

What’s more, looking at the entire year of 2025, the probability of Bitcoin exceeding $150,000 rises to an eye-popping 70%. Based on historical data and patterns in previous cycles, Bitcoin reached a new all-time high approximately 6 to 12 months after the Halving event

Price Consolidation On The Horizon?

Crypto analyst Retk Capital has also provided insights into the current Bitcoin price action, shedding light on key resistance levels and the potential for a consolidation phase before an anticipated parabolic upside.

According to Retk Capital’s analysis, Bitcoin has consistently been rejected from the $65,600 resistance level, failing to regain it as a support level. 

This resistance zone has significantly impeded Bitcoin’s upward movement in recent days, as seen on the cryptocurrency’s daily BTC/USD chart below. 

Bitcoin

Retk Capital further highlights that Bitcoin has been witnessing downside wicks into a pool of liquidity at approximately $60,600. This occurrence has been observed over multiple weeks, indicating the presence of buyers in that price range. 

If Bitcoin experiences further downward movement, the analyst believes that there is a possibility that it may approach this area once again. The analyst further notes:

Price dropping without context can be emotionally challenging. However, understanding that this downside is part of the consolation within a technical range-bound structure that will precede Parabolic Upside makes this experience much more comforting.

As of this writing, BTC is trading at $63,900, down nearly 8% over the past two weeks and the same percentage over the past 30 days.

Featured image from Shutterstock, chart from TradingView.com

Bitcoin Bears Risk Losing $7.2 Billion If BTC Price Reaches This Level

The Bitcoin price continues to fluctuate wildly after crashing from its all-time high price above $73,000. This has triggered a wave of bearish sentiment in the market, causing a large number of crypto traders to go short on the pioneer cryptocurrency. As a result, these bears lose, risking a large amount if the Bitcoin price resumes its bullish rally.

Bears Will Lose $7.2 Billion If Bitcoin Reclaims All-Time High

In a post shared on X (formerly Twitter), crypto analyst Ash Crypto revealed an interesting trend concerning Bitcoin that has been developing. The screenshot shared shows that a large number of short trades have been placed on BTC, with the expectation that the price could continue to fall.

Now, so far, these bulls look to be right as Bitcoin has failed to successfully clear $67,000. However, they stand to lose a lot of money if BTC is able to clear this resistance and resume upward. According to Ash Crypto, there is over $7.2 billion worth of BTC shorts which risk liquidation if Bitcoin were to reach a new all-time high price above $74,000.

At the time, the Bitcoin price had recovered above $66,000, spurring a flurry of bearish activity in the market. However, these bears seem to have succeeded, as the BTC price has fallen below $64,000 at the time of writing.

As a result, bears have been emboldened, with the expectation that the Bitcoin price will still from here. So far, the liquidation trends risks have continued to rise as the BTC price falls. Data from Coinglass shows that if Bitcoin were to recover above $44,000 and reach a new all-time high, bears stand to lose over $10 billion.

Bitcoin

BTC Bulls Are Not Giving Up

Even though Bitcoin bears seem to be making bank with the price of Bitcoin falling, the bulls are far from done. Rather, they have been using this price decline as an opportunity to fill up their bags. This accumulation has been even more prominent among Bitcoin whales, who have picked up 1.4% of the total supply in the last month.

On-chain data tracker Santiment reported that in the last four weeks, Bitcoin whales have added 266,000 BTC to their balance. The cohort responsible for this are those holding between 1,000 and 10,000 BTC, making them the mega whales. In total, they spent $17.8 billion on buying BTC in just one month.

As a result of this accumulation, these 1,000-10,000 BTC whales now hold 25.16% of all BTC in existence. Their numbers are also on the rise, with Santiment identifying this as the “Highest crowd bullish bias since all-time high week in early March.”

For now, Bitcoin continues to struggle with the bears to hold the $63,000 support. Its price is down 4.05% in the last day to trade at $63,600, at the time of writing.

Bitcoin price chart from Tradingview.com

Bitcoin Forms Death Cross & TD-9 Sell Signal: Brace For Impact?

An analyst has explained how Bitcoin is forming both a death cross and TD sell signal, which may lead to potential dips in these targets.

Bitcoin Looking In Trouble As 12-Hour Chart Forms Two Bearish Signals

In a new post on X, analyst Ali discussed two signals that have recently formed in Bitcoin’s 12-hour chart. The first of these is a “death cross,” which occurs when an asset’s short-term simple moving average (SMA) dips below its long-term SMA.

Regarding the death cross, the 50-day and 100-day SMAs make up for the short-term and long-term trend lines. Historically, such formations have been considered bearish signals, with the price potentially suffering once the pattern is confirmed.

The other signal that has appeared for the cryptocurrency involves the Tom Demark (TD) Sequential. This indicator is popularly used for finding locations of probable tops and bottoms in any asset’s price.

The TD Sequential has two phases: the “setup” and “countdown.” The first phase, the setup, is said to be complete once the asset has gone through nine candles of the same polarity. After these nine candles, the price may have reached a likely reversal point.

Naturally, if the candles in the setup’s formation were red, then the signal would be a buy one, while if the prevailing trend were bullish, the reversal would be towards the downside.

Once the setup is complete, the countdown phase begins. This phase works much like the setup, except that candles are counted up to thirteen instead of nine. After the countdown’s completion, the commodity may be assumed to have reached another potential top/bottom.

Now, here is the chart shared by Ali that highlights how signals about both of these technical analysis patterns have been witnessed in the 12-hour price of Bitcoin recently:

Bitcoin Death Cross & TD-9 Sell

As is visible in the graph, the 12-hour price of Bitcoin first saw a death cross form with the 50-day SMA moving under the 100-day SMA. Then, it observed the completion of a TD Sequential setup, with the indicator suggesting a reversal to the downward direction.

Since this double bearish pattern has appeared, BTC has been heading down, suggesting that these signals may already be in effect. “If BTC falls below $63,300, brace for possible dives to $61,000 or even $59,000,” says the analyst.

From the current price of the cryptocurrency, a potential drawdown to the first of these targets would mean a decline of 4.6%, while one to the latter level would suggest a drop of nearly 8%.

BTC Price

So far, Bitcoin has managed to prevent falls under the $63,300 target listed by the analyst, as it currently floats around $64,000.

Bitcoin Price Chart

Renowned Economist Reveals What Will Happen If Bitcoin Can’t Hold $60,000

Chief economist and Bitcoin critic, Peter Schiff has issued a somber prediction regarding the world’s largest cryptocurrency, Bitcoin. The financial expert has cautioned investors of the potential repercussions should BTC drop below critical resistance levels.

Economist Predicts Bitcoin Price Decline

In a recent X (formerly Twitter) post, Schiff shared a price chart of Bitcoin against the United States Dollar (USD), pinpointing Bitcoin’s price at the time of the post at $63,814, alongside key support levels around $60,000. The economist has argued that Bitcoin’s current price position was not conducive for HODLers

Emphasizing the importance of BTC maintaining a stronghold above $60,000, Schiff urged investors to proceed with caution and hope that the cryptocurrency successfully sustains support levels. He also predicted that if Bitcoin failed to hold critical support levels, a substantial price decline would be inevitable. 

While Schiff’s predictions may appear to align with his usual skepticism towards Bitcoin, the timing of his warnings coincides with a period of heightened uncertainty and volatility surrounding Bitcoin’s price. 

The cryptocurrency is currently trading at $63,909, marking a notable decrease from its previous all-time high of over $73,000 before the halving event. Data from CoinMarketCap has revealed a series of declines, with Bitcoin experiencing a 3.75% drop in the last 24 hours and a 4.38% decrease over the past month. 

This underscores the uncertain price condition of the pioneer cryptocurrency, hinting at the possibility of further declines unless the cryptocurrency makes a quick price correction. 

Schiff has stated that while experienced Bitcoin holders are accustomed to large price drops and periods of volatility, new investors who have recently entered the Spot Bitcoin Exchange Traded Fund (ETF) market should be prepared for a “rude awakening.”

Crypto Analyst Says Potential Upsurge In Store For BTC

On Monday, April 22, prominent crypto analyst, Ali Martinez shared insights on Bitcoin’s future price trajectory in an X post. Martinez noted that the price of Bitcoin was steadily rising, aiming to secure new highs around $66,000. 

The crypto analyst predicts that if Bitcoin can successfully break past key support levels at $66,000, the cryptocurrency’s next critical resistance level would be between $69,900 and $71,200. Despite this optimistic forecast, Martinez has also warned investors about a potential pullback, emphasizing the importance of exercising caution and closely monitoring Bitcoin’s price if it falls below $65,500.

With Bitcoin currently priced at $63,909, it has fallen notably below the key support level highlighted by Martinez. This continuous price decrease could be attributed to recent trends indicating that Bitcoin’s accumulation score has dropped to zero. This suggests that whales may be moving away from the pioneer cryptocurrency or refraining from accumulating Bitcoin at its present price level. 

Is Bitcoin’s Rally Over? Leverage Drops As Halving Highs Fade: Report

Recent trends in the crypto market have indicated a notable shift in trader behavior, particularly among those investing in Bitcoin.

Using data from CryptoQuant, Bloomberg has revealed that the Bitcoin funding rate—the cost for traders to open long positions in Bitcoin’s perpetual futures—has turned negative for the first time since October 2023.

Bitcoin Funding Rates

This change suggests a “cooling interest” in leveraging bullish bets on Bitcoin, coinciding with the fading impact of major market drivers.

Bitcoin Market Dynamics Post-Halving

The decline in Bitcoin’s funding rate correlates with a reduction in net inflows to US spot Bitcoin Exchange-Traded Funds (ETFs), which previously pushed the cryptocurrency to record highs.

Despite the anticipation surrounding the Bitcoin Halving—an event reducing the reward for mining new blocks and theoretically lessening the supply of new coins—the price impact has been surprisingly muted.

According to Bloomberg, this subdued response has compounded the effects of broader economic factors, such as geopolitical tensions and changes in monetary policy expectations, leading to increased risk aversion among investors.

Following the latest Bitcoin halving, the market has not seen the bullish surge many expected. Instead, Bitcoin has only seen a correction of over 10%, from its all-time high (ATH) in March with prices stabilizing in the $63,000 region, at the time of writing.

Bitcoin (BTC) price chart on TradingView

As CryptoQuant’s Head of Research Julio Moreno pointed out, the recent downturn in Bitcoin’s funding rates to below zero underscores a “decreased eagerness” among traders to take long positions.

According to Bloomberg, this trend is supported by a significant drop in daily inflows to US spot Bitcoin ETFs and a reduction in open interest in Bitcoin futures at the Chicago Mercantile Exchange (CME), which indicates a broader cooling of enthusiasm for crypto investments.

In a Bloomberg report, K33 Research analyst Vetle Lunde noted that the “current streak of neutral-to-below-neutral funding rates is unusual,” suggesting that the market might be entering a price-consolidation phase.

Notably, this period of reduced leverage activity could potentially lead to further price stabilization, but it also raises questions about the near-term prospects for Bitcoin’s recovery.

Adjustments In Mining Difficulty And Market Implications

Interestingly, alongside these market adjustments, Bitcoin’s mining difficulty has increased for the first time immediately following the fourth halving.

The difficulty adjustment, which occurs every 2016 block, increased by 2%, reaching a new high of 88.1 trillion, according to Bitbo data.

Bitcoin Mining Difficulty History Chart.

This adjustment contradicts past trends where the difficulty typically decreased post-halving due to reduced profitability pushing less efficient miners out of the market.

This anomaly in mining difficulty suggests that despite lower rewards post-Halving, miners remain active, possibly buoyed by more efficient mining technologies or strategic shifts within mining operations.

This resilience in mining activity could help sustain the network’s security and processing power. Still, it reflects the complexities of predicting Bitcoin’s market dynamics solely based on historical halving outcomes.

Featured image from Unsplash, Chart from TradingView

Why Is The Crypto Market Down Today? Key Reasons Explained

The crypto market is in the red today, with a majority of the top-100 cryptocurrencies reflecting losses over the last 24 hours. Notably, only six altcoins, including two stablecoins, have managed to maintain a positive performance amidst a broader market sell-off.

Several complex and intertwined factors have contributed to the day’s negative market sentiment, affecting major cryptocurrencies. Over the last 24 hours, the price of Bitcoin has decreased by 4.2%, Ethereum has fallen by 5.0%, Solana has dropped by 8.7%, XRP has declined by 4.7%, and Dogecoin has decreased by 8.3%.

#1 Persistent Macroeconomic Uncertainty

A primary factor influencing today’s market movements is the evolving macroeconomic landscape, particularly concerning US interest rates and inflation expectations. At the beginning of the year, the market anticipated aggressive monetary easing by the Federal Reserve. However, the sentiment has shifted considerably based on recent data and Federal Reserve signals.

“Markets are pricing in fewer rate cuts for this year compared to the Fed’s dot plot projection of 3 rate cuts by year end. The implied fed funds rate for December has risen to 5.0%, indicating that the futures market is pricing in only 1 to 2 rate cuts,” Cetera Investment Management stated via X (formerly Twitter).

This week, all eyes are on the release of the Personal Consumption Expenditures (PCE) price index for March—the Fed’s favored inflation measure on Friday, April 26 at 8:30 am EDT. Until then, the market could be in a derisk mode.

The PCE is anticipated to present a varied view of inflation trends, which could strengthen the Federal Reserve’s inclination to delay any increases in interest rates. Analysts predict a slight increase in the overall PCE Price Index, rising to 2.6% year-over-year from 2.5% in February. Additionally, they expect a decrease in the index’s month-over-month change, dropping to 0.30% from 0.33%.

#2 Crypto Market In Shock Over Legal Action Against Samourai Wallet

The crypto market has also been rocked by yesterday’s legal developments involving the Samourai Wallet. The US Federal prosecutors’ decision to charge the founders Keonne Rodriguez and William Lonergan Hill with money laundering and operating an unlicensed money transmitting business has sent ripples through the crypto community. This action underscores the ongoing regulatory scrutiny within the crypto space.

The prosecution of Samourai Wallet’s founders not only raises questions about the future of cryptographic privacy but also significantly impacts market sentiment as it underscores the legal risks inherent in the crypto sector. The implications of this case extend beyond the immediate legal concerns, influencing broader market perceptions and investor confidence.

#3 Bitcoin And Crypto Are “Just Ranging”

Further insights into market dynamics come from prominent crypto analysts who have commented on the state of market liquidity and trader behavior. “The market has gifted us with a beautiful reset in trader positioning for Bitcoin. OI weighted funding turned negative for the first time since October 2023. That was before Bitcoin ran from 27k to 46k without any meaningful dip,” said Ted, a crypto analyst on X.

This reset refers to a reduction in the overheated futures market, which could allow the market to consolidate and potentially build a base for future upward movements.

Emperor, another crypto analyst, described the current market state through a series of tweets, highlighting the ongoing consolidation phase post-highs: “Too much panic still on the timeline but we’ve been ranging since the ATH, that’s all.”

He added, “The bear/bull line is an important resistance + Point of Control (PoC) of our range. Expecting VaL (Value Area Low) to hold on pullbacks and VaH (Value area High) to be the next target on longs if we reclaim level 1.”

#4 Bitcoin ETFs Remain Muted

Yesterday’s ETF flows were negative again. Only Fidelity’s FBTC and Ark Invest’s ARKB had minimal inflows. GBTC sold more again at -$130.4m and BlackRock had zero inflows for the first time ever since inception on January 11. Thus, BlackRock’s (IBIT) inflow streak ended at 70 days. Prior to this, IBIT entered into the top 10 all time after passing the ETFs like JETS, BND and VEA.

Notably, the momentum for spot Bitcoin ETFs has waned significantly in the past two weeks. The last notable day of inflows was on March 26, when they surpassed $400 million—nearly a month ago. On the bright side, despite this slowdown, there have been no outflows from either BlackRock or Fidelity. Grayscale’s GBTC remains the primary negative factor driving outflows.

Furthermore, there seems to be a decrease in investment willingness among traditional sector investors; the total inflows through ETFs have been stagnant for more than 30 days, coinciding with a flat trend in Bitcoin prices.

At press time, BTC traded at $64,034.

Bitcoin price

Bitcoin Whales Continue Buying, Now Hold 25.16% Of All Supply

On-chain data shows that the Bitcoin whales’ holdings have grown to 25.16% of the entire supply, and their net accumulation has continued recently.

Bitcoin Investors With 1,000 To 10,000 BTC Have Continued To Buy Recently

According to data from the on-chain analytics firm Santiment, the BTC whales have accumulated more than 266,000 BTC since the start of the year. The indicator of interest here is the “Supply Distribution,” which keeps track of the percentage of the total circulating Bitcoin supply that the various wallet groups are holding right now.

The addresses are divided into these cohorts based on the number of coins they currently have in their balance. The 10 to 100 coins group, for example, includes all wallets that own at least 10 and, at most, 100 BTC.

The Supply Distribution sums up the amount that investors belonging to a particular group as a whole are carrying and calculates what percentage of the supply they contribute.

The 1,000 to 10,000 BTC cohort is of interest in the current discussion. At the current exchange rate, the lower limit for this cohort is $65 million, while the upper one is $650 million.

Clearly, the investors belonging to the group are quite massive, and as such, they are popularly known as “whales.” As the whales can quickly move large amounts, they have the potential to influence the market. Due to this, their behavior can be worth watching.

There are whales beyond this cohort’s 10,000 BTC upper limit as well, but at such massive scales, entities like exchanges also start coming into play, who aren’t exactly normal investors.

Now, here is a chart that shows the trend in the Bitcoin Supply Distribution for the 1,000 to 10,000 coins group over the last few months:

Bitcoin Whale & Sentiment

As displayed in the above graph, the Bitcoin Supply Distribution for this key investor group has observed a net rise over the year 2024 so far. The whales have bought 266,000 BTC ($17.2 billion) over this period.

However, this accumulation hasn’t been consistent. As is visible in the chart, the whales sold into the rally that would eventually lead to the asset’s new all-time high, and they bought back in once the drawdown was over.

As BTC has consolidated, so has its supply. Still, the latest change in the metric has been towards the upside, implying that these humongous holders are perhaps backing the current recovery push.

Following the latest accumulation, the 1,000 to 10,000 coins group holds 25.16% of the supply, which means that more than a quarter of all Bitcoin in circulation is sitting in the wallets of these large investors.

While whale buying is bullish, the current investor sentiment may not be so. As the data for the “Weighted Sentiment” metric attached by Santiment in the chart suggests, investors are currently showing FOMO towards the asset.

Historically, Bitcoin has tended to move against the majority’s expectations, so FUD/fear has been ideal for uptrends to start. FOMO/greed, on the other hand, has been where tops have become probable.

BTC Price

At the time of writing, Bitcoin is trading at around $64,700, up more than 7% over the past week.

Bitcoin Price Chart

Old Bitcoin Whales Moving Coins: Will This Help Push BTC Above $74,000?

While Bitcoin struggles to extend gains, on-chain data shared by Ki Young Ju, the founder of CryptoQuant, on X shows increased movement of old coins. As the Bitcoin Average Dormancy chart shows, this trend recently hit a 13-year high. 

More Old Whales Moving Coins

The Bitcoin Average Dormancy shows the average number of days each BTC has been dormant. On-chain data indicates that coins held for 3 to 5 years have changed hands and moved to new owners. 

BTC dormancy chart | Source: CryptoQuant

While there was movement, interestingly, data shows that they were not transferred to exchanges. Instead, it is highly likely that they were traded over the counter (OTC).

Usually, any transfer to centralized exchanges like Binance or Coinbase could suggest the intention of selling. The more coins hit these exchanges, especially from whales, the higher the chance of price dumping. However, if trades are made via OTC, the impact on spot rates is negligible, which is a positive for bulls.

Further analysis of these transfers using the Spent Output Profit Ratio (SOPR) indicator suggests that whales moving them made decent profits. Historically, whenever whales dump and register profits, prices tend to dip.

Will Bitcoin Prices Retest All-Time Highs

However, in a post on X, one analyst says prices will likely increase because of the impact of spot Bitcoin exchange-traded funds (ETFs). These derivatives are like a buffer against price drops, considering the pace of inflows in the past weeks.

Spot ETFs allow institutions to gain regulated exposure to BTC. Coupled with decreasing outflows from GBTC, the odds of prices rising remain elevated. 

According to Lookonchain data, GBTC unloaded 750 BTC on April 23. However, Fidelity and other eight spot ETF issuers bought 1,513 BTC on behalf of their clients. Spot Bitcoin ETF issuers sell shares representing BTC holdings. These coins can be purchased from secondary markets like Binance, via OTC platforms, or directly from miners. 

Spot Bitcoin ETF flow data | Source: Lookonchain

BTC prices remain muted and capped below $68,000, representing April 13 highs.

To define the uptrend, there must be a high volume expansion above this liquidation line, reversing recent losses. 

Bitcoin price trending downward on the daily chart | Source: BTCUSDT on Binance, TradingView

Even so, looking at the BTCUSDT candlestick arrangement in the daily chart, bulls must break above all-time highs for a clear trend continuation. Ideally, the uptick above $73,800 and the current range should be with expanding volumes, confirming the presence of buyers.

Bitwise CIO Unveils 5 Major Forecasts For Bitcoin 2028 Halving, Anticipates A 280% Price Surge

Bitwise Chief Information Officer (CIO) Matt Hougan recently shared five interesting predictions for the next Halving of the Bitcoin (BTC) network, scheduled for 2028. In a comprehensive report, Hougan sheds light on the potential transformations for the world’s leading cryptocurrency.

New Investors And ETFs As Catalysts

One of Hougan’s key predictions is that Bitcoin’s volatility will significantly decline by 50%. He argues that the entry of new investors through the spot Bitcoin exchange-traded fund (ETF) market will drive this decline. 

Hougan said that as financial advisors, family offices, and institutions enter the Bitcoin market, their different investment behaviors – such as portfolio rebalancing and steady drip investments – could introduce counter-cyclical flows, ultimately dampening Bitcoin’s volatility.

Hougan’s second prediction revolves around the allocation of Bitcoin in portfolios. He believes that 5% allocations to Bitcoin will become commonplace in target-date portfolios. As BTC’s volatility decreases and becomes more attractive to institutional investors, Hougan expects a rise in typical portfolio allocations. 

The Bitwise CIO predicts that Bitcoin ETFs will attract over $200 billion in inflows. He highlights their impressive growth and cites their status as the fastest-growing new ETF category of all time. 

Hougan suggests that the ETF market is still in its early stages, with national wirehouses and institutions just beginning their due diligence. Drawing parallels with the rise of gold ETFs, which experienced year-after-year growth in net flows, he anticipates a similar trend for Bitcoin ETFs.

Bitcoin Price Path Toward $250,000

In an intriguing projection, Hougan suggests that central banks will allocate funds to Bitcoin before the next Halving event. He notes that central banks have historically been significant investors in gold, accumulating substantial amounts of the metal. 

However, with Bitcoin’s characteristics as non-debt money and its functional advantages over gold regarding payments and settlement, Hougan believes central banks will be increasingly drawn to Bitcoin. Hougan further noted on this matter:

There is also an element of game theory here. A major central bank adopting Bitcoin as a reserve asset would be a game-changer for Bitcoin and, I believe, would contribute to a dramatic increase in prices. Will one central bank try to front-run the others? 

Hougan’s final prediction revolves around Bitcoin’s price. He forecasts that Bitcoin will trade above $250,000 by 2028, an increase of nearly 280% from current levels. 

The Bitwise CIO attributes Bitcoin’s previous exponential growth to its transition from a speculative asset to one with real-world utility. 

Factors such as declining volatility, improved custody options, low correlations to traditional stocks, enhanced accessibility through ETFs, and growing institutional adoption all contribute to Hougan’s optimism regarding Bitcoin’s future progress. Hougan concluded by stating:

With the ETFs launched and gathering assets—and major Wall Street firms lining up behind bitcoin—I suspect the asset will continue to move further into the mainstream. At $250,000, bitcoin would be a $5 trillion asset. Could it go higher? Of course. But $250,000 would represent solid progress between halvings, and I think we’ll see at least that.

Bitcoin

Currently trading at $64,500, BTC is down nearly 3% in the past 24 hours after retesting the $67,000 mark on Tuesday and failing to consolidate above that level.  

Featured image from Shutterstock, chart from TradingView.com

Newbie Bitcoin Whales Hold 2x As Much As Veterans: What’s Behind This Trend?

On-chain data shows the new whale entrants in the Bitcoin market now hold almost twice as much as the veterans. Here’s what could be behind this shift.

Bitcoin Newbie Whale Holdings Have Been Rapidly Growing Recently

In a new post on X, CryptoQuant founder and CEO Ki Young Ju has discussed about how the holdings of the new whales compares against the old ones in the market right now.

The on-chain indicator of interest here is the “Realized Cap,” which, in short, keeps track of the total amount of capital that the investors have used to purchase their Bitcoin.

This capitalization model is in contrast to the usual market cap, which simply measures the total value that the holders as a whole are carrying based on the current spot price.

In the context of the current topic, the Realized Cap of the entire market isn’t of interest, but rather specifically that of two segments: the short-term holder whales and long-term holder whales.

Whales are defined as entities on the network who are holding at least 1,000 BTC in their balance. At the current exchange rate, this amount is worth $66.6 million, so the whales are clearly quite massive holders. Because of these large holdings, these investors can hold some influence in the market.

Based on holding time, the whales can be subdivided into two categories. The short-term holder (STH) whales are those who acquired their coins within the past 155 days, while the long-term holder (LTH) whales have been holding since longer than this timespan.

Now, here is the chart shared by Ju that reveals the Realized Cap breakdown between these two Bitcoin whale cohorts:

Bitcoin Realized Cap

As is visible in the above graph, the Realized Cap of the STH whales has historically not been too different from that of the LTH whales, but that appears to have changed recently.

The metric has pulled away for these new whales this year with some very sharp growth, as its value has now reached the $110.6 billion mark. This means that the STH whales have collectively bought their coins at an initial investment of a whopping $110.6 billion.

The Realized Cap of the LTH whales, on the other hand, has continued its usual trajectory, floating around $66.9 billion currently. This means that there is now a massive gap between the indicator for these two cohorts.

But what’s the reason behind the sudden emergence of this brand-new trend? As mentioned before, the STH cutoff stands at 155 days, which means that the Realized Cap of the STH whales would signify the total value of the purchases made by the whales over the last five months.

In the past five months, there has been one event in particular that has stood out, which has also never been present in any of the prior cycles: the approval of the spot exchange-traded funds (ETFs).

The spot ETFs provide an alternative mode of investment into the asset through a means that’s familiar to traditional investors. These funds have been bringing in some unprecedented demand into BTC and as their holdings also fall under the 155 days mark, they would count as STH whales.

Bitcoin has also been rallying this year, so all this new investment would have had to purchase at relatively high prices, thus causing the Realized Cap, which correlates to direct capital flows, to inflate even further.

BTC Price

Bitcoin is now trading at $66,400 after witnessing a surge of more than 6% over the past week.

Bitcoin Price Chart

Is A $72K Bitcoin Surge On The Horizon? Glassnode’s Latest Analysis Points To An Answer

Recent insights from Glassnode’s cofounders, shared under their X (formerly Twitter) account ‘Negentrophic’ have sparked interest in Bitcoin market dynamics, leading to a promising stabilization and possible price surge.

Market Sentiments And EMA Trends

With Bitcoin’s value recently wavering below the $70,000 mark, a detailed analysis from the cofounders suggests that a strong support level around the $62,000 50-day Exponential Moving Average (EMA) could set the stage for a significant rebound.

This crucial support level indicates a strong buying sentiment, indicating the market’s confidence in the cryptocurrency’s value and a potential resistance against further declines.

Using the strategic placement of the 50-day EMA as a support point, the analysis suggests that investors might see the current price levels as a solid base, preventing significant downward movements.

This perspective is reinforced by recent price movements, where despite a pre-halving general dip, Bitcoin has experienced a 7.1% increase in value over the past week, and the same uptick continued in the last 24 hours.

Bitcoin (BTC) price chart on TradingView

Further analysis by the Glassnode cofounders delves into the behavior of EMAs over different durations. Short-term EMAs indicate a growing inclination among investors to buy, while longer-term EMAs lean towards selling.

This contrasting behavior between short and long-term EMAs sheds light on the current phase of the market, which seems to be in a period of consolidation after the notable 92% increase in Bitcoin’s price over six weeks earlier in the year.

Such insights are vital as they offer a deeper understanding of the underlying market forces and investor behavior during volatile periods.

Meanwhile, Glassnode’s team’s analytical approach extends beyond simple price movements. Yesterday, they compared the current market conditions to the early 2021 “strong correction,” which they term “wave 4” of the ongoing market cycle.

This historical perspective provides a lens through which current trends can be evaluated, suggesting a cyclic return to bullish conditions reminiscent of past market behaviors.

Bitcoin Bullish Projections And Market Dynamics

Bitfinex analysts have highlighted significant activities around Bitcoin withdrawals, supporting the optimistic outlook on Bitcoin. The current levels, echo those of January 2023, suggest that investors are increasingly moving their Bitcoin to cold storage—a sign that many anticipate further price increases.

Veering back to Glassnode’s projections yesterday based on their indexes and Fibonacci levels, the cofounders were boldly optimistic, anticipating a potential 350% increase from current market levels.

Notably, this forecast highlights the expected financial trajectory and underscores a growing confidence among experts and market analysts in Bitcoin’s market performance and its foundational economic principles.

Featured image from Unsplash, Chart from TradingView

Samson Mow On Bitcoin Halving: Brace For Supply Shock, Omega Candle In Sight

Samson Mow, the chief executive at Jan3, recently spoke to Forbes about the latest Bitcoin halving and its potential to catalyze what he refers to as the “Omega candles” – significant price movements that could elevate Bitcoin to the $1 million mark.

According to Mow, halvings ensure a controlled distribution of Bitcoin, maintaining scarcity and value.

The Mechanics Of Halving And Its Market Implications

Samson Mow detailed in the interview with Forbes the mechanics behind Bitcoin halvings—a critical process built into Bitcoin’s framework by its creator, Satoshi Nakamoto.

This mechanism is designed to halve the block rewards given to miners every 210,000 blocks, or approximately every four years, reducing the reward by 50%.

So far, the most recent halving has reduced the reward for mining from 6.25 BTC to 3.125 BTC per mined block. However, initially, miners received 50 BTC per block.

Still, due to the halvings, this amount has decreased over time to manage inflation and extend the mining lifecycle of Bitcoin’s capped supply of 21 million coins. If not for these halvings, the total supply of Bitcoin would have already been mined.

In the same discussion, Mow highlighted the significant impact of newly approved spot-based Bitcoin ETFs, which received SEC approval earlier this year. He believes these ETFs, combined with the reduced block rewards from the halving, could precipitate a “supply shock” in the BTC market.

Mow further speculated on the occurrence of what he calls “Omega candles”—large price movement events in the Bitcoin market.

He noted that even before the recent halving, the daily demand for Bitcoin was significantly outstripping supply, predicting these Omega candles as almost certain events due to their high volatility and substantial price changes.

Mow views these developments as marking the beginning of a new era for Bitcoin, coinciding with its next, or fifth, halving in the coming four years.

Bitcoin Bright Future And Market Performance

Regarding positive sentiment on Bitcoin, Geoff Kendrick of Standard Chartered also supports this bullish outlook, projecting substantial inflows into BTC akin to those experienced by gold with the advent of gold ETFs.

Kendrick suggests that the maturation of the spot ETF market could channel between $50 and $100 billion into BTC.

However, despite the post-halving price not reaching the anticipated heights, BTC has demonstrated resilience and potential for considerable growth. Meanwhile, analysts remain confident, predicting significant long-term value increases.

For instance, Michael Sullivan’s analysis suggests a possible reach of $245,000 by 2029 if BTC maintains a 30% compound annual growth rate, underlining the optimistic projections shared by several market experts.

This optimism is further supported by recent trends, including a 7.1% increase in Bitcoin’s price over the last week, which indicates a possible recovery on the horizon.

Bitcoin (BTC) price chart on TradingView

Featured image from Unsplash, Chart from TradingView

This Metric Printed In 2017 Before Bitcoin Exploded: Is A Mega Run Incoming?

In a post on X, one analyst has picked out a key on-chain metric that could signal the beginning of a strong leg up, similar to the explosive gains 2017. Currently, Bitcoin prices remain steady and edging higher. However, the coin failed to register sharp upswings, as most traders had predicted before the Halving event on April 20.

Flow Indicator Dips: A Bull Run In The Making?

Taking to X, the analyst said there has been a sharp drop in the 7-day average Flow indicator at leading crypto exchanges like Coinbase and Binance. When this was highlighted, the Flow indicator pointed to a decline from 161,000 to 76,000 BTC, a nearly 50% drop. 

BTC daily exchange flow | Source: Analyst on X

Interestingly, a similar pattern emerged in 2017 before Bitcoin embarked on a historic bull run.

The analyst said the Flow indicator dropped to 64,500 BTC across exchanges days and weeks later before prices exploded to around $20,000 in December 2017. 

Bitcoin price trending upward on the daily chart | Source: BTCUSDT on Binance, TradingView

For now, only time will tell if Bitcoin is preparing for a strong leg up. The coin remains within a bear formation, looking at the candlestick arrangement in the daily chart. Even though prices rose after Halving Day on April 20, sellers are in charge. As it is, the April 13 bearish engulfing pattern continues to define price action. Technically, a close above $68,000 might be the foundation for a rally towards $74,000 in the days ahead.

Bitcoin Supply Rapidly Shrinking

While the Flow indicator points to declining BTC across exchanges, another analyst has discovered an interesting development. Taking to X, another analyst noted that the available Bitcoin supply dipped below 4.6 million for the first time before April 20, when the network halved miner rewards. 

BTC supply falling | Source: Analyst on X

Since Halving reduces daily emissions by half, even if the current demand is sustained, the analyst says a supply squeeze will drive prices higher. Even so, as mentioned earlier, whether BTC will rally depends on the pace at which immediate resistance levels are cleared.

Historically, prices tend to rally a few months after Halving Day. However, in the past few months, there have been notable deviations. For instance, prices soared to all-time highs before Halving Day. This is the first time this has happened.

Beyond technical formations, the United States Securities and Exchange Commission (SEC) approved the first spot Bitcoin ETFs in January 2024. Through this product, institutions are free to gain exposure through shares. These shifting dynamics will shape price action in the current epoch, possibly leading to new deviations from historical performances.