Down But Not Out: The One Line Bitcoin Must Hold To Be Bullish

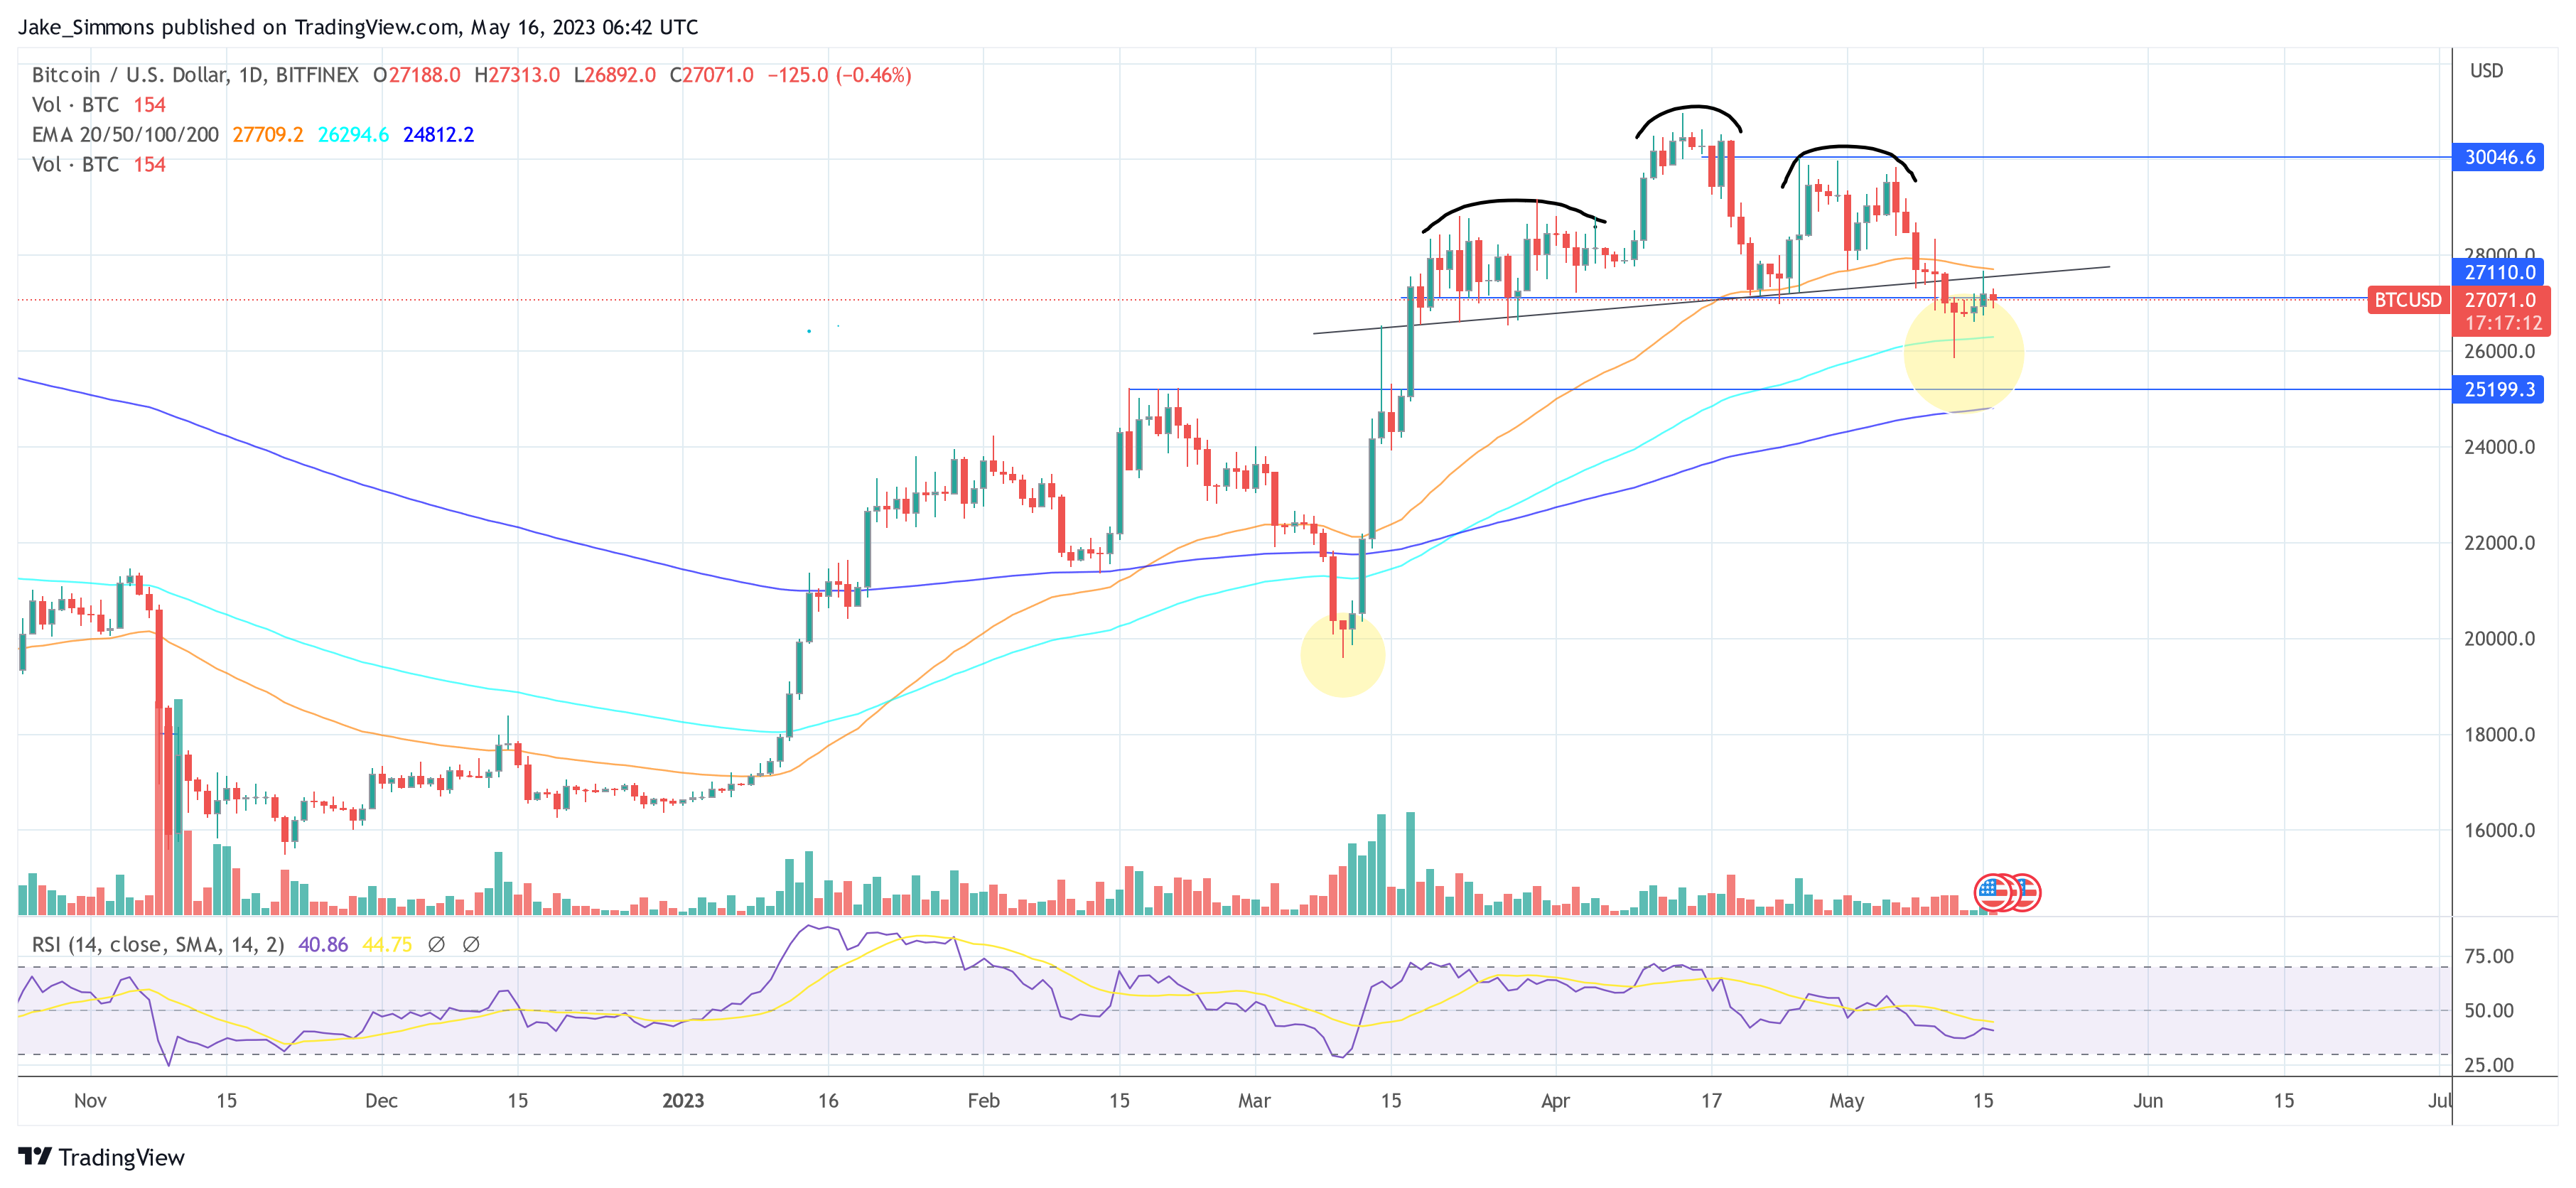
Bitcoin price is falling, testing the low $26,000 area of support after weeks of painful, sideways consolidation.

While the horizontal support line is clearly important, it’s nowhere near as critical as another line that BTCUSD absolutely must hold to remain bullish.

Drawing Trend Lines In Bitcoin Technical Analysis

In the practice of technical analysis, drawing trend lines is among the first basic steps anyone will take. Simply connect the line across various points on the chart to highlight support and resistancesupport and resistance.

Another basic step involves turning on technical indicators to look for potential buy and sell signals. Some of these tools call out when an asset is overbought or oversold, such as the Relative Strength Index.

More advanced techniques include drawing trend lines on indicators like the RSI instead of price. Much like drawing these lines from point to point diagonally can plot uptrends or downtrends, horizontal lines can also act as support or resistance on the RSI.

On the weekly timeframe Bitcoin price has pulled back to a reading of 53 on the RSI. This level must hold, according to past price history. Each time it has, the crypto market has erupted higher.

Bitcoin rsi

Bulls Must Show “Strength” At Current Levels

The above BTCUSD weekly chart shows the RSI pulling back to a reading of 53. The last time this happened, was in Q3 2020 right before an epic bull run. The short bullish rally in 2019 blasted right through it without a retest of the level.

Prior to these instances, all other outcomes were shockingly bullish when Bitcoin held above the line. Rather than falling into a bearish phase, each time BTCUSD weekly RSI held at the line in 2016 and 2017, the crypto market simply marched higher.

Other times, when BTCUSD failed to hold this line, a bear market ensued. A failed attempt to get back above the level typically led to the last leg of the bear market. However, getting back above it and then failing to hold could provide the crypto market with something more reminiscent of the COVID collapse and is something to watch closely for. Hold the line, and bulls will run again, possibly to new all-time highs.

Bitcoin Sell-Side Risk Ratio Nears All-Time Lows, Big Move Soon?

On-chain data shows the Bitcoin sell-side risk ratio has approached all-time lows recently, a sign that a big move could be coming for the coin.

Bitcoin Sell-Side Risk Ratio Has Observed A Plunge Recently

As pointed out by the lead on-chain analyst at Glassnode in a Tweet, BTC sellers may have become exhausted recently. The “sell-side risk ratio” is an indicator that measures the ratio between the sum of all profits and losses being realized in the Bitcoin market and the realized cap.

The “realized cap” here refers to the capitalization model for Bitcoin that calculates a sort of “true” value for the cryptocurrency by assuming that each coin in the supply is not worth the same as the current spot price, but the price at which it was last moved.

As the profits and losses being harvested in the market are nothing but a measure of the selling pressure in the market, this indicator tells us how the selling pressure (or the sell-side risk) looks like relative to the value of the cryptocurrency (the realized cap).

When the value of this indicator is high, it means the investors are participating in a high amount of profit/loss realization right now. Such a market is usually high risk, as the price tends to be more volatile during periods with these values.

On the other hand, low values imply the holders are reluctant to sell currently. These conditions generally occur when the market has calmed down and accumulation tends to take place in such periods.

Now, here is a chart that shows the trend in the Bitcoin sell-side risk ratio over the history of the cryptocurrency:

Bitcoin Sell-Side Risk Ratio

As shown in the above graph, the Bitcoin sell-side risk ratio has seen a sharp plunge recently, a sign that there is little profit or loss realization going in the market right now.

The indicator is now below the “low value realization” line that the analytics firm has defined (colored in red in the chart). Historically, whenever the metric has plunged into this zone, the market has built up towards a sizeable move in the price.

Since such low values of the indicator imply the lack of sellers in the market, the common expectation may be that this can be a bullish sign. However, as is visible from the graph, this hasn’t necessarily been the case.

Both bullish and bearish price action has occurred following the formation of this pattern. Just back in March of this year, the indicator had shown this trend, but the cryptocurrency had followed up with a sharp correction.

Breaks into the high value realization zone (that is, the condition where there is a large amount of selling going on), though, have generally always been bearish for Bitcoin.

As the indicator has once again dipped into the low value realization area, it’s possible that a large move in the price may follow soon. Although it’s uncertain which direction exactly this volatility might go.

BTC Price

At the time of writing, Bitcoin is trading around $26,100, down 2% in the last week.

Bitcoin Price Chart

Santiment Explains How Bitcoin Investor Mentality Influenced Recent Price Action

Santiment has broken down how the recent action in the Bitcoin price may have been affected by the prevailing sentiment in the market.

Trends In Bitcoin Social Volume May Have Influenced The Price Recently

As the on-chain analytics firm Santiment explained, BTC generally moves in the direction the crowd isn’t expecting. The relevant indicator is the “social volume,” which measures the total number of social media text documents discussing a given term or topic.

The social media text documents here refer to a collection of social media posts collected by Santiment that have been sourced from various popular platforms like Twitter, Reddit, and Telegram.

This indicator only checks whether a text document in this collection mentions the term at least once; posts with more than one mention of the topic are still given the same weight as a document that only does it once.

To use this indicator for pinpointing discussions related to market sentiment, the analytics firm first found the social volume of Bitcoin and cryptocurrency in general. Then it filtered it for some specific terms that refer to the investors’ mentality.

Here is a chart that shows the trend in the Bitcoin social volume for negative and positive sentiments over the last week:

Bitcoin Social Volume

The terms used here to separate the discussions related to positive sentiment are buy, bullish, and bottom. Similarly, sell, top, and bearish are some of the terms that have been used for finding negative talks.

In the graph, Santiment has marked the pattern that the social volumes of these sentiments followed during the past couple of days. On the 21st, following the decline in the asset’s price, the indicator’s value for the negative mentality observed a large spike.

This means that social media discussions had gotten quite bearish when this price drop occurred. However, once this mentality shift happened, the cryptocurrency saw a local bottom formation.

Over the next day, the coin saw some rise and broke back above the $27,000 level. While this rise was taking place, the sentiment again turned positive.

By the time the price went above $27,000, though, the social volume of the greedy sentiment had reached pretty high values. Like when the negative sentiment had become overwhelming, the bottom had formed, a top occurred following this positive mentality spike.

Historically, the Bitcoin market has generally always moved like this; whenever the sentiment becomes too unbalanced towards any particular side, the market tends to show moves opposite to this sentiment held by the majority.

BTC Price

Since Santiment posted its analysis and the flush in the positive sentiment, Bitcoin has again risen above the $27,000 mark. When writing, the coin is floating around $27,300, up 1% in the past week.

Bitcoin Price Chart

Former MicroStrategy CEO Says Bitcoin Rally Just Getting Started

MicroStrategy is a business intelligence firm and one of the biggest holders of Bitcoin, the world’s most valuable cryptocurrency by market capitalization. And Michael Saylor, the former CEO of MicroStrategy, believes the cryptocurrency market is bottoming, and a Bitcoin rally is on the horizon.

Regulation, Halving, And Ordinals Are Drivers

In the interview, Saylor points out several tailwinds that may drive BTC to new 2023 highs. Specifically, he talks about regulations and how BTC is safe, considering the favorable classification from the United States Securities and Exchange Commission (SEC) and the Commodity Futures Trading Commission (CFTC), two of the top regulators in the country. Their officials classify Bitcoin as a commodity with utility and not an unregistered security.

Saylor opines that other assets besides Bitcoin have a “black cloud hanging” over them and could be “regulated out of existence.” Consequently, he continued, capital will most likely flow from altcoins to BTC.

I think the crypto tokens and securities will be regulated, perhaps out of existence. Bitcoin is the most secure network. It’s the most secure asset. Everything else has got a black cloud hanging over it. You will see a consistent flow of capital from the rest of the crypto ecosystem into Bitcoin.

Besides regulation, he thinks the upcoming BTC halving event could propel prices higher. In 2024, the Bitcoin network will halve miner rewards from the current 6.25 BTC to 3.125 BTC.

This development will be a supply shock on the network, making BTC scarcer and more valuable. Though miner revenue might drop, past halving events have led to significant price gains. This pattern may be replicated next year.

Even though Ordinals has been blamed for bloating the network, Saylor remains bullish about the service and that it will propel the digital asset toward new highs. Ordinals is a platform allowing users to attach files, such as texts and videos, to Satoshis, effectively storing them on-chain. A satoshi is the smallest unit of BTC.

Bitcoin Bull Run Incoming

Talking to CNBC, Saylor, a Bitcoin permabull, thinks the recent firmness of the coin could be the start of a bull run that could push it to new 2023 highs.

BTC has been consolidating, failing to convincingly close above the $28,000 resistance level. For the better part of May 2023, prices have been edging lower, moving from around the $31,000 level recorded in late April 2023. Since April, the coin has dropped by around 10%, falling to as low as $25,800 last week.

Bitcoin Price On May 23| Source: BTCUSDT On Binance, TradingView

Despite the recent contraction, Bitcoin remains within a bullish formation. Notably, bears have failed to reverse gains posted from mid-March to early April 2023.

This Bitcoin Indicator Turned $5 Into $34,000

Everyone is looking for an edge when trading crypto. In a new video, a Bitcoin indicator designed for finding precise market turning points is used to turn $5 into $34,000.

The results are a shocking 88% success rate and more than 679,000% ROI. Let’s take a closer look.

About The Bitcoin Indicator Used: Fisher Transform

The Fisher TransformFisher Transform was created by John Elhers and first mentioned in the November 2002 Issue of Technical Analysis of Stocks and Commodities Magazine. The tool attempts to make sense of unpredictable price movements by using statistics.

The indicator takes price data and transforms it into a Gaussian normal distribution. All this means is that the tool tries to make the price data look like a more organized pattern that can be easier to understand.

In addition to using the tool’s turning points for buy and sell signals, passing through the zero line is also a sign that a trend is strengthening. While the tool is highly effective, combining its signals with Japanese candlesticks, chart patterns, and Elliott Wave Principle can improve results.

Bitcoin indicator

Turning $5 Of Bitcoin Into $34,000

In the video, the monthly Fisher Transform is used to generate buy and sell signals when the trigger line crosses above the fisher line from below or above, respectively.

The tool makes several bad trades. It notably loses some money it has earned on the way up at the second Bitcoin top in 2021. Despite a couple slip ups, the Fisher Transform turns $5 into $34,000 in the end. Over $30,000 is added during the best trade.

This translates to roughly a 679,000% ROI over the lifetime of BTCUSD price history. The shocking return is a reminder for investors and traders to find a technical system that works and then let it do its thing. Objective, non-discretionary trading systems may be boring but take emotions and bias out of the equation.

Bitcoin Bubble About To Burst? Analyst Warns Prices Could Dip To $7,000

Mike McGlone, a senior commodity strategist at Bloomberg, has highlighted Bitcoin’s (BTC) historical patterns of boom and bust, which are closely tied to liquidity. According to McGlone, Bitcoin’s current price level of around $27,000 may be at risk of reversion, considering that it was only $7,000 at the end of 2019 before the massive liquidity pump in 2020.

Bitcoin Faces Unprecedented Risk?

McGlone’s analysis also indicates that Bitcoin’s downward trajectory, as demonstrated by its 52-week moving average, contrasts with the upward trend it experienced at the onset of the pandemic. This suggests that the cryptocurrency is susceptible to booms when liquidity is abundant but vulnerable to busts when liquidity is removed. As such, McGlone recommends respecting the down-sloping 52-week mean in assessing Bitcoin’s direction bias.

Despite the recent bank run, the Federal Reserve (Fed) has tightened twice, which may indicate the central bank’s tenacity, McGlone points out that slumping copper and cryptocurrencies, including Bitcoin, are paying heed to the warning, which contrasts notably with the resilient stock market.

Furthermore, in a recent interview, McGlone warned that Bitcoin could potentially experience a significant decline and return to its 2019 rally starting point of around $7,000. McGlone cites the drying up of liquidity and rising interest rates as key factors that could lead to a mean reversion for Bitcoin.

While acknowledging the potential for Bitcoin to rebound, McGlone notes that the cryptocurrency has yet to exhibit strong divergence from other assets and suggests that investors should wait for a significant drop in the S&P 500 and copper before considering a long position in Bitcoin.

Looking at the facts of Bitcoin, McGlone notes that before the massive liquidity pump in 2020, the cryptocurrency’s average price in 2019 was around $7,000. It subsequently surged to $60,000 before settling at its current level of $27,000. While Bitcoin is still trading at four times its 2019 average price, McGlone cautions that the risk of mean reversion remains and suggests that investors should exercise caution in the current market environment.

BTC’s ABC Pattern Could Signal Consolidation And Potential For Upside

Crypto analyst Michael Van de Poppe has assessed Bitcoin’s recent price action and suggests that the ABC pattern could technically be complete for BTC. The C wave went lower than the initial A wave, and they are approximately the same length from a price drop perspective. The lowest wick was only $500 off the base case, and the price seems to have entered consolidation just as expected, albeit higher.

Bitcoin

Van de Poppe notes that C waves having approximately the same length as the A wave is uncommon, and sometimes the C wave can go much deeper than the A wave. However, at this point, it is worth considering that the bottom of the C wave may be in. If another drop is lower, it should happen in the first half of this week. 

If the price breaks above $27,700 or even flips the descending trendline, that could be early signs that consolidation is ending, and Bitcoin’s price is ready for continuation upwards. The ultimate level to flip for higher conviction is $29,000, and RSI is above 50.

On the other hand, if there is a daily candle close below $16,700, another leg down becomes more likely, and Van de Poppe’s target for that would still be $24,000 – $25,3000. Van de Poppe emphasizes that both scenarios are bullish over the medium timeframe (months) as long as Bitcoin’s price does not drop and stays under $22,000 in a sustained manner.

Bitcoin

Featured image from iStock, chart from TradingView.com

Will Bitcoin Prices Limit And Slow Down The Number Of BTC ‘Wholecoiners?’

On May 20, Caitlin Long, the founder of Custodia Bank, retweeted and revived an intriguing question posed by Adam Back, CEO of Blockstream, on whether the number of the so-called Bitcoin “wholecoiners” has peaked.

Is The Number Of Bitcoin Wholecoiners Peaking?

Her question is when the number of wholecoiners, or individuals holding at least 1 BTC, soared above the 1 million mark last week.

While the rising number of wholecoiners points to possible adoption and rising BTC demand over time, market forces could end up capping their numbers.

She reckons that as Bitcoin prices increase, it would be more expensive for a would-be wholecoiner to purchase the asset. Therefore, based on these factors, it may be unlikely that there will be 10 million in the coming years.

On May 13, Glassnode, an on-chain analytics firm, revealed that the number of addresses managing at least 1 BTC had broken above the 1 million mark and continues to steadily grow.

This upward trend has remained consistent, weathering the impact of the crypto winter which saw BTC prices crumble from over $69,000 registered in November 2021 to less than $16,000 in Q4 2022.

Bitcoin Price On May 21| Source: BTCUSDT On Binance,TradingView

Despite this impressive trend, Long and Adam’s observations may cast doubt on whether this could continue in the long haul, pushing the number of wholecoiners to double digits.

By design, Bitcoin is deflationary and there will be 21 million BTC to ever circulate. As inflation also reduces due to BTC halving roughly every four years, coin holders expect BTC prices to gradually increase over the years.

Based on historical performance and increasing crypto adoption, market forces could drive BTC prices higher, making it challenging for more users to own 1 BTC currently trading at over $26,900 as on May 21.

Less Than 2.5% Of BTC Addresses Are Wholecoiners

While the number of wholecoiners has been steadily rising, there is a division between long-term investors and short-term speculators.

Long-term Bitcoin holders have demonstrated resilience during market fluctuations, retaining their positions rather than selling. On the other hand, speculators are known more for exiting for USDT and cash during times of heightened volatility. For their actions, short-term holders or speculators have been labeled as “weak hands”.

So far, BitInfoCharts data shows that less than 2.5% of all Bitcoin addresses hold at least 1 BTC. As of May 21, addresses with between 1 and 10 BTC stood at 2.1% of the total. Meanwhile, the number of whales, or those holding above 100 BTC represented less than 0.033% of the total addresses.

Roughly 93% of all Bitcoin addresses held between 0.00001 and 0.0001 BTC.

Can BRC-20 Tokens Become The Face of the Next Bull Run?

In May 2021, a Shiba Inu-inspired coin had retail investors flocking to cryptocurrency. Dogecoin was an unlikely marker of one of the all-time bull run highs. But it goes to show that when you find the right meme, you can chorale a community to show up in force.

The rise of Dogecoin felt like cryptocurrency had finally reached its tipping point. Then, the likes of Terra and FTX destroyed consumer confidence, and we all know what happened next. Now we need something to draw us out of crypto winter.

Just like Dogecoin did two years ago — and almost to the day — a new BRC-20 token could mark the start of more bullish times for cryptocurrencies. Let’s delve into BRC-20 tokens to discover what they really are.

Revealing the captivating rise of a token that could well become Doge’s arch nemesis, and the bellwether of Bitcoin summer.

The Rise of BRC-20 Tokens

BRC-20 tokens have emerged as a novel “token standard” on the Bitcoin network. BRC-20 tokens make it possible to mint individual satoshis with information about an entire collection of tokens, meaning you can spin up a Dogecoin-like crypto on Bitcoin.

They first captured the attention of the diehard crypto community in March 2023, and the market capitalization of all BRC-20 tokens is now close to $1 billion. That said, no individual token had broken out beyond the core community.

At least, that was the case — until just a couple of days ago.

The ‘Bitcoin Cat’ Taking On Ethereum

Trust is lacking in the cryptocurrency space right now, so a bull run looks anything but imminent. But if we can find a point of trust to bring the everyday investors back to the blockchain, then who knows.

Perhaps Bitcoin meme coins are the way. After all, Bitcoin is the most trusted cryptocurrency, the OG. And the rise of the BRC-20 token standard shows the trend might just kick start ‘Bitcoin summer.’ 

All we need is the right meme, and it looks like we might have just stumbled across a contender: a newly-minted BRC-20 token with the face of a recognisably agitated cat deployed onto Bitcoin just two days ago. 

The token, aptly called $GRUM, saw over 50% of its 21 billion supply minted within the first few hours before soon selling out. This made it the only BRC-20 token in the top-25 by holder count to have minted such a high portion of its supply to such a broad investor base so quickly.

The token’s initial success reflected its ‘fair launch process,’ wherein anyone could mint up to one million $GRUM. The absence of allocations ensured a level playing field for all, instilling further trust from the community. 

But perhaps there’s something more prescient there. 

Can $GRUM bring back the bulls?

The convergence of BRC-20 tokens and the meme coin revolution on Bitcoin has opened up exciting new possibilities in the crypto space. $GRUM, with its swift ascent and rapidly expanding community, showcases its potential to become a new favorite.

The move would help more retail investors understand and perhaps join the BRC-20 meme coin wave, which could force the dogs and frogs of Ethereum to take a back seat. This Bitcoin token seems to have the memetic power to draw huge attention.

Note: The above article is for illustrative purposes only and does not constitute financial advice.

Whale Alert: 1,750 Bitcoin (BTC) Moved To Exchange, Massive Plunge Incoming?

An intriguing development has caught the crypto community’s attention as a Bitcoin whale deposited a substantial amount of BTC on the world’s largest crypto exchange, Binance.

This significant move has sparked speculation about potential selling pressure and the subsequent impact on Bitcoin’s price. Notably, the massive deposit was recorded when Bitcoin showed signs of a rebound following its recent losses in the past week.

Whale Moves BTC To Binance

According to renowned on-chain analyst Lookonchain, a notable Bitcoin whale made a deposit of 1,750 BTC which is worth over $48 Million, on the Binance exchange a few hours ago. This occurrence has raised concerns among market observers, as large transactions can indicate imminent selling pressure.

The on-chain data analyst further reveals this whale has a history of triggering sudden moves in the price action. On April 21, the same individual deposited a staggering 5,791 BTC (equivalent to $163 million), leading to a subsequent 3% drop in Bitcoin’s price within five hours.

Notably, Lookonchain says this whale has a history of buying large amounts of Bitcoin. The analyst reports that the whale initially acquired 10,000 BTC, valued at $171 million, on December 1, 2022, when Bitcoin was priced at $17,101.

And as of now, the whale has a current Bitcoin holding balance of 2,459 BTC and an approximate profit of $107 million.

Bitcoin Reaction: Analyzing the Possibilities

It is worth noting that the Bitcoin market reaction to this whale can be quite unpredictable as the large investor alone might have a different reason to move the coins besides selling them. However, given the historical evidence of price movements following whale deposits on exchanges, Bitcoin will likely experience a spike in volatility soon.

Particularly, If the past is any indication, there is a possibility of a short-term dip in Bitcoin’s price if the whale sells its BTC deposit. The sudden influx of 1,750 BTC into the exchange may trigger a cascade of sell-offs from other market participants, leading to a temporary downturn.

Regardless, Bitcoin’s price has experienced a quick spike in the past 24 hours, up by 1%. Bitcoin has shown possible signs of rebound along with the rest of the crypto market. BTC has surged from low trading below $27,000 yesterday to trading for $27,406 at the time of writing.

Bitcoin (BTC)'s price chart on TradingView

Before the bullish signs, BTC has since been in a downward trend in the past weeks, down by more than 10% in the past month. Interestingly, BTC trading volume remains below $10 billion despite the whale movement.

Featured image from, Unsplash, Chart from TradingView

Bitcoin Bullish Signal: Whales Accumulate 84,897 BTC

On-chain data shows the Bitcoin whales have accumulated 84,897 BTC during the last five weeks, something that could be bullish for the price.

Bitcoin Whales Have Been Growing Their Holdings Recently

According to data from the on-chain analytics firm Santiment, when whales last accumulated like this, the price jumped about 34%. The relevant indicator here is the “BTC Supply Distribution,” which tells us about the total amount (as well as the percentage) of the Bitcoin supply that each wallet group in the market is holding currently.

The addresses on the network are divided into these wallet groups based on the number of coins that they are carrying in their balances at the moment. The 10-100 coins cohort, for instance, includes all addresses that are holding at least 10 and at most 100 BTC currently.

Naturally, if the Supply Distribution is applied to this specific group, it would measure the amount of the supply that wallets satisfying this condition are holding as a whole.

Now, in the context of the current discussion, the Bitcoin cohort of interest is the “whale” group. Whales are humongous entities that carry at least 1,000 BTC ($26.8 million at the current exchange rate) and at most 10,000 BTC ($268 million) in their wallets. This means that the 1,000-10,000 coins group is of relevance here.

The below chart shows the trend in the Bitcoin Supply Distribution for this particular cohort over the past year:

Bitcoin Whales

As displayed in the graph, the Bitcoin Supply Distribution for the whale group has observed an overall uptrend recently. During the last five weeks, these humongous investors have added around 84,897 BTC to their holdings, which is worth around $2.2 billion.

Generally, the behavior followed by the whales can be something to watch out for, as their massive holdings mean that they have the potential to cause noticeable ripples in the market through their moves.

An example of this can be clearly seen in the chart. In the leadup to and during the rally back in January of this year, the whales displayed a trend of accumulation and grew their supplies by around 71,690 BTC.

While this accumulation occurred, the price of Bitcoin started its surge and had risen by more than 34% by the time the whales slowed down their buying spree. This trend highlights how the buying pressure from this cohort can help the price go up.

Since the whales have started their latest accumulation cycle, however, the price has only declined or moved sideways so far. But given that these holders are continuing to expand their reserves, it suggests that they think the current relatively low prices provide a good buying opportunity.

It’s unknown when this bullish conviction held by the whales might translate to the price, but the trend could be a positive sign for the long-term sustainability of the rally.

BTC Price

At the time of writing, Bitcoin is trading around $26,700, down 2% in the last week.

Bitcoin Price Chart

Is Bitcoin Headed For Another Crash? Here’s What The Data Says

Bitcoin (BTC), the leading cryptocurrency by market capitalization, has been trading in a sideways trend since its drop from the $28,000 level. As of the time of writing, BTC is currently valued at $26,800, having experienced significant declines across all time frames. The question on everyone’s mind now is whether this downturn will continue or if Bitcoin is headed for another crash. 

Can Bitcoin Holders Expect Another 40% Drop In The Coming Weeks

Cryptocurrency enthusiasts and traders closely monitor Bitcoin’s performance after its recent price drop. According to Miles Deutscher, an experienced cryptocurrency analyst, Bitcoin typically experiences a temporary rally after a decline, followed by a new low 5-8 weeks later.

Deutscher’s analysis shows that in 2020, Bitcoin’s price dropped by 56% within 59 days after rallying initially. Similarly, in 2021, Bitcoin’s price dropped by 24% within 47 days, and in 2022, Bitcoin’s price dropped by 42% within 40 days.

Bitcoin

With this said, with BTC trading at $26,800, if it experiences a 20% drop, its price will likely fall to $21,440, while a 30% drop would bring it down to $18,760. A 40% drop would result in a price of $16,080, potentially taking Bitcoin back to the lowest point of the 2022 bear market.

2023 Is Set To Be The Best Year For BTC Yet?

On the other hand, according to cryptocurrency analyst Adrian Zdunczyk, historical data suggests that pre-election years are the best-performing years on record for Bitcoin, with a 98.8% chance of a bull run in 2023. Even though the worst six months of the year usually begin with May, Zdunczyk believes a bullish trend will likely emerge in the coming months.

Looking at the weekly chart, Zdunczyk notes that Bitcoin is currently experiencing a complete throwback to the 200-week trend, completing the mean reversion. While a strong correlation (0.42) exists between Bitcoin and the S&P 500, the critical support near $25,000 has been defended. However, if this support level breaks, traders could see prices fall into the lower $20,000 area.

Furthermore, Zdunczyk believes more downside is possible if Bitcoin stays below $30,000. However, after a successful retest of the 200-day baseline, the support level has been confirmed by multiple techniques. Meanwhile, there has been a deterioration in the 50-day average volatility, and the long-term trend has been temporarily exhausted.

Zdunczyk’s analysis suggests a clear head and shoulders pattern has been completed, with a technical breakout target of $22,000. However, if the pattern fails to break, it could trigger a cascade rally beyond $35,000. 

Bitcoin

As seen in the chart above, the local resistance is currently at $28,000, backed by the BirbicatorPRO (BPRO) analysis. The bears maintain control until there is a powerful close above this level. Bitcoin bulls must wait for a decisive breakout above $30,000 to ensure a more reliable upward trend.

Bitcoin

Featured image from iStock, chart from TradingView.com 

Bitcoin Whales Break A Pattern Held Throughout Halving Cycles: Glassnode

On-chain data from Glassnode shows the Bitcoin whales have recently broken a pattern that was previously held through the halving cycles.

Bitcoin Whale Growth Had Previously Been Diminishing With Each Cycle

According to data from the on-chain analytics firm Glassnode, the current cycle is displaying an interesting deviation from the rule followed during the last few cycles.

Here, the cycles or the “epochs” for the cryptocurrency have been defined using the halving events. “Halvings” are periodic blockchain events that permanently cut in half the block rewards that the miners receive for solving blocks.

These events occur every time 210,000 blocks have been mined on the network, or approximately every four years. The reason they are generally selected as the start and end points for BTC cycles is that they carry profound impact on the economics of the market as the production rate of the asset is cut in half following them. This increase in the scarcity of the asset is a narrative so strong that bull runs have always followed the halving events.

The next halving is supposed to take place sometime in the first half of next year. Currently, miners receive 6.25 BTC for every block that they mine, so following this next event, they will only receive 3.125 BTC in their rewards.

Now, there have been many patterns that have held throughout the Bitcoin cycles, but one such trend looks to be breaking down with the latest epoch, as the below chart highlights.

Bitcoin Whales Growth Since Halving

The metric of interest here is the percentage growth that the number of whales have registered during each of the epochs. The analytics firm has defined “whales” as entities that are holding at least 1,000 BTC in their wallets.

Note that entities here don’t just refer to individual wallets, but also “a cluster of addresses that are controlled by the same network entity,” which are “estimated through advanced heuristics and Glassnode’s proprietary clustering algorithms.”

From the chart, it’s apparent that the number of whales went up by 436% in the first cycle, while they only went up by 139% in the second one. The third one saw even less growth at about 91%.

This would indicate that with each of these Bitcoin cycles, while the BTC whales had continued to increase in number, their percentage growth had been diminishing.

The current cycle, however, seems to have turned out different from these past cycles so far, as the growth in the number of whales has actually been stronger than the previous epoch this time.

Whales have grown by 98% since the start of the cycle, but it’s worth noting that there are still around 344 days to go before the next halving event. It now remains to be seen whether the indicator resumes the trend from the last epochs before the end of the current one, or if the cycle will truly end with the pattern being broken.

BTC Price

At the time of writing, Bitcoin is trading around $27,000, down 2% in the last week.

Bitcoin Price Chart

This Bitcoin Metric Is At A Crucial Junction, Will Bulls Find Victory?

On-chain data shows a Bitcoin indicator is currently retesting a crucial level that could decide the direction the market takes from here.

Bitcoin Short-Term Holder SOPR Has Plunged To A Value Of 1

As pointed out by an analyst in a CryptoQuant post, the short-term holders are currently selling at their break-even mark. The relevant indicator here is the “Spent Output Profit Ratio” (SOPR), which tells us whether Bitcoin investors are moving their coins at a profit or at a loss right now.

When the value of this metric is greater than 1, it means the average holder in the market is currently selling their coins at a profit. On the other hand, the indicator having values below this threshold suggests the market as a whole is realizing a net amount of loss.

The level at which SOPR becomes exactly equal to one implies that the loss realization is exactly equal to the profit realization right now, and hence, the average investor is just breaking even on their investment.

In the context of the current topic, the entire market isn’t of interest; only a segment of it: the “short-term holders” (STHs). The STHs include all BTC investors that bought their coins within the last 155 days.

Now, here is a chart that shows the trend in the 14-day moving average (MA) Bitcoin SOPR specifically for these STHs over the last few years:

Bitcoin STH SOPR

Historically, the Bitcoin STH SOPR has followed a curious pattern. During bullish periods, the indicator has generally stayed above the line where the metric’s value becomes 1. This makes sense, as rallies allow the STHs many profit-taking opportunities, so the majority should be selling at some gains.

What’s actually interesting, though, is that whenever the metric has dropped to the 1 line, it has provided support to the price (and has also made the indicator rebound back above it). Examples of this have been marked with the green arrows in the graph.

As already mentioned before, the 1 line signifies the level where the average STH is just breaking even, meaning that they are selling at the price at which they acquired their coins, that is, their cost basis.

The reason why this level acts as support during bullish trends is that the investors see their cost basis as a profitable buying opportunity (since they believe the price would go up in the near future). So, a large amount of buying takes place here.

In bear markets, the opposite behavior is seen; the level acts as resistance to the price since selling tends to happen at it. Because of this pattern, the indicator’s behavior about the 1 level can provide hints about whether a bullish or a bearish regime is active currently.

Recently, the indicator has once again dipped to this crucial level. If the Bitcoin rally is still on right now, then the Bitcoin STH SOPR should observe a rebound here. This has already happened once during this rally, as the price felt support at this level back in March.

If, however, the retest ends up failing, then it may mean that a transition back to a bearish period may have occurred for the cryptocurrency.

BTC Price

At the time of writing, Bitcoin is trading around $27,000, down 2% in the last week.

Bitcoin Price Chart

Bitcoin Bullish Structure Holds Firm: $31,000 Breakthrough Imminent?

In the world of cryptocurrency, the market can be a confusing and volatile place. This is especially true for Bitcoin (BTC), which has seen its fair share of ups and downs in recent days. Jackis, a well-known analyst in the crypto community, has recently commented on the current state of the market, and his words may be of interest to investors.

Bitcoin’s Potential For A $31,000 Breakthrough

According to Jackis, Bitcoin’s weekly structure remains bullish, which means that despite any potential dips, the overall trend is upward. He suggests that even if there is a deeper pullback, it can be seen as a potential higher low in a bullish trend, which should eventually lead to a break of the $31,000 level. However, Jackis also warns that this bullish trend must be proven, and until then, investors should be cautious.


On the daily chart, Jackis notes that the market has just swept the range low of $26,500, which could be seen as a potential deviation. However, despite this, the overall structure on the daily chart remains bearish, and investors should treat it as such until further highs are reclaimed. He suggests that while there may be a decent buyback from the higher time frame (HTF) range lows, the market is still in a bearish structure. Until there is evidence to the contrary or a convincing low time frame (LTF) structure too long, Jackis expects a new lower low to be seen.

Furthermore, according to Jackis, the current structure of the Bitcoin market is bullish, but this could change quickly. He notes that the market is currently trading at a premium, which is known as the Golden Zone, compared to the H4 Swing. To continue pushing higher, the market needs to show real strength at this level. However, the current market conditions are challenging to read, and there are arguments for both bullish and bearish positions.

Bitcoin And Ethereum Part Ways, Correlation Hits Lowest Point In Two Years

A recent report by Kaiko, a leading provider of market data and insights, has shed light on an interesting trend in the Bitcoin and Ethereum (ETH) markets. According to the report, the correlation between Bitcoin and Ethereum has hit its lowest level since November 2021. The rolling correlation between the two cryptocurrencies has weakened from 96% to 77% since mid-March, indicating that they are increasingly being driven by divergent idiosyncratic factors.

The report highlights that Ethereum has lost momentum since the Shapella upgrade, dropping by nearly 14%, while Bitcoin is down by around 11% over the same period. This divergence suggests that the two cryptocurrencies are being influenced by different factors, rather than moving in tandem as they have in the past.

As of this writing, the largest cryptocurrency on the market, Bitcoin, is trading at $27,000, which is slightly below its 50-day Moving Average (MA). While BTC has managed to reclaim the $27,000 level, it has seen a minor decline of 1.4% over the last 24 hours.

Bitcoin

Featured image from iStock, chart from TradingView.com 

Bitcoin Price Analysis: Here’s What’s Holding Back A Rally To $30,000

The Bitcoin price remains in a crucial situation in which neither the bulls nor the bears have been able to gain the upper hand so far. While the bears feel comfortable that they can push the price below $25,000 due to a perceived head and shoulders pattern, the bulls are scrambling to invalidate this thesis.

Both sides still have a chance to win. While the bulls want to prevent a daily close of Bitcoin above $27,550, the bulls are fighting to do just that. The goal is to break the H&S neckline to confirm the invalidation of the pattern.

Why $30,000 Is A Big Challenge For Bitcoin Right Now

However, there are some market forces that are making things difficult for both the bulls and the bears. Some of these factors have been compiled by the analyst “MAC_D” for CryptoQuant. According to him, the rise in the Bitcoin price could be limited for the time being because of the decline in US BTC holdings.

CryptoQuant’s data shows that US institutional investors’ BTC holdings have steadily declined in recent months, presumably due to the uncertain regulatory environment and Operation Choke Point 2.0. In the past, a bull market has always been accompanied by an increase in US institutional investors’ BTC holdings.

This price catalyst could therefore be out of play for the moment until courts or new legislation is created in the US for Bitcoin and crypto. Alternatively, US entities could of course turn to international exchanges and DEXs.

A second obstacle for the bulls is the total supply of stablecoins, which shows how large the buying capacity is in the crypto market. It peaked at $99 billion in February 2022 and now stands at $71.1 billion, suggesting that buying power in the crypto market has declined.

Third, the analyst argues that there is a “lack of new smart money players”. This is said to be “largely caused by supply and demand factors”, which should also be considered in light of the macro situation (tight monetary policy by the US and European central banks, recession fears).

Liquidity Woes And Rising Spot Demand

Moreover, there are other factors that could complicate a rally to $30,000 in the short term. As NewsBTC reported, Jane Street and Jump announced that they are ceasing their market-making activities in the US. As digital asset data provider Kaiko has investigated, this may have a significant impact on market liquidity.

Interestingly, the market depth for BTC has barely changed since the announcement or last month and has remained at a low level. Kaiko interprets this to mean that Jump and Jane Street have already reduced most of their exposure (or have yet to make these adjustments).

Due to the low market depth, Bitcoin’s intraday volatility has increased significantly. Nonetheless, BTC’s 30-day rolling volatility remains low at around 36%, well below the 2020-2022 average, Kaiko said.

Another inhibiting factor could be the net dollar liquidity in the financial markets. Analyst Ted (@tedtalksmacro) recently stated that net dollar liquidity is back to end-March levels. According to him, the fair value for BTC is therefore between $27,500 and $28,000.

In the short term, it also requires rising spot interest in Bitcoin. As analyst @52skew writes, spot deltas & CVDs show that the overall spot delta has been quite positive in recent days.

Moreover, he notes how the Binance spot market is still largely driving the trends, with Coinbase also recently leading the moves with a strong positive spot delta (market buying). In his latest tweet, the analyst predicted:

Short liquidity taken & now market is hunting long liquidity. Note funding rate calculation will swing both ways depending on spot & perp difference within funding periods. For now Binance spot is leading the way.

Bitcoin Binance Open Interest

At press time, the Bitcoin price stood at $27,071 and was rejected on the first attempt to break the neckline of the H&S pattern yesterday.

Bitcoin price

Bitcoin Bounce-Back: How Call Buyers Are Fueling The Crypto Recovery

Bitcoin (BTC) has recently experienced a brief drop below its crucial support level but has quickly rebounded to the current price of $27,300. This has resulted in the return of Call buyers, who are hoping that the level will hold and push the price upward. This has resulted in a fast-paced market, with Gamma Call buyers focusing on May 18-26th $28,000-$29,000 Calls and $28,000-$30,000 Call spreads, resulting in a net profit of $2,500, according to a recent analysis by Deribit Insight. 

The Call Of The Hour  

The recent surge in Call buying, although very near-dated, has resulted in an increase in the 7-14 day Implied Volatility (IV) after a weekend lull and pressure from the previous week. It is important to note that the $27,300 level is pivotal to the market’s performance, according to Deribit Insight. Being tested a couple of times already, a good push-up may compound confidence among investors. Vice versa, if the market fails to hold this level, it may result in a decline in the market’s confidence.

According to the analysis firm, Bitcoin’s net positioning still appears bullish, despite some setbacks in the market. Recently, there was news of a ‘fake’ government selling wallet, which temporarily dashed hopes for Bitcoin bulls. However, market participants are still looking for momentum to rebuild, and there are signs that bullish sentiment is still strong.

On the other hand, Bitcoin is facing stiff resistance ahead, particularly between the price range of $28,180 and $28,990. According to the crypto analyst Ali, this is a critical area where 1.24 million addresses have bought 973,220 BTC. 

However, on the flip side, there is also a crucial support level at $26,490. Failing to hold above this level could trigger a steeper correction in Bitcoin’s price, potentially leading to a drop to $24,100 or $23,190, according to the analyst.

RSI Signals Strong Support At Key Level For Bitcoin 

According to the crypto analyst Crypto Con, the weekly Bitcoin Relative Strength Index (RSI) is attempting to make support on a very significant level – the 56 RSI value line. This line has marked local bottoms for every bull cycle, suggesting that it is an important level of support for the cryptocurrency.

Bitcoin

The more retests at this level, the healthier the price action is, as it indicates that buyers are willing to step in and support the market at this level. This is a positive sign for Bitcoin bulls, as it suggests that the current uptrend may continue for some time.

The growing adoption of Bitcoin as a store of value is another factor that may be driving bullish sentiment in the market. Many investors see Bitcoin as a viable alternative to traditional investments, especially in an environment of low-interest rates and high inflation. This sentiment is reflected in the significant milestone achieved, with more than 1 million wallets holding at least 1 BTC, according to Satoshi Club.

At the time of writing, the largest cryptocurrency by market cap is trading at $27,400, reflecting a 1.8% gain in the last 24 hours. However, the 50-day Moving Average (MA) currently stands at $27,600, which could act as a crucial resistance level that needs to be overcome if bulls wish to make another attempt at the $30,000 mark.

On the other hand, if Bitcoin experiences further price declines, the 200-day MA, indicated by the yellow line on the chart below, could serve as a significant threshold for the cryptocurrency. This key level, located at $24,700, may halt any further price drops and prevent selling pressures from mounting in the near term and delaying Bitcoin’s bull run toward new highs. 

Bitcoin

Featured image from iStock, chart from TradingView.com 


Bitcoin Price Double Fractal Points To “Extended” Parabolic Rally

Bitcoin price seems to merely be grinding upwards, with a dusting of chop in between. What corrections have arrived have been minimal, and are shockingly similar in both time and price.

This fractal behavior could be a sign of an important Elliott Wave signal, that not only says that BTCUSD is about to go parabolic, but that the rally should be “extended” in its price movement.

Bitcoin Price And Time Fractal Discovered

After a small recovery from the November 2022 bottom in crypto markets, Bitcoin corrected sharply. The correction was short-lived, due to a sudden banking crisis emerging. BTCUSD then made another run higher to above $30,000 per coin, and is once again correcting after a second, roughly 50% upward move.

The two similar sized moves took placed in approximately the same amount of time. Superimposing a fractal of one above or below the other demonstrates just how similar they are in time and price.

This sort of behavior is a fairly common occurence in Elliott Wave Principle called a 1-2/1-2 setup, and it could mean the crypto market is about to explode higher.

Bitcoin price double fractal

All About The 1-2 1-2 Elliott Wave Setup

The 1-2/1-2 is a phenomenon when a smaller degree wave 1 and 2 take on a similar shape and length of the previous, larger degree wave 1 and 2.

Much like the first 1-2 is a larger degree wave, and the second 1-2 is a smaller degree wave, their appearance suggests an even larger degree wave will be extended. According to a description, a “1-2/1-2 structure is an indication that the larger degree impulse wave in development is extending.”

“The 2nd wave 1-2 structure needs to be similar in proportions to that of the first 1-2 structure, not taking much more, if any more, time than the first.  Remember, you are actually seeing the development of a smaller degree impulse wave, so expect it to be a bit smaller than the larger degree structure.”

“An extension suggests a massive elongation of the impulse pattern,” a website further reads.

After a completed wave 2 correction, wave 3 should begin. However, if price stops short of expectations and forms a similar sized pattern as the first waves 1 and 2, it suggests a second set of waves 1 and 2 that help increase the size of the overall wave 3 that was first anticipated.

This type of behavior has been spotted in not only Bitcoin. It is also evident in Chainlink, Litecoin, and the Total Crypto Market Cap chart. Several coins exhibiting the pattern could point to full participation across the market in the next more substantial rally.

Bitcoin Reclaims $27,000, Here Are The Factors Driving The Recovery


Bitcoin began another recovery trend over the weekend and has been on a bullish path since. This follows last week’s incredible bearish movement which saw the digital asset drop below the $26,000 mark for the first time in over a month. However, the bulls are beginning to pick up steam once more, but what could be driving it?

Bitcoin Accumulation Continues

Now, while the decline in prices may have been a deterrent for some, others had taken the opportunity to fill up their bags. The ‘Wholecoiner’ movement consists of Bitcoin supporters who aim to get their holdings to at least 1 BTC, making a whole coin.

This trend has been rising over the last few years and recently hit an important milestone over the weekend. As of today, there are now over 1 million addresses that are holding at least 1 BTC for the first time in history, data from on-chain aggregator Glassnode shows.

Bitcoin addresses

The new milestone was reached at a time when cryptocurrencies in the space were bleeding, presenting a unique opportunity for investors to get in at lower prices. The expectation of better prices from here on out, as well as the uncertainty in the banking industry, has also been a driver in this accumulation trend.

Naturally, when investors are accumulating coins as they are now, it reduces the supply in the market. A reduced supply creates scarcity and this scarcity can lead to higher prices. So such as scenario could be what played out during the weekend.

Bitcoin price chart from TradingView.com

BTC Investor Sentiment Is On The Rise

As the price of Bitcoin declined over the last week, investor sentiment went down with it, causing the Crypto Fear & Greed Index to fall below the 50 level once more. While the index still remained in neutral territory, it was bearish given that just a couple of weeks ago, the index was sitting at high greed.

However, as BTC’s price has bounced back, sentiment has followed suit. The index is now sitting at a neutral score of 50. This puts the bears and the bulls at a stalemate, meaning each side would have to show higher strength than the other to swing it in their favor.

Despite not being back in green, it is an improvement from yesterday’s score of 48, which was dangerously close to plunging the investor sentiment back into the fear territory.

If BTC manages to maintain its current recovery trend, then investor sentiment will grow increasingly positive. However, support at $27,000 is still quite shaky and this means bears could easily take over the market, especially if momentum falls.

Is This The Perfect Time To Buy Bitcoin? TD Sequential And RSI Suggests So

Bitcoin (BTC) investors have been closely monitoring the cryptocurrency market in recent days due to Bitcoin’s significant drop in price. The market’s largest cryptocurrency has shown a downtrend in its price action and has lost its key support level at $27,200, which was previously noted by the 50-day moving average (MA).

Despite the bearish trend, trader and analyst Ali suggests that there may be some hope for bulls. Though the market is currently in a state of decline, Ali believes that there is still a chance for BTC to experience a reversal shortly.

Buy The Bitcoin Dip?

Ali points to the TD Sequential indicator on the Bitcoin 4-hour chart, which has shown a buy signal. In addition, a bullish divergence is developing on the Relative Strength Index (RSI), indicating a potential reversal shortly. 

Bitcoin

Bitcoin has been experiencing a period of volatility, with the cryptocurrency facing a strong resistance level at $28,000 in the past few days, following the release of the Consumer Price Index (CPI) rates by the Federal Reserve (Fed).

Although trader and analyst Ali believes that if Bitcoin can hold above the $26,000 support level, there could be an upswing to either $26,860 or $27,570. On the other hand, Ali suggests that if Bitcoin fails to hold above the $26,000 level, it could trigger a further drop to $25,200.

However, there is some good news for Bitcoin bulls, as the 200-day moving average (MA) is currently placed at $24,700. This level could potentially act as a crucial threshold for BTC, serving as a bottom line for the cryptocurrency in the short term.

Bitcoin And Crypto Market Vulnerable To Short Squeeze?

According to the latest report by the Singapore-based digital asset trading firm, QCP Capital, this week’s sell-off has caused Bitcoin to fall through the head and shoulders trendline, but a close below $26,500 is still preventing a larger breakdown.

Additionally, Bitcoin has a negative divergence on momentum indicators, leading QCP Capital to be biased towards a near-term break lower, potentially to the $25,000 mark and then to the $20,000-$22,000 level.

Despite this, QCP Capital views the lower level of $20,000-$22,000 as a high-conviction medium-term buy zone. The firm has even sold physically settled puts at this level before, indicating its confidence in the cryptocurrency’s long-term prospects.

Related Reading: Key Support Levels To Monitor As Ethereum Price Slows Down

Furthermore, according to Chart 3 in the report, as seen below, an increase in volatility has historically led to a strengthening of the USD and a weakening of risk assets such as BTC.

The report notes that while the outcome of the current political drama in Washington is uncertain, the market’s response in terms of implied volatility across assets will be key in determining the next trend direction.

Bitcoin

The report also suggests that a sharp increase in volatility could lead to a move lower for BTC and other risk assets. This could be a concern for investors who have seen BTC reach new annual highs in 2023. However, volatility can create opportunities for traders who can navigate the market’s ups and downs.

As of this writing, the largest cryptocurrency in the market, BTC, is currently trading at $26,300, down by 2.1% in the last 24 hours. 

Bitcoin

Featured image from iStock, a chart from TradingView.com

Does The Bitcoin Price Dump Signal The Start Of Another Bear Market?

The last two days have been especially rocky for the Bitcoin price as it has fluctuated heavily between trying for a recovery and then crashing even further. As a result of this, the price of the digital asset has revisited the $26,000 level once more and the new bearish trend may point to more decline for the cryptocurrency.

Bitcoin Loses $27,000 Support

After a rollercoaster response to the CPI data release, the price of Bitcoin had reclaimed $27,000 and the bulls quickly tried to establish support above $27,000. This level would hold for about a day, but by Thursday, bears made easy pickings of it, dragging the price of BTC down to as low as $26,200.

This decline in price has dragged the cryptocurrency to dangerously bearish levels. One of these is the fact that it is now trading below its 50-day moving average. For a digital asset like BTC, maintaining its 50-day SMA is important, especially if the asset is going to see an upside in the coming days.

Bitcoin price chart from TradingView.com

However, as this trend continues, it will not be surprising to see BTC lose footing above its 100-day MA. If this happens, then the digital asset could be in free fall for a while which could see it return to the $20,000 level. Unless there is a sudden turn in investor sentiment, the bear market may have returned in full bloom.

Crypto Investors Becoming Wary

As the price of Bitcoin has suffered, so has the sentiment of investors moved into the more negative territory. BTC’s rise above $31,000 brought the Fear & Greed Index to a high of 69 in April. However, there has since been a shift in how investors have been looking at the market.

Over the last three weeks, the Fear & Greed Index has shown a 20-point decline which puts the market back into neutral territory. While this level is not necessarily bad when taken at face value, the fact that the index has declined from greed back to neutral is concerning.

Bitcoin Fear & Greed Index

If anything, this decline indicates that investors are becoming more wary of the market. When things like these occur, it means that investors are not willing to put money into the market. Volumes decline as a result of this and price fall in response to the lack of momentum.

Currently, support for BTC lies at $26,000 which is shaky at best. Unless there is a significant accumulation of the digital asset over the coming days, then the weekend which is characterized by low volumes and volatility could prove detrimental for the cryptocurrency

At the time of writing, BTC is changing hands at a price of $26,291, down 4.22% in the last 24 hours.