Bitcoin briefly pushed into the $108,800 level a few hours ago but was once again unable to reclaim higher prices, reinforcing the key resistance just below its all-time high. This rejection has left the market in a state of caution, with investors expecting increased volatility in the coming sessions. As BTC continues to hover below the $109,300 mark, traders are watching closely for signs of either a confirmed breakout or a potential pullback.
Adding a new layer to the current setup, top analyst Ted Pillows shared a notable development in Bitcoin dominance. According to Pillows, the Bitcoin Dominance chart is now showing a daily bearish divergence—a classic signal that often precedes a shift in momentum from Bitcoin to altcoins. This divergence occurs when BTC dominance trends higher while momentum indicators begin to weaken, suggesting that Bitcoin’s relative strength may be peaking.
For altcoin investors, this could be an early signal of a shift. Historically, bearish divergences in dominance have lead to strong altcoin rallies, as capital begins flowing from BTC into higher-beta assets. While Bitcoin consolidates near resistance, attention may soon shift toward altcoins, setting the stage for a possible altseason.
Bitcoin Consolidates As Charts Signal Altcoin Rotation
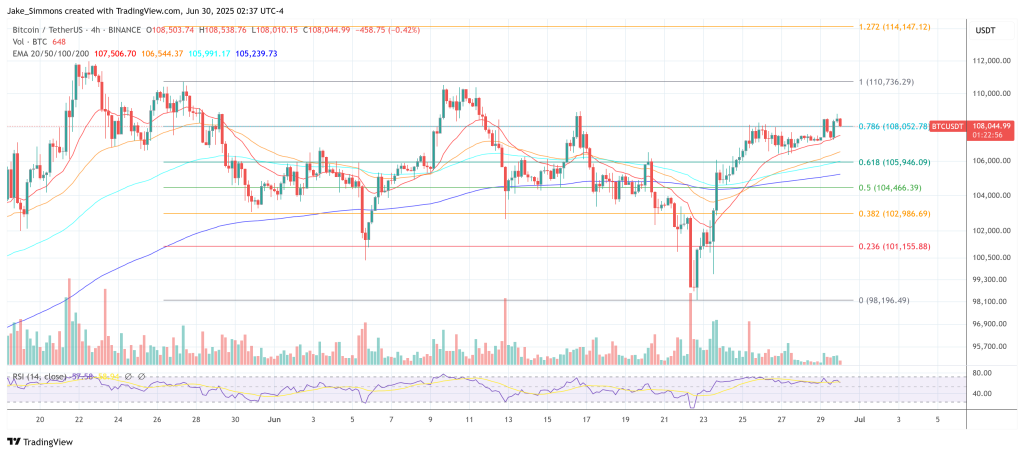
Following the resolution of global tensions between the US, Israel, and Iran, Bitcoin surged above the $105,000 level, signaling renewed confidence across global risk markets. The move marked a key recovery from previous uncertainty, with BTC taking back critical support and shifting focus back toward the $110,000 resistance zone. However, despite the initial breakout, Bitcoin has struggled to push into uncharted territory. Price action remains choppy and directionless, with the market hesitating ahead of what many believe could be a decisive move.
Analysts continue to call for a breakout, citing strong accumulation trends, improving macroeconomic conditions, and a bullish long-term structure. Yet the inability to break above the $109,300–$110,000 range raises concerns about weakening momentum. The longer Bitcoin remains capped below resistance, the more likely it is that capital may begin to rotate into other parts of the market.
Top analyst Ted Pillows recently shared key insights supporting that thesis. According to Pillows, Bitcoin dominance is showing a daily bearish divergence—a classic sign of impending trend reversal. As BTC dominance climbs but momentum weakens, it suggests that Bitcoin’s recent strength may be fading, and a shift toward altcoins could be underway.
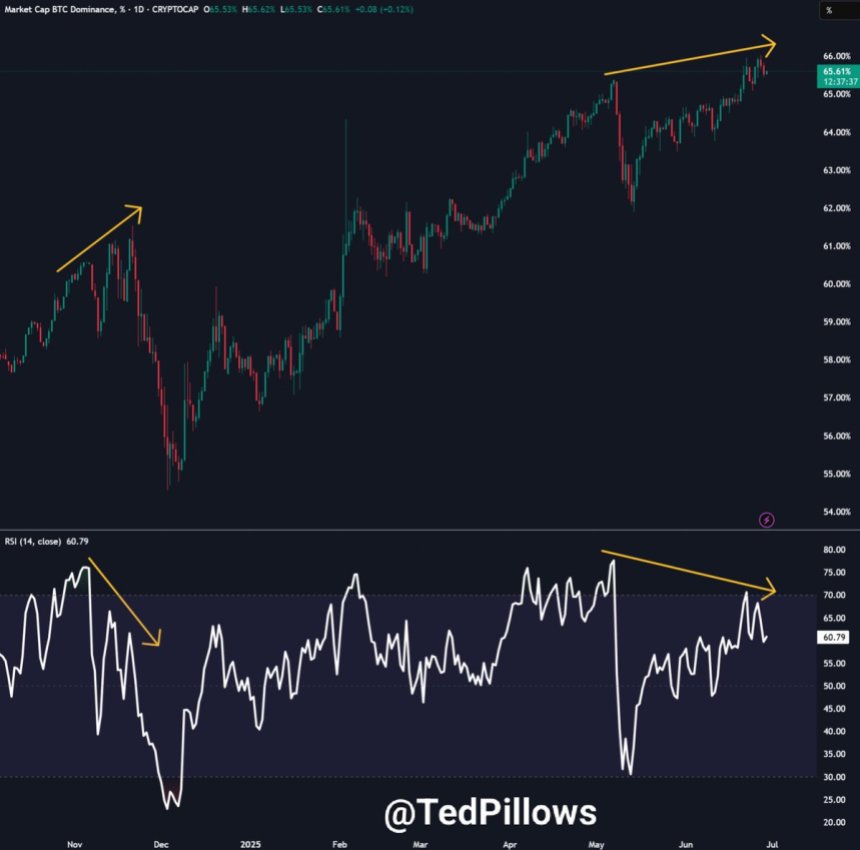
Historically, bearish divergences in BTC dominance have often preceded sharp corrections in Bitcoin and explosive rallies across the altcoin market. As Bitcoin consolidates and its dominance loses strength, conditions may be forming for the next big altseason. While nothing is guaranteed, the combination of geopolitical relief, market indecision, and technical signals suggests that a sharp rotation could be close. Traders are now watching both BTC price and dominance levels closely, knowing that once momentum shifts, the move could be swift and powerful.
ETH/BTC Chart Shows Signs Of Reversal
The ETH/BTC weekly chart reveals a prolonged downtrend that has persisted since late 2022, with Ethereum consistently underperforming against Bitcoin. Since peaking above 0.085 BTC in late 2022, the pair has steadily declined, now trading around 0.0228 BTC—a level not seen since 2020. This confirms that Bitcoin has been the clear market leader for nearly two years, adding most of the capital inflow during bullish phases while altcoins, including Ethereum, lagged behind.
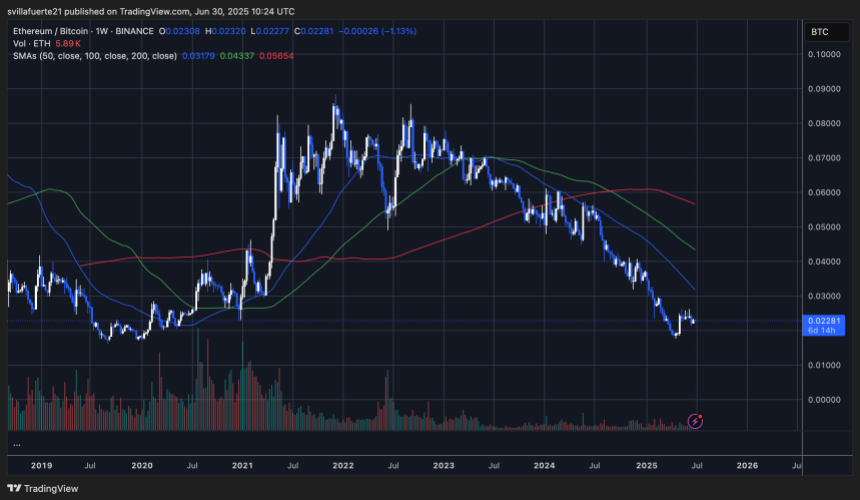
However, current price action shows early signs that this trend may be nearing its end. ETH/BTC appears to have found a local bottom, just above the 0.02 BTC zone, after a steep drop. Although the pair remains well below the 50 (weekly), 100, and 200 moving averages, the selling momentum has clearly slowed, and volume has begun to stabilize.
This phase suggests that a swing could be forming. If Ethereum can reclaim higher support levels and Bitcoin dominance continues to show bearish divergence—as noted in recent market analyses—the ETH/BTC ratio could start trending higher once again. A rotation from Bitcoin into Ethereum and other altcoins may soon follow, potentially marking the beginning of a new phase in the crypto cycle where altcoins start to outperform.
Featured image from Dall-E, chart from TradingView
")
")


