Dogecoin (DOGE), the Shiba Inu-faced darling of the 2021 memecoin frenzy, has found itself shivering in the current crypto winter. Once a symbol of retail investor exuberance, DOGE has plummeted over 70% from its sky-high peak, leaving its future shrouded in uncertainty.
DOGE Feels The Crypto Frost
While Bitcoin, the heavyweight champion of the crypto world, grabs headlines with its recent wobble, the impact on memecoins like DOGE has been brutal. Unlike Bitcoin’s divided analyst opinions, the sentiment surrounding DOGE is decidedly bearish.
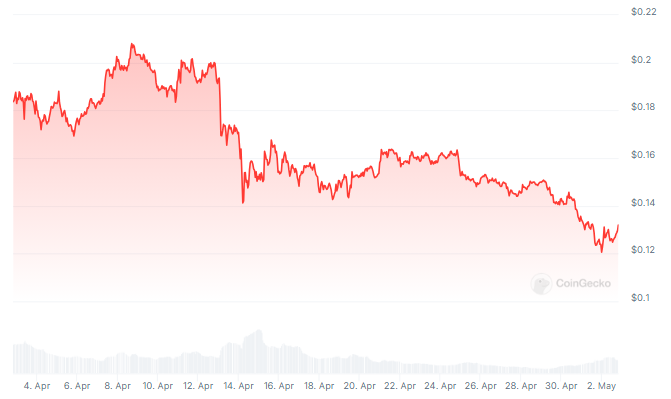
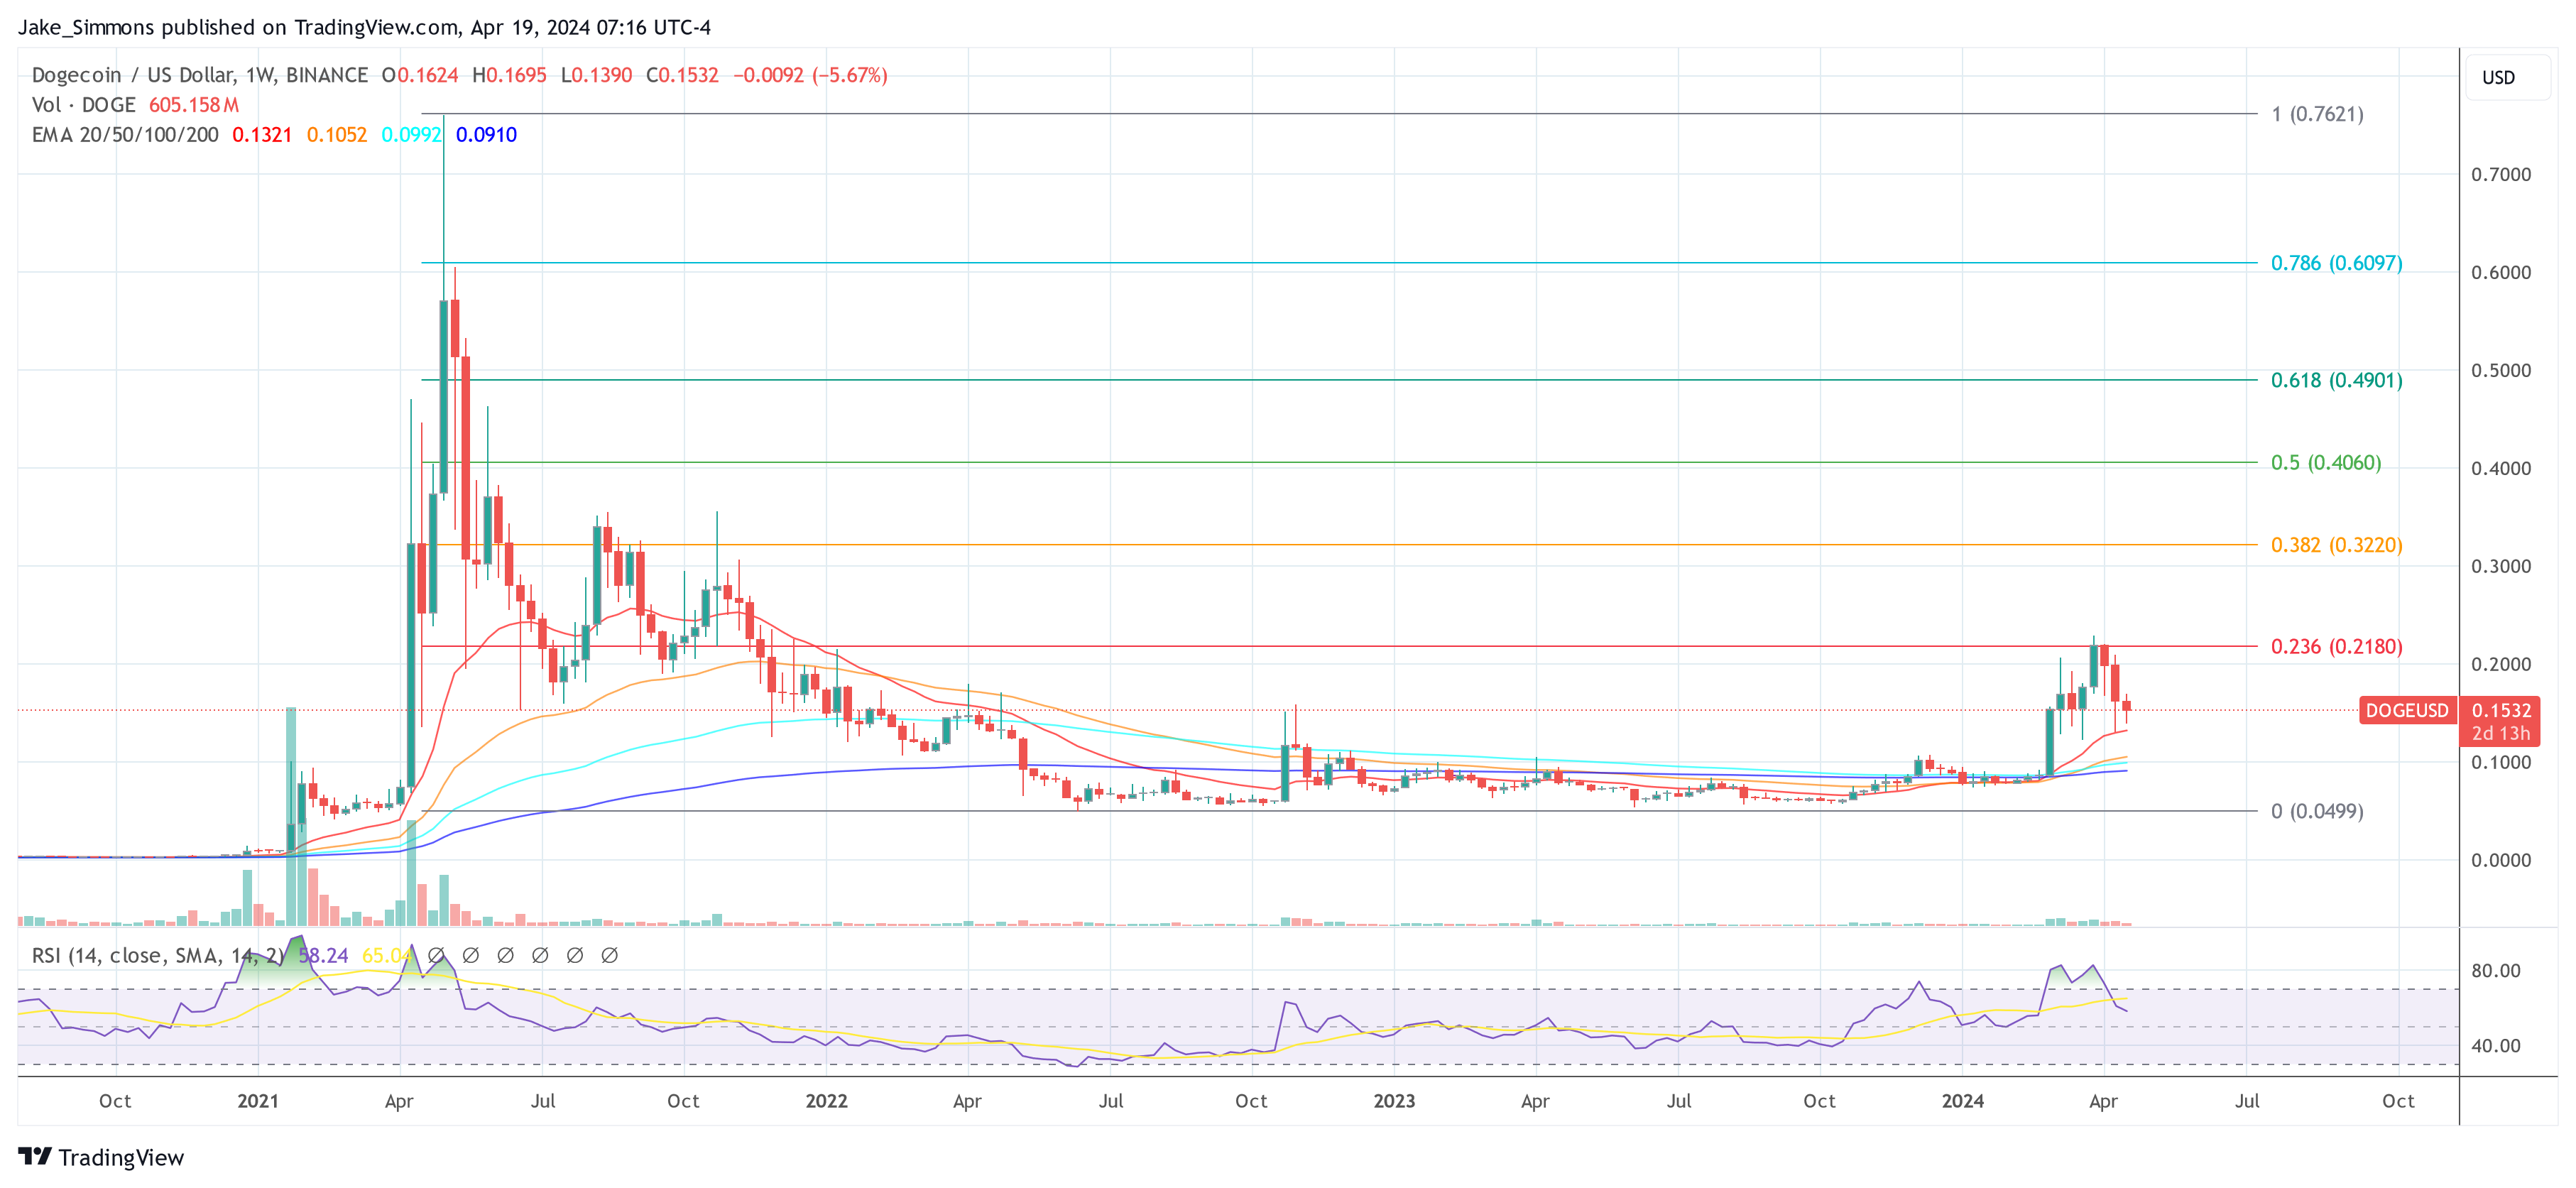
At the time of writing, the memecoin was trading at $0.132, down 5.4% up the last 24 hours but sustained a 20% loss in the last seven days, data from Coingecko shows.
Is DOGE A Canary In The Crypto Coal Mine?
Some analysts believe DOGE’s struggles are a canary in the coal mine for the entire crypto market. They said if even a historically high-flying memecoin like Dogecoin can’t hold onto gains, it raises serious concerns about risk appetite in the crypto space in general.
Whales Accumulating DOGE: A Glimmer Of Hope?
However, a glimmer of hope flickers for the dethroned meme king. On-chain data suggests an increase in large wallet purchases of DOGE, hinting at potential accumulation by wealthy investors. This “contrarian” behavior could be a sign that some whales are using Coinglass or similar platforms to track Dogecoin derivatives and believe the coin is undervalued and ripe for a comeback.
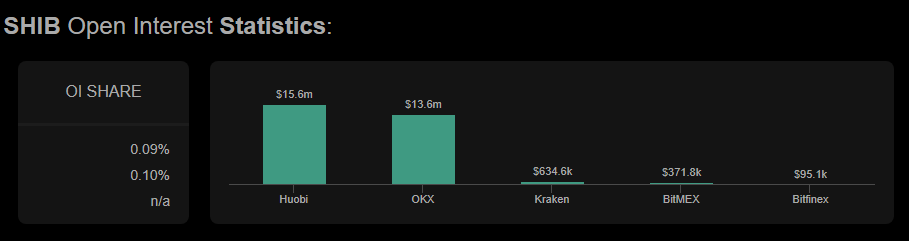
Coinglass, a popular cryptocurrency data provider, offers insights into factors that might be influencing the whales’ decisions. By analyzing metrics like open interest, funding rates, and liquidations on Coinglass, these investors might see an opportunity to buy DOGE at a discount.
Related Reading: Solana Crawls: Network Update Fails To Fix Traffic Jam, Price Feels The Pinch
In a similar development, Whale Alert, a well-known blockchain tracker, has reported that a DOGE whale arranged two large transactions in a single day. Some 150,000,000 Dogecoins were transferred in the first transaction, and an additional 76,316,694 DOGE were transferred in the second, for a total of almost 226 million DOGE. At the time, the meme cryptocurrency was worth around $40 million in fiat money.
150,000,000 #DOGE (21,281,922 USD) transferred from #Robinhood to unknown wallethttps://t.co/7U1CEfr2ZT
— Whale Alert (@whale_alert) April 29, 2024
Can Dogecoin Thaw The Crypto Winter?
The coming weeks will be critical for DOGE. The return of positive social media sentiment, coupled with continued accumulation by whales who might be strategically using Coinglass for market analysis, could be the spark that reignites the DOGE rally. However, if the broader market weakness persists, DOGE’s summer might be spent shivering in the doghouse.
Featured image from Pixabay, chart from TradingView

 (@el_crypto_prof)
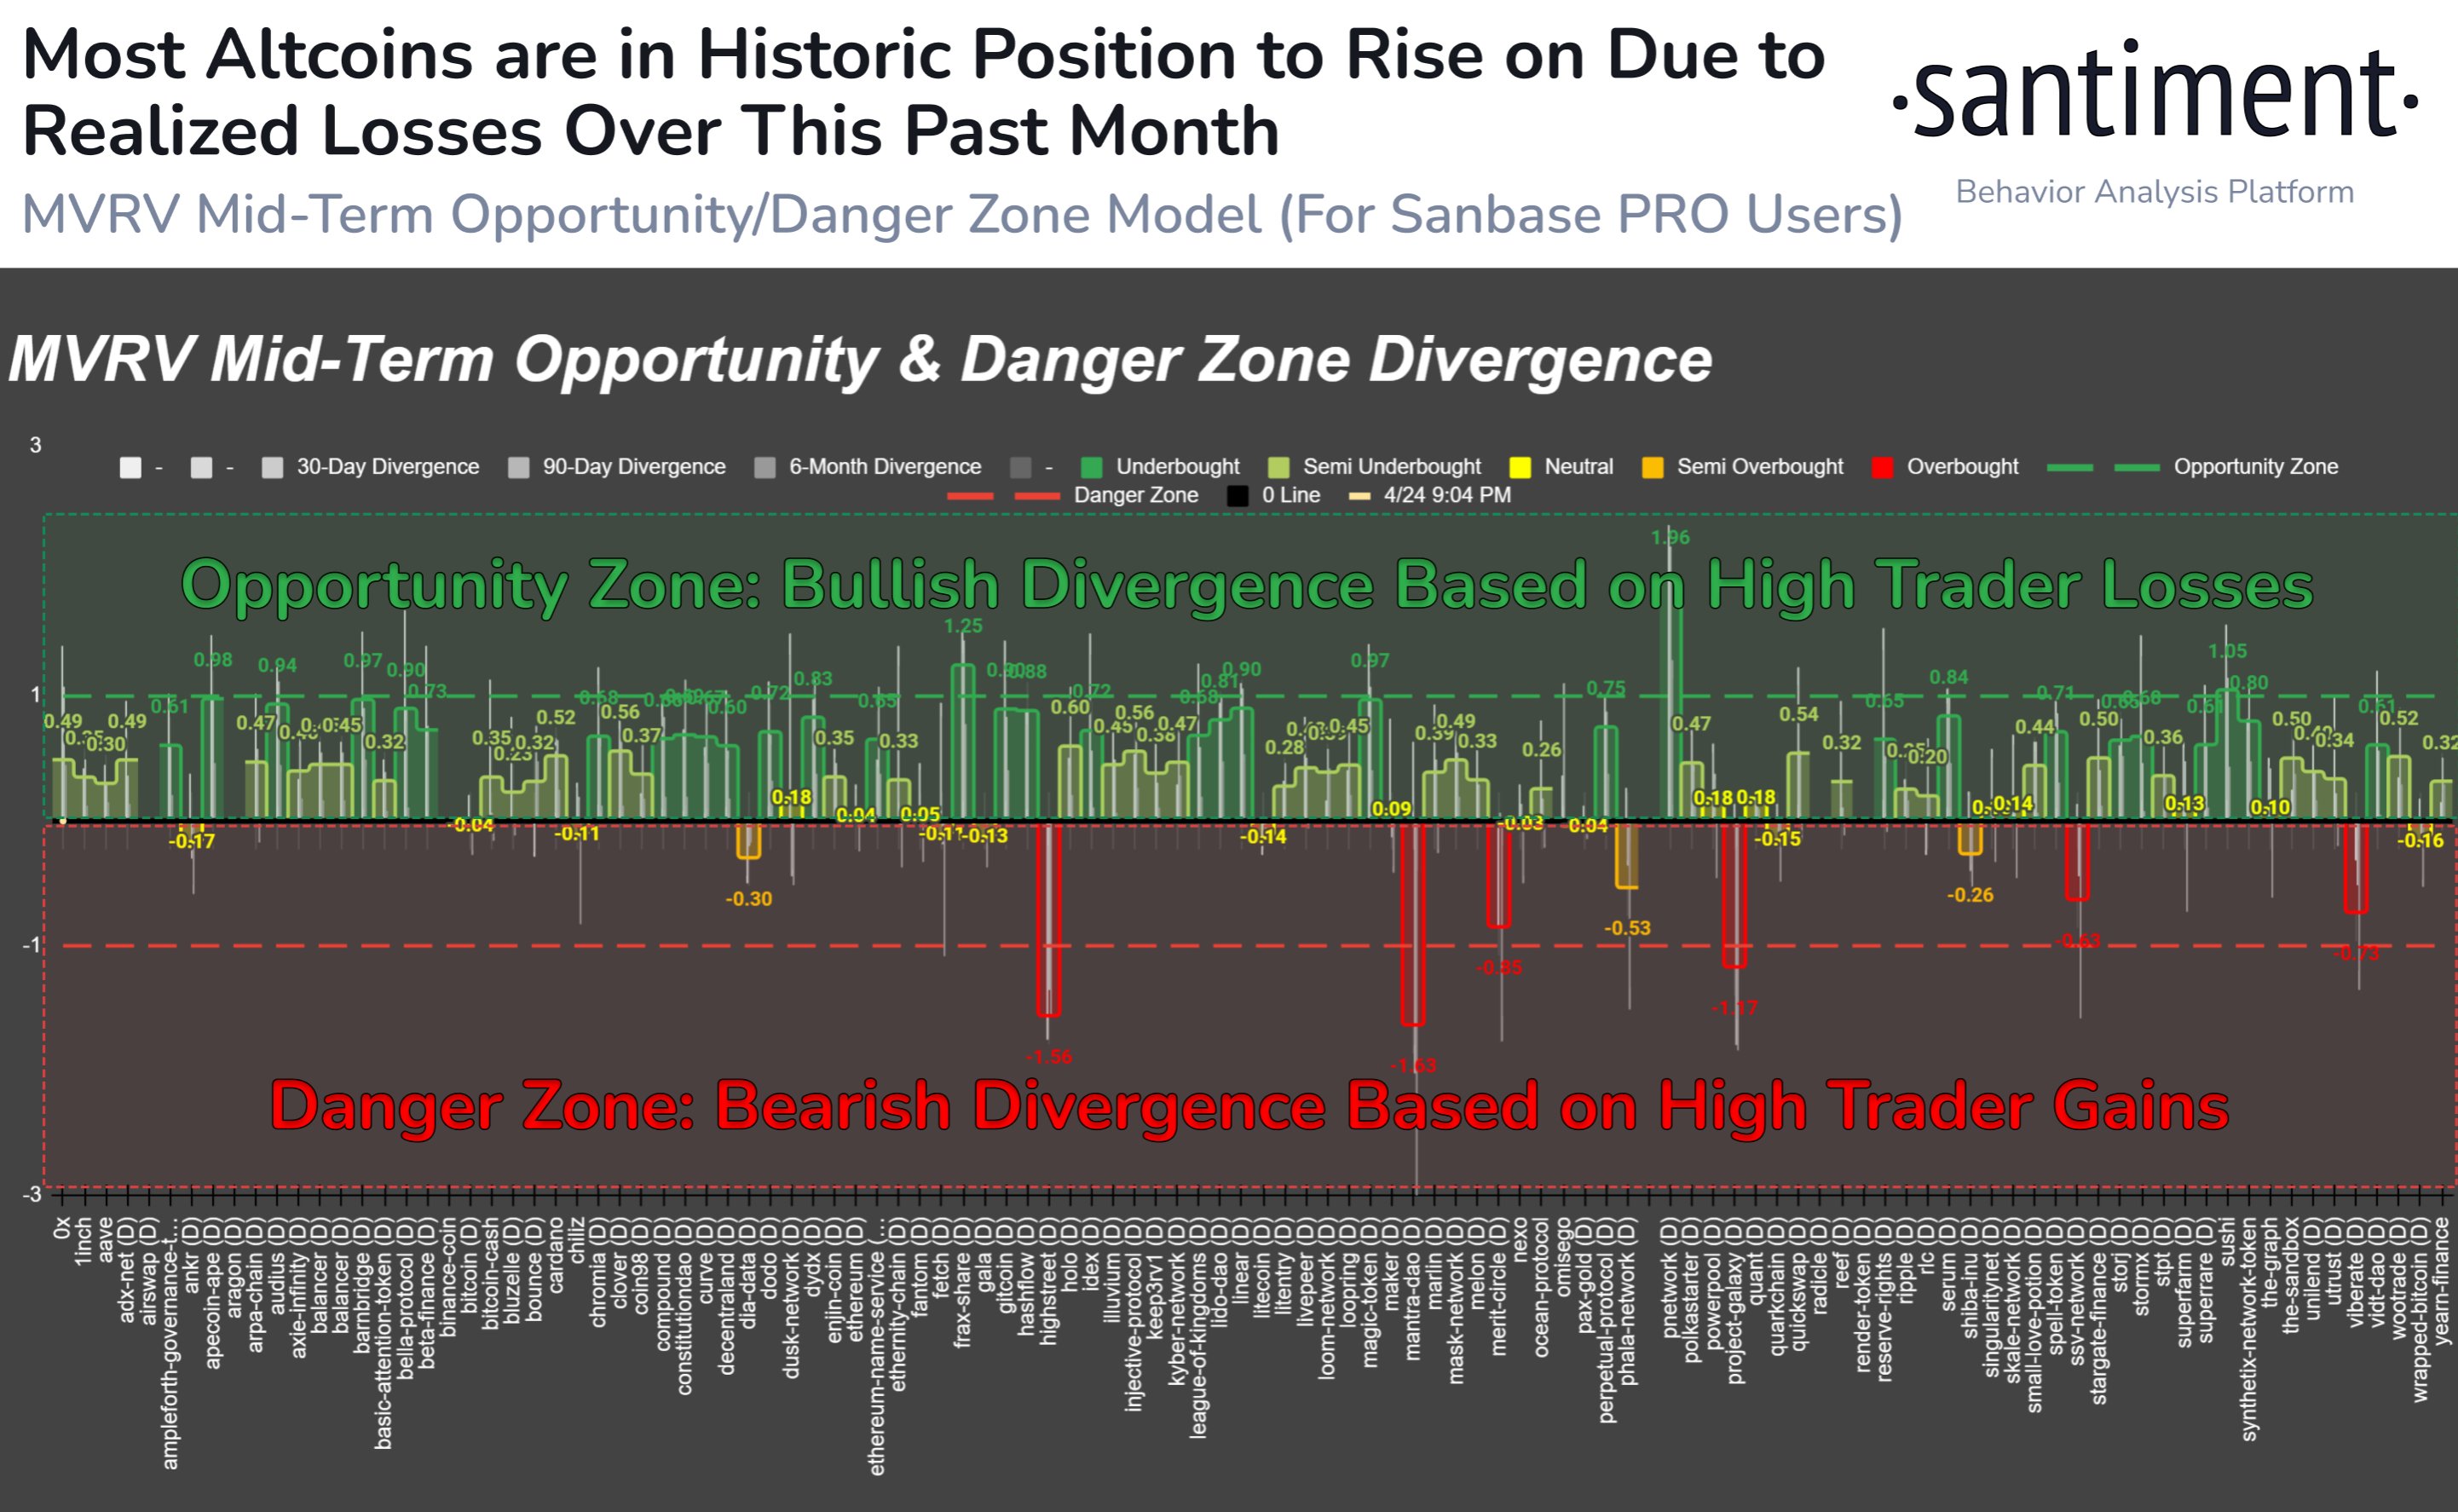
 According to our model, the mid-term gains and losses by average wallets indicate heavy realized losses across most
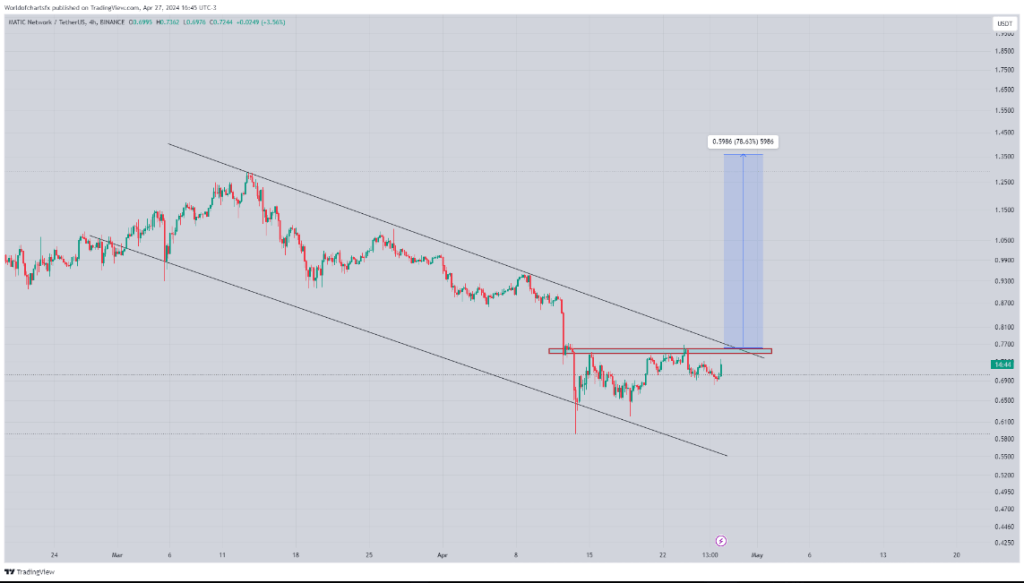


 The measured move suggests a target range between Fib 0.702-0.786 (0.38-0.47c),…
 MARKS (@JavonTM1)