As Bitcoin (BTC) continues to trade within striking distance of its all-time high (ATH), a noticeable shift is underway in the cryptocurrency’s Realized Dominance metric, reflecting changes in behavior between short-term holders (STH) and long-term holders (LTH).
Bitcoin Realized Dominance Shows Shift In Market Sentiment
According to a recent CryptoQuant Quicktake post by contributor Crazzyblockk, the latest trend in BTC’s Realized Dominance metric highlights a significant shift in overall market structure and sentiment.
For the uninitiated, the Bitcoin Realized Dominance metric tracks how much of the realized cap is held by STH vs LTH. A rising LTH cohort share signals strong conviction and maturing supply, while a falling STH share suggests reduced speculation or loss-taking.
The latest on-chain data shows that STH Realized Cap has dropped to around 45%, signalling reduced activity from recent buyers. This implies that new BTC entering the market is either being sold at a loss or maturing into long-term holdings – easing short-term speculative pressure.

Conversely, the LTH Realized Cap has risen, suggesting long-held coins are being moved at a profit – typically seen during late-stage bull markets. This increase also indicates aging supply, as coins held by short-term investors transition into the LTH category, reflecting strong holder conviction. The analyst added:
The divergence between falling STH Realized Cap and rising LTH Realized Cap highlights a supply transfer dynamic: recent entrants struggle with profitability amid lackluster price action, while long-term participants maintain control of an increasing share of network value.
Such transitions often precede bullish reversals. As short-term realized cap shrinks, selling pressure typically declines, paving the way for more sustainable upside, provided fresh demand returns.
In conclusion, Crazzyblockk noted that the Bitcoin market is currently in a consolidation phase, with weaker hands exiting and stronger holders gaining dominance. If this trend continues, it could establish a more resilient price base for BTC and potentially pave the way for a new ATH.
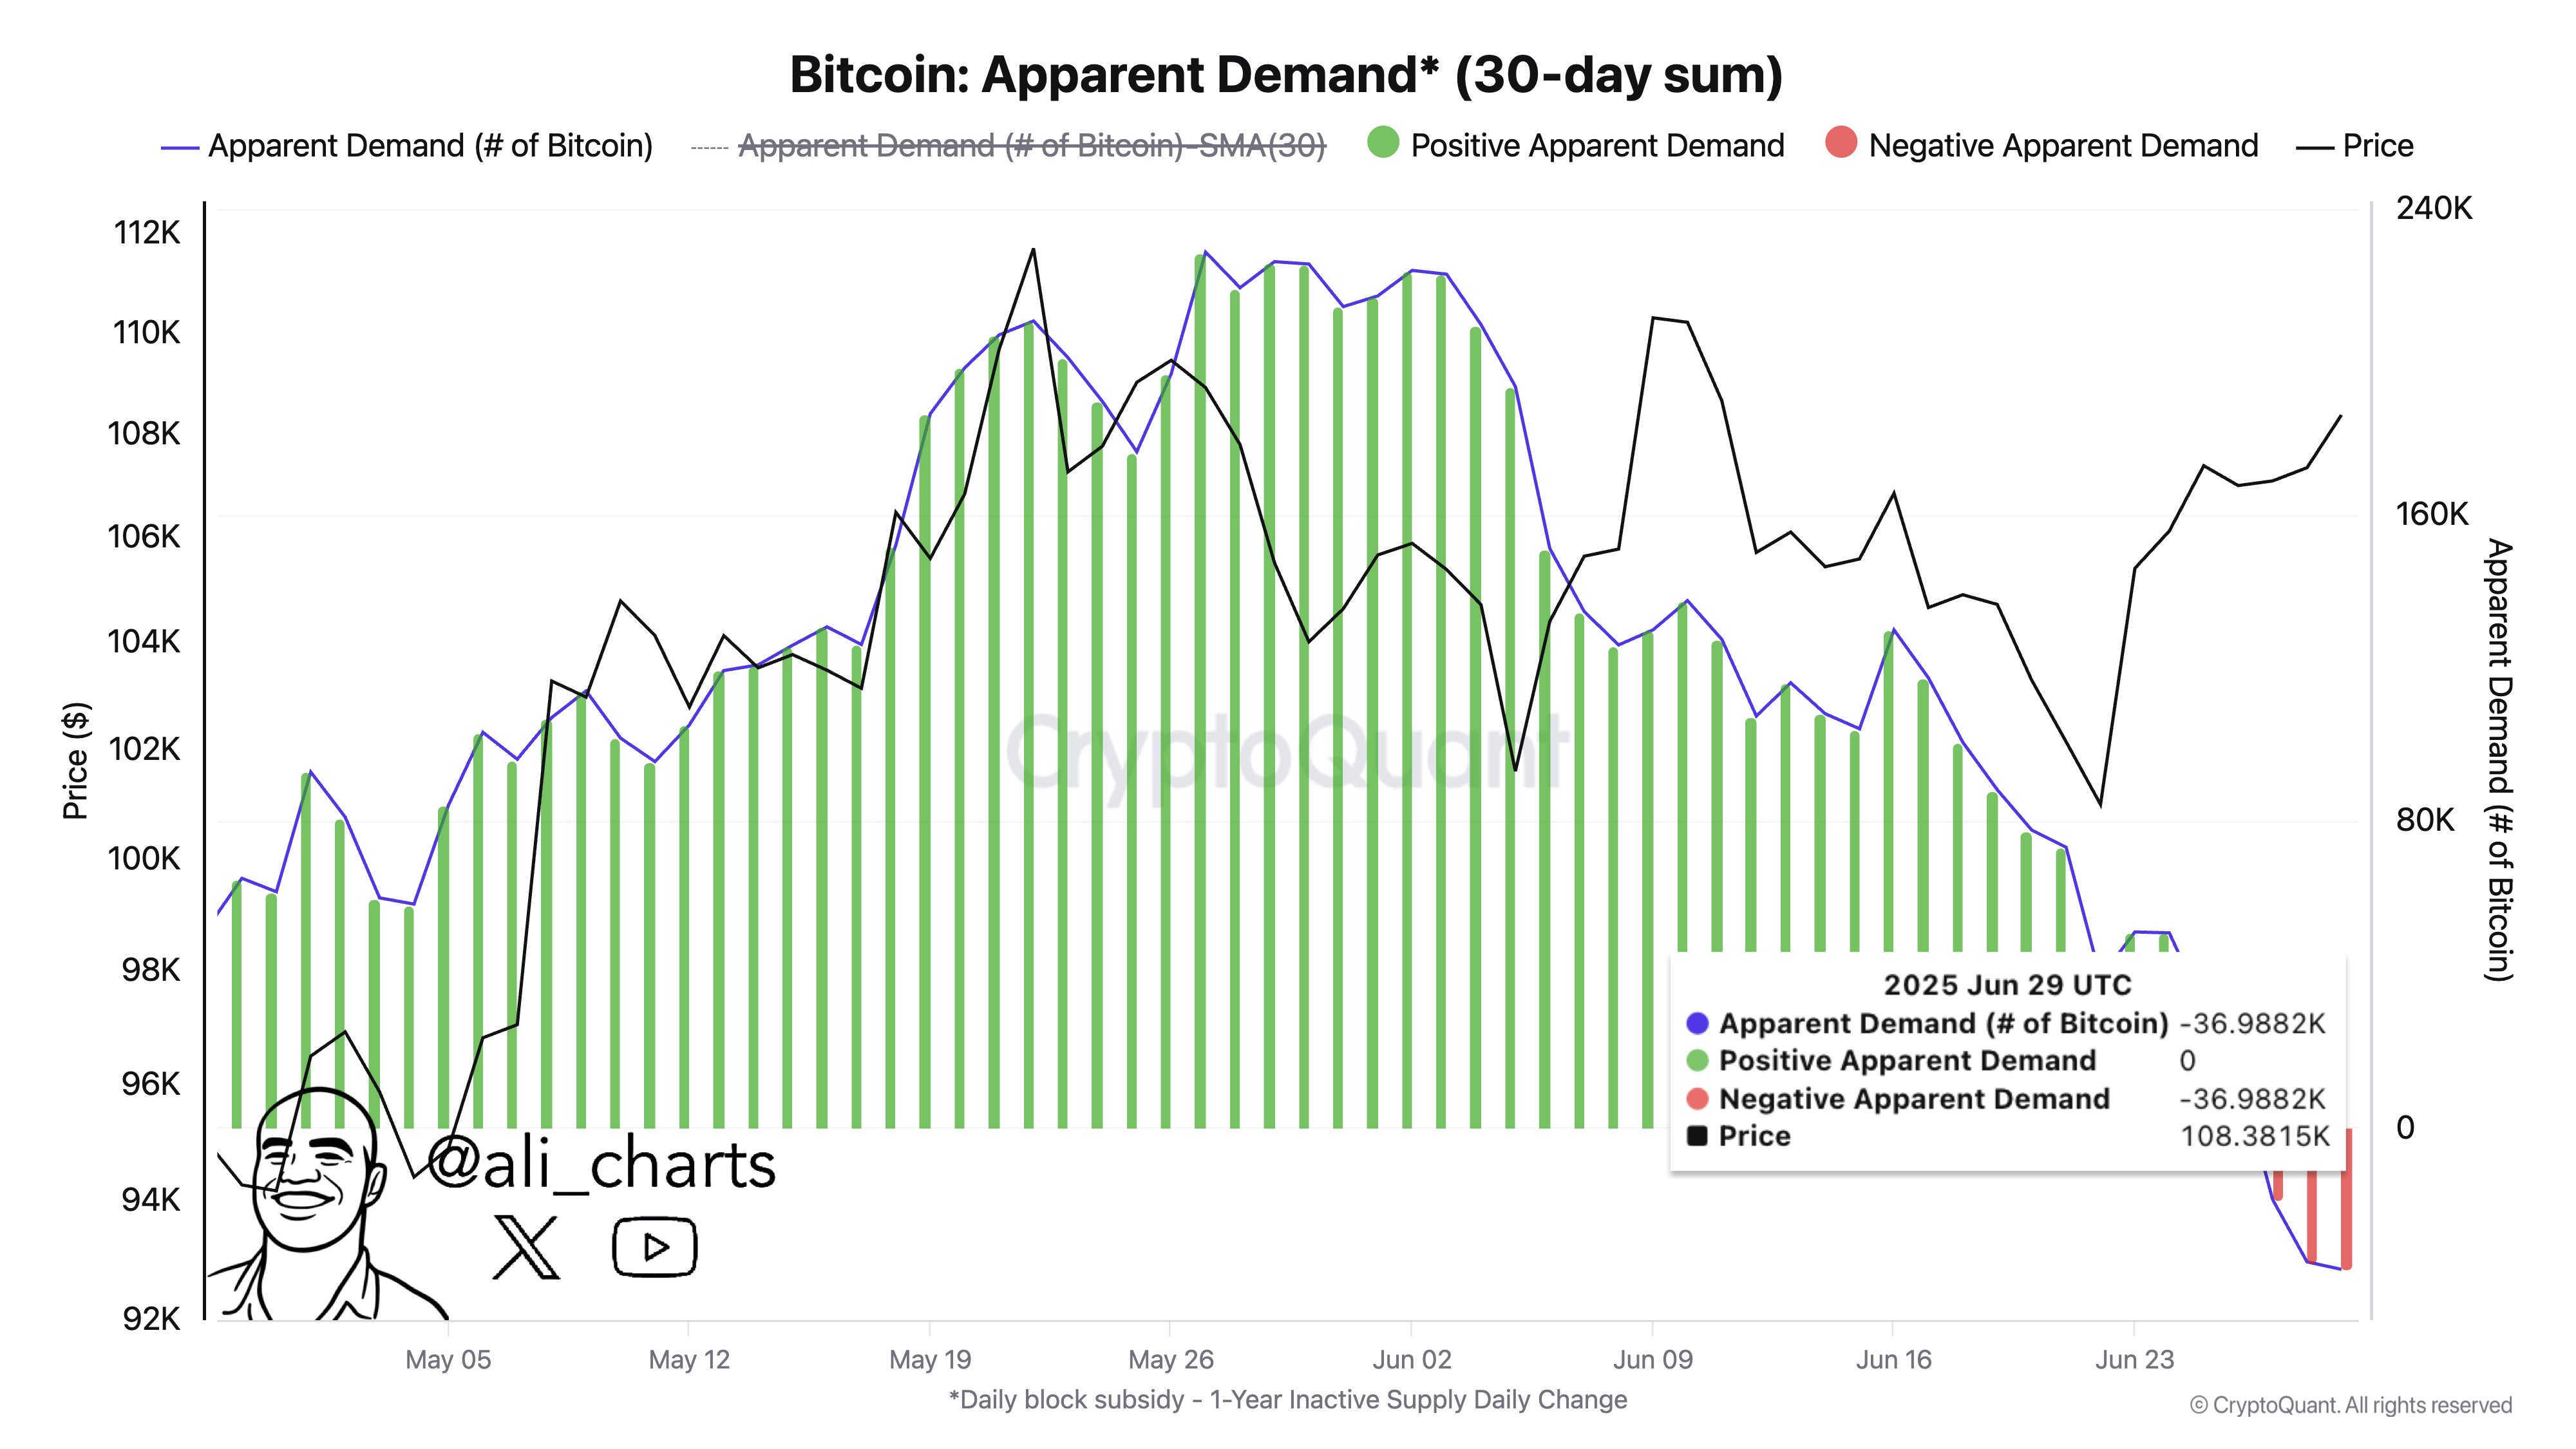
BTC Apparent Demand Has Declined
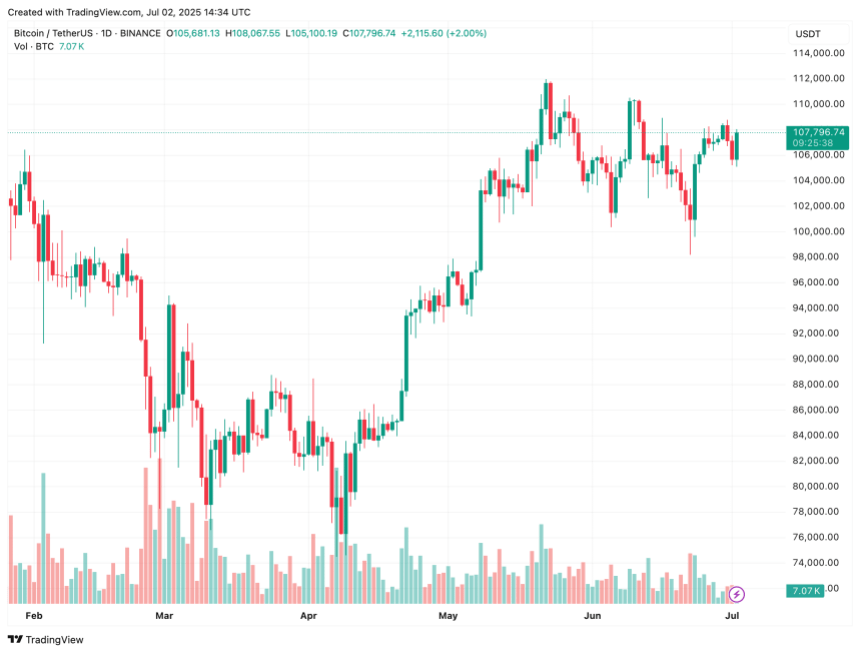
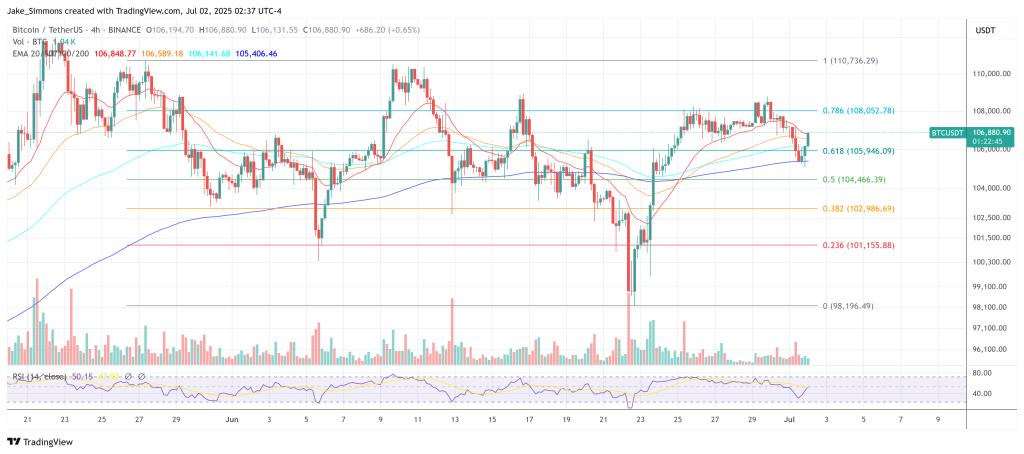
Despite the rise in LTH Realized Dominance, some on-chain signals point to weakening demand. This has raised concerns of a potential short-term drawdown, which could be as severe as the April 2025 pullback to almost $75,000.
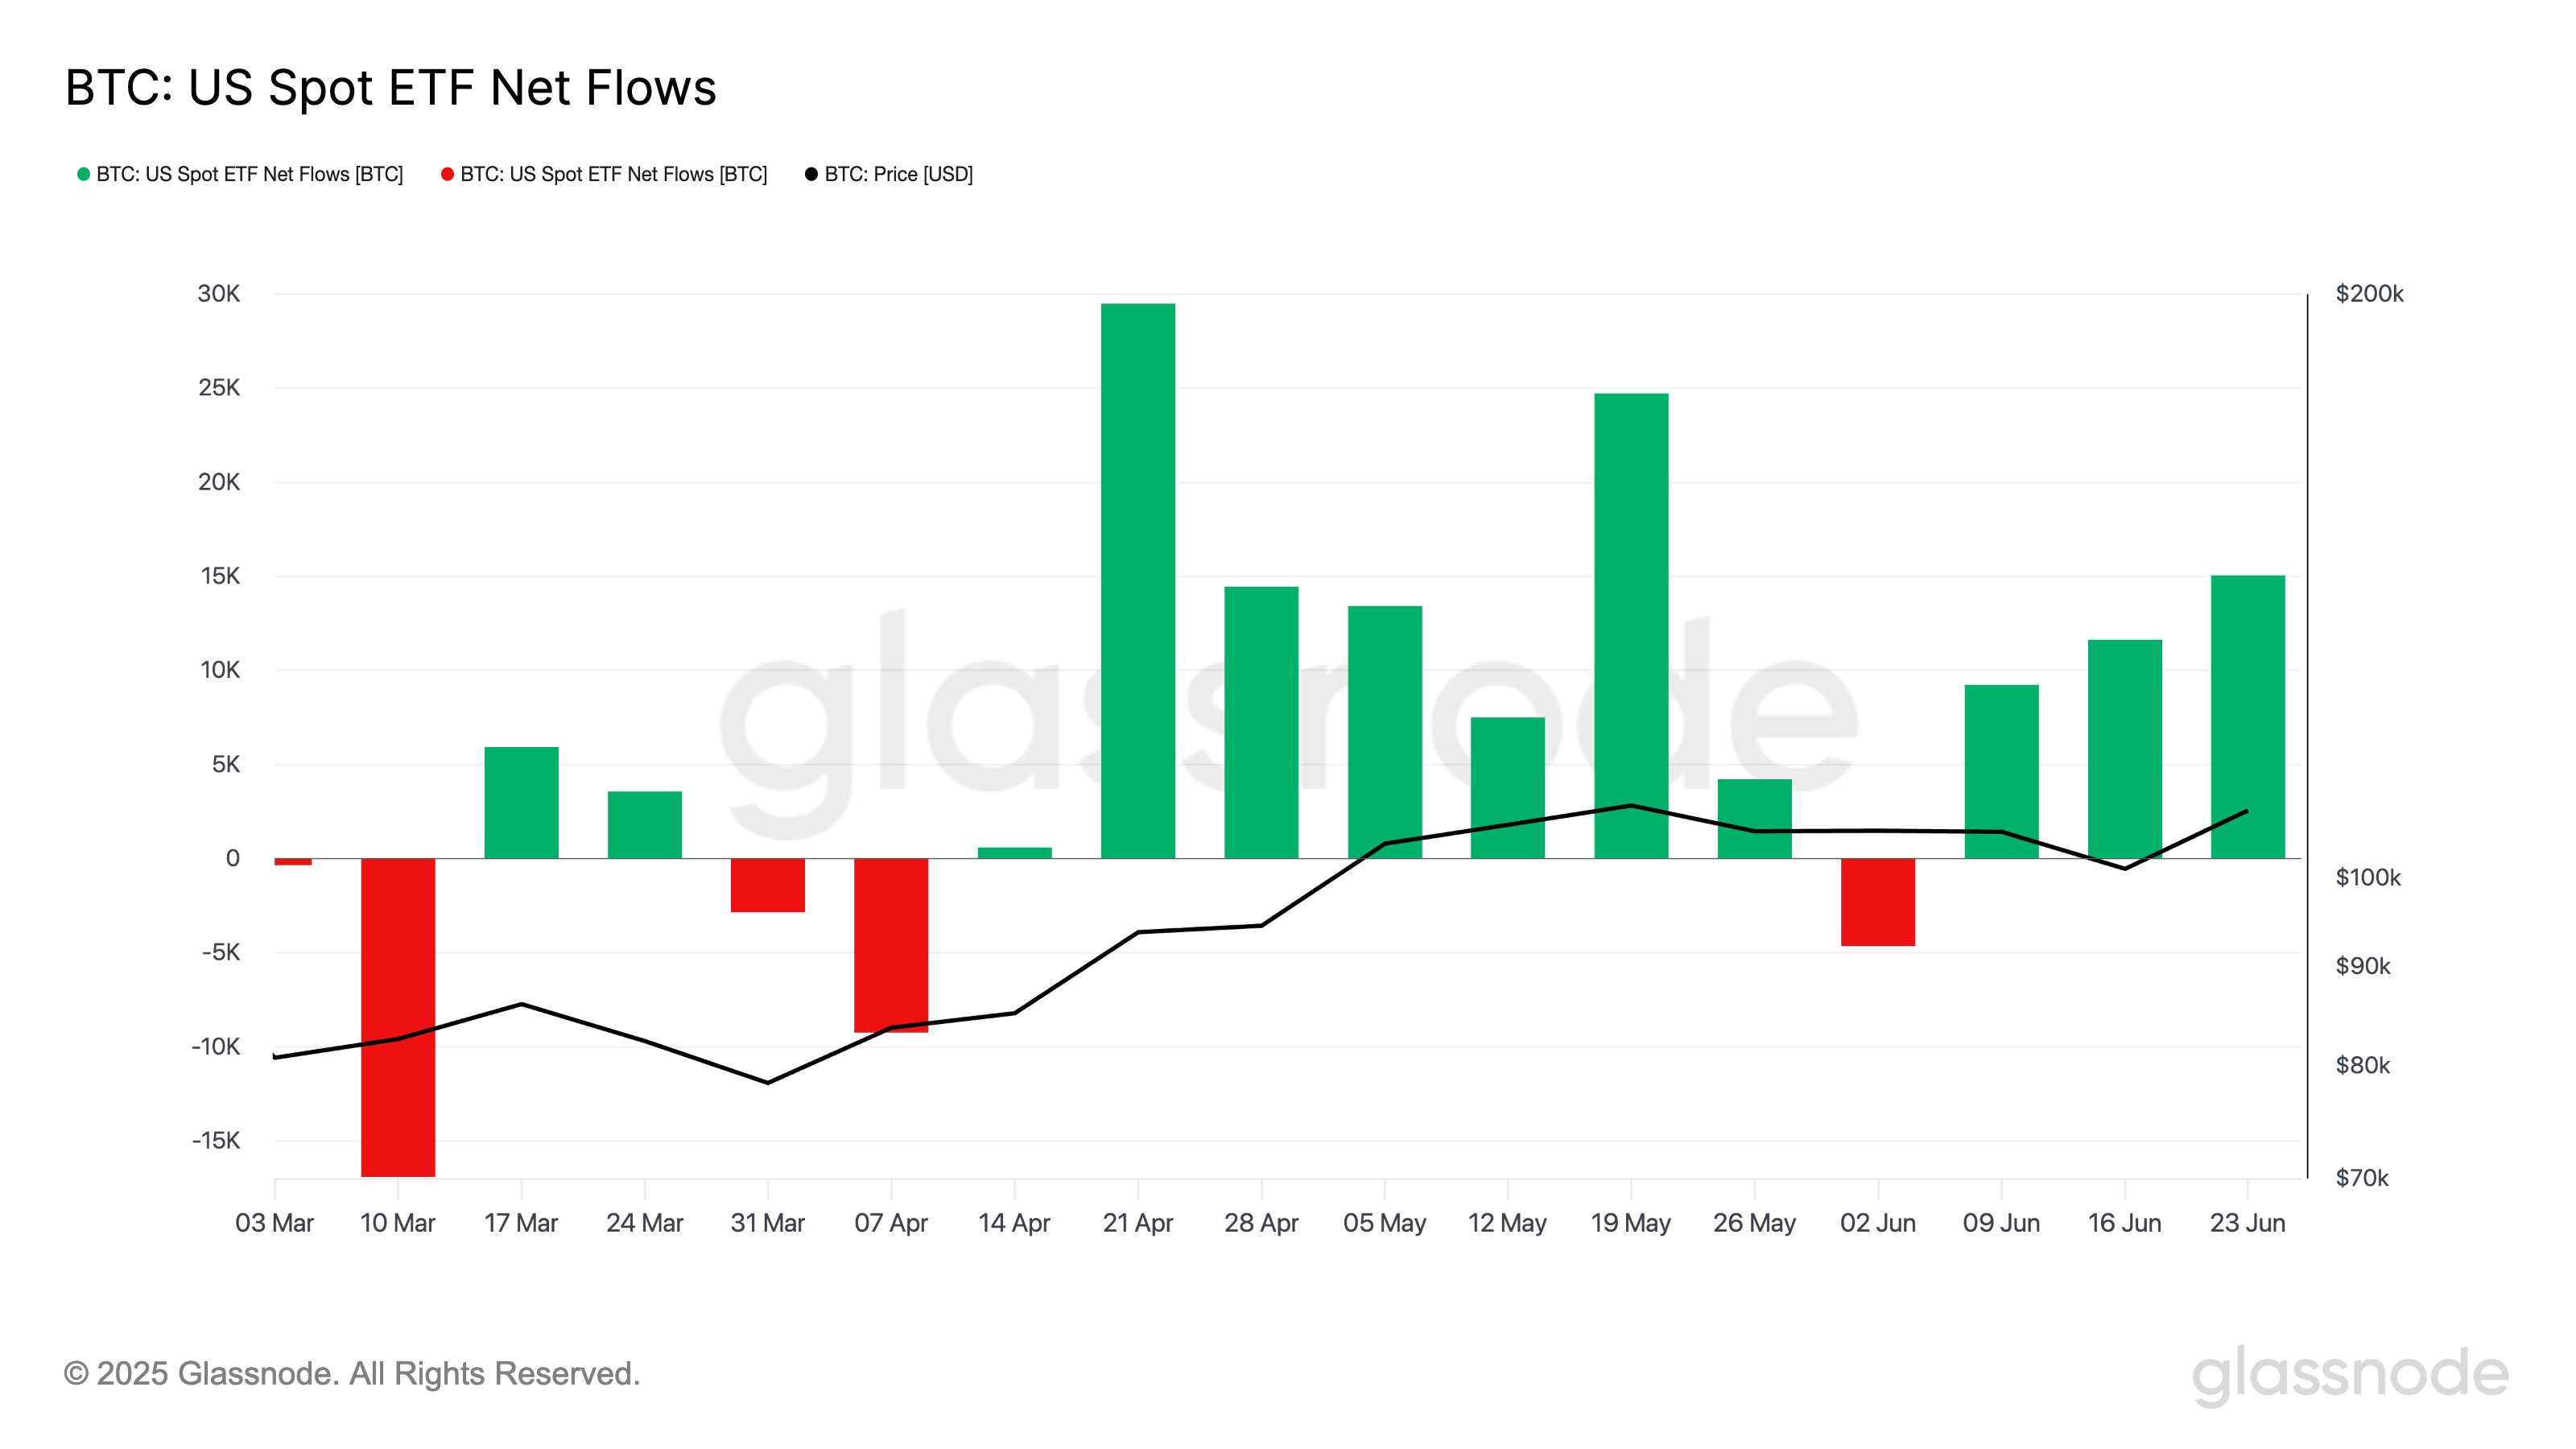
Notably, Bitcoin’s Apparent Demand – a metric that assesses whether new buyer demand is sufficient to offset selling from miners and LTHs – has dropped to -37,000 BTC. This sharp decline suggests fading buying interest.
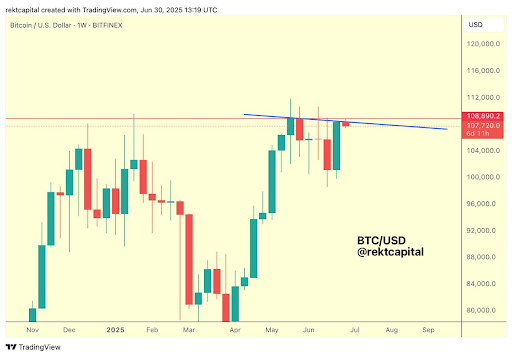
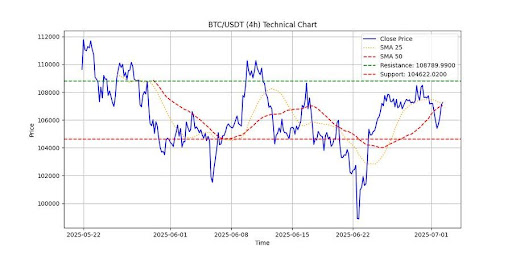
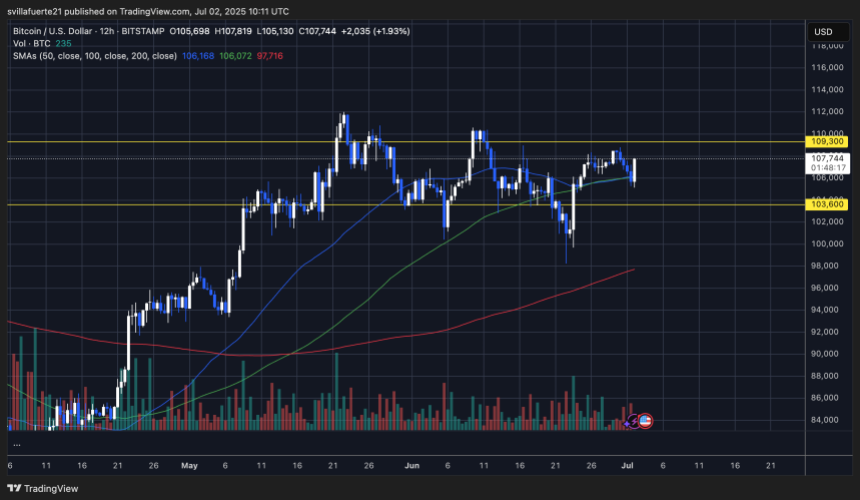
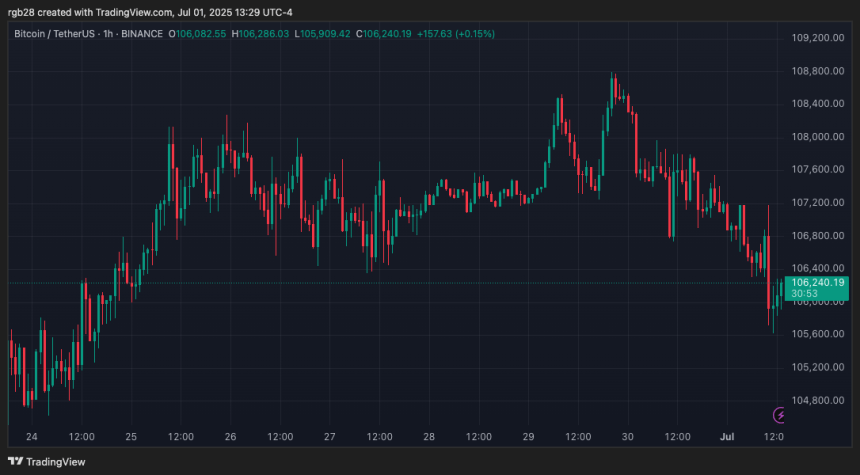
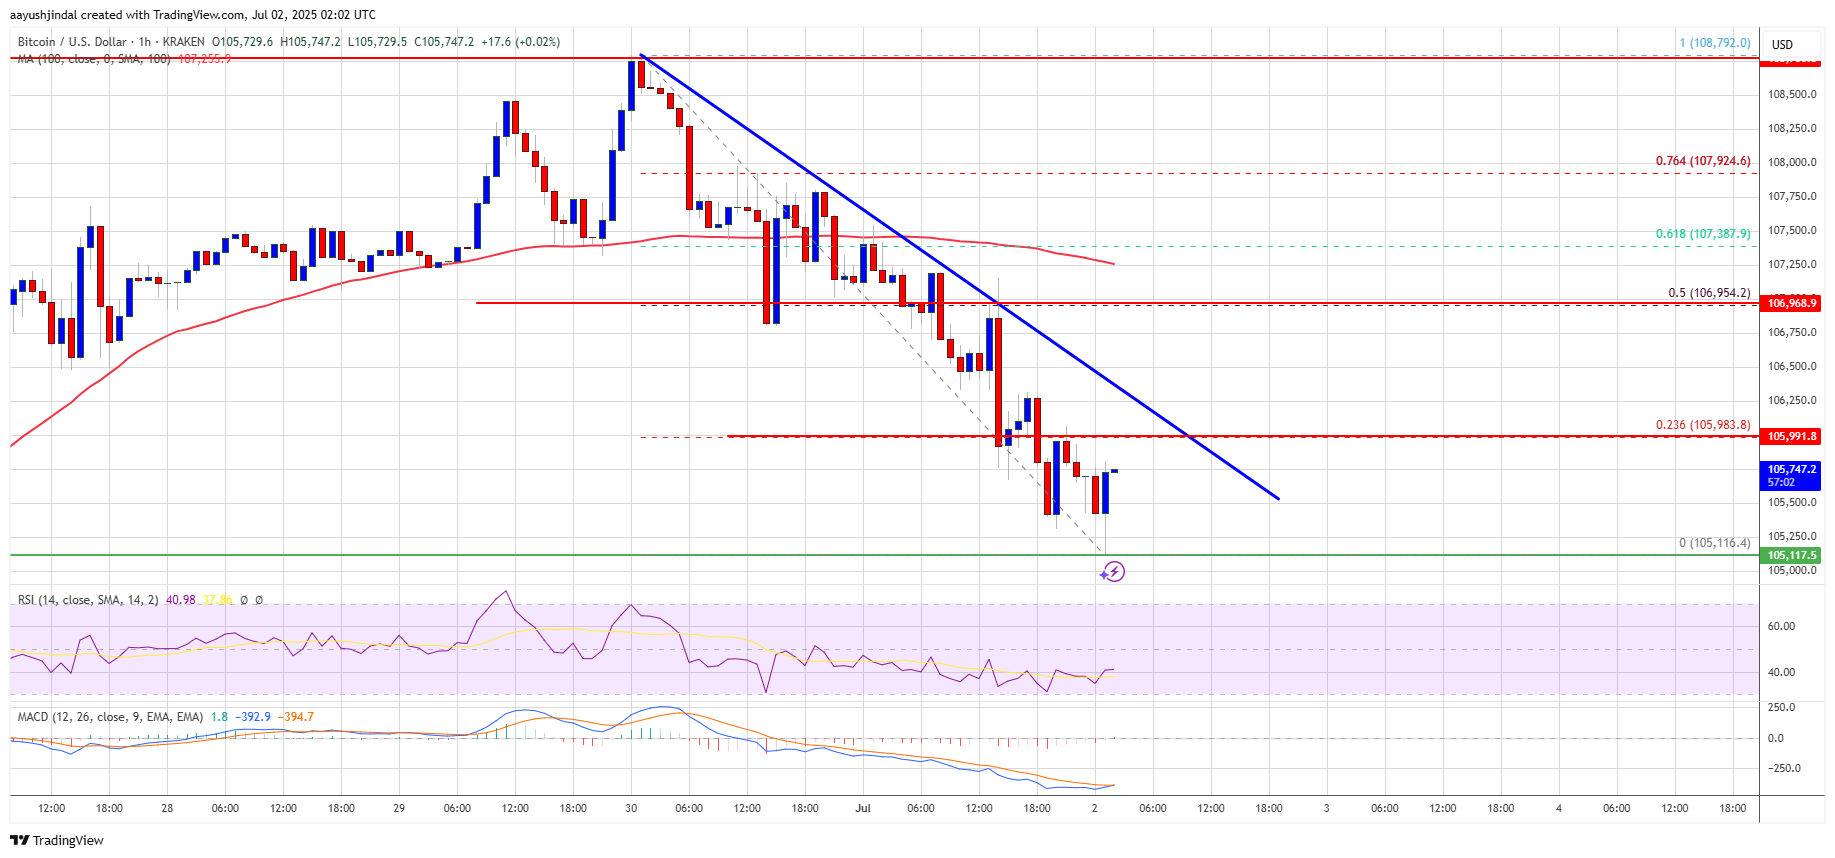
That said, one positive indicator remains. The STH floor price has been steadily rising over the past few months and is now nearing the psychologically important $100,000 level. At press time, BTC trades at $107,796, up 1.2% in the past 24 hours.
 Unrealized profits of LTH continue to decline and are now approaching levels last seen during the October 2024 correction.
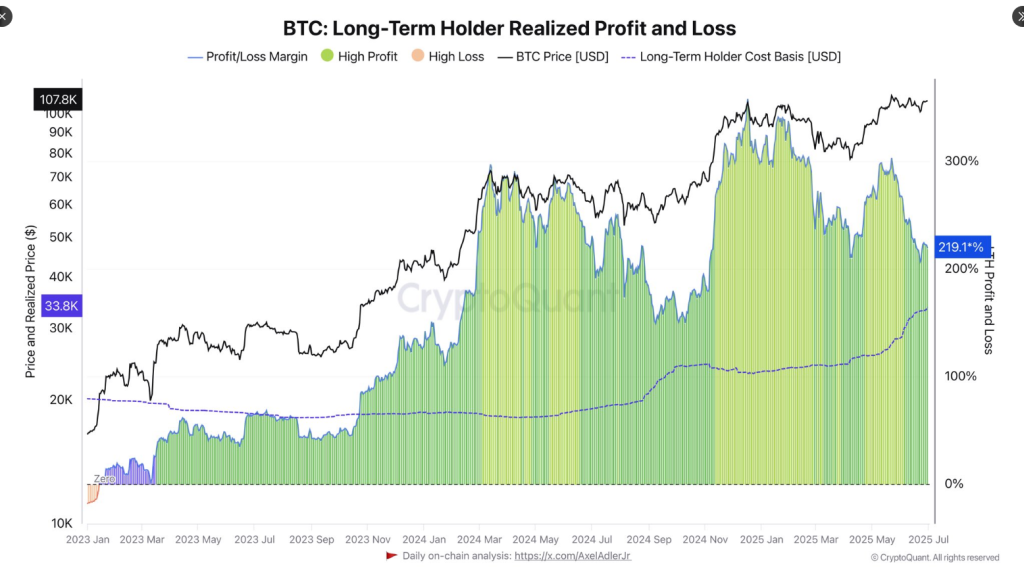


 𝗝𝘂𝗻𝗲’𝘀 𝗕𝗶𝘁𝗰𝗼𝗶𝗻…
  (@Andre_Dragosch)
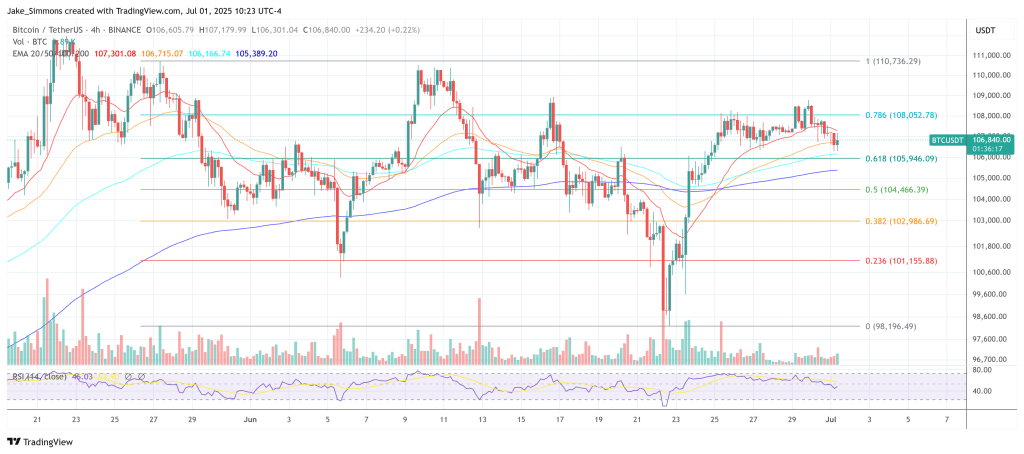
")
 The Blockchain Group has acquired 60 BTC for ~€5.5 million at ~€91,879 per bitcoin and has achieved BTC Yield of 1,270.7% YTD, 69.3% QTD. As of 6/30/2025,