Newbie Bitcoin Whales Hold 2x As Much As Veterans: What’s Behind This Trend?

On-chain data shows the new whale entrants in the Bitcoin market now hold almost twice as much as the veterans. Here’s what could be behind this shift.

Bitcoin Newbie Whale Holdings Have Been Rapidly Growing Recently

In a new post on X, CryptoQuant founder and CEO Ki Young Ju has discussed about how the holdings of the new whales compares against the old ones in the market right now.

The on-chain indicator of interest here is the “Realized Cap,” which, in short, keeps track of the total amount of capital that the investors have used to purchase their Bitcoin.

This capitalization model is in contrast to the usual market cap, which simply measures the total value that the holders as a whole are carrying based on the current spot price.

In the context of the current topic, the Realized Cap of the entire market isn’t of interest, but rather specifically that of two segments: the short-term holder whales and long-term holder whales.

Whales are defined as entities on the network who are holding at least 1,000 BTC in their balance. At the current exchange rate, this amount is worth $66.6 million, so the whales are clearly quite massive holders. Because of these large holdings, these investors can hold some influence in the market.

Based on holding time, the whales can be subdivided into two categories. The short-term holder (STH) whales are those who acquired their coins within the past 155 days, while the long-term holder (LTH) whales have been holding since longer than this timespan.

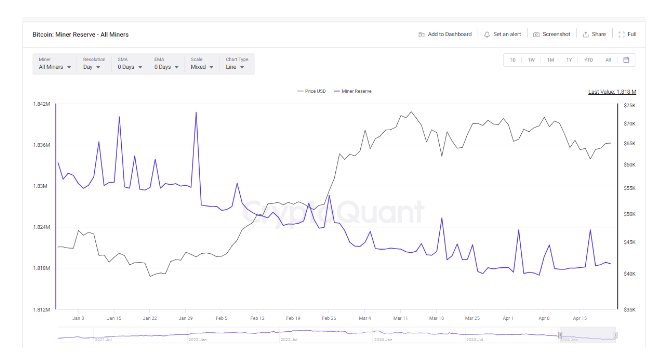
Now, here is the chart shared by Ju that reveals the Realized Cap breakdown between these two Bitcoin whale cohorts:

Bitcoin Realized Cap

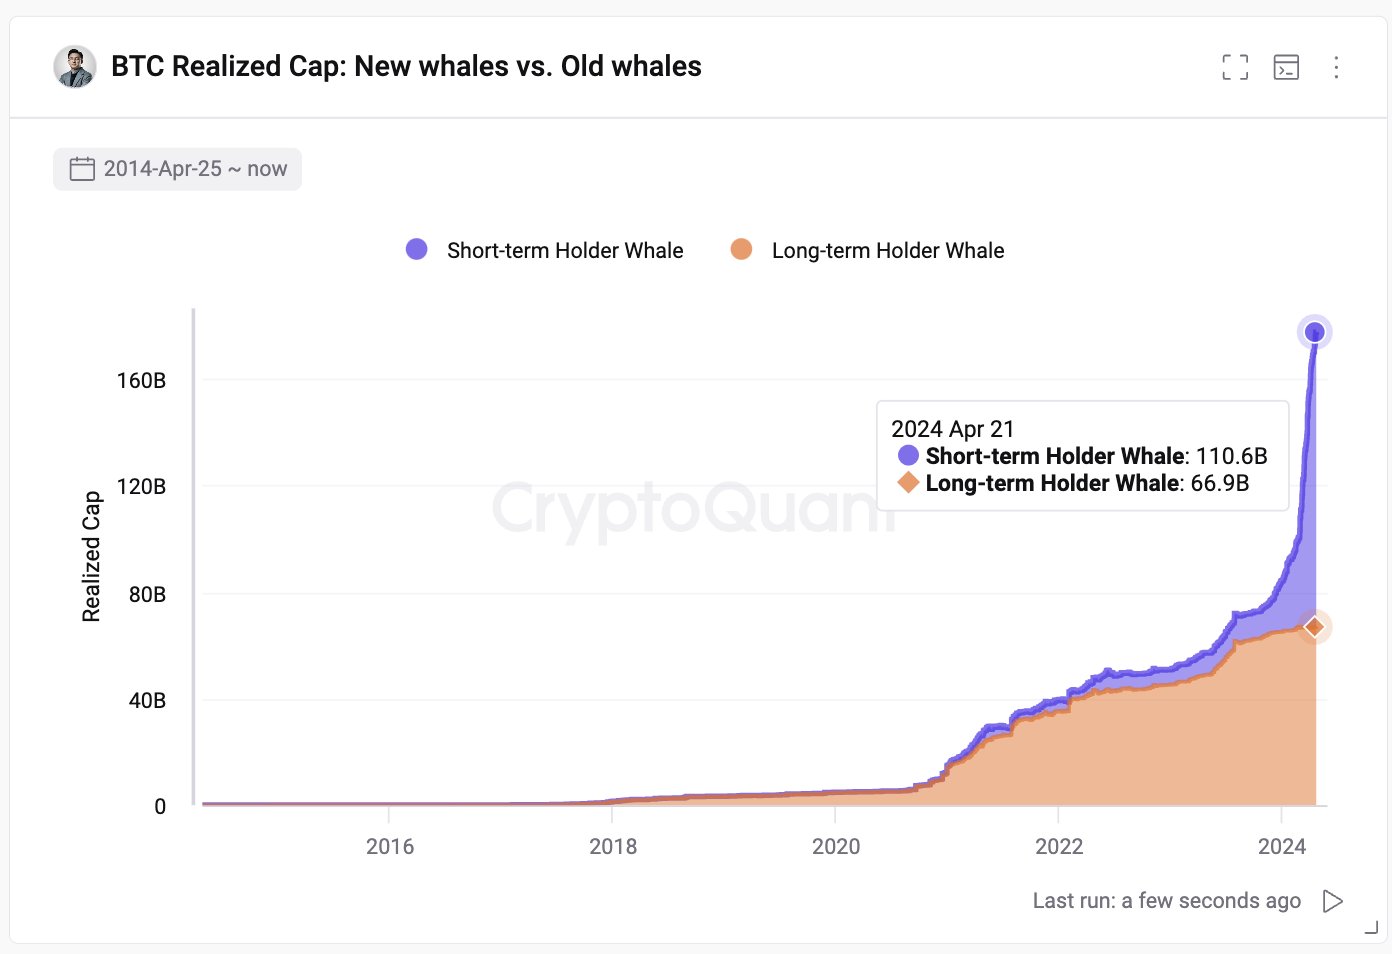
As is visible in the above graph, the Realized Cap of the STH whales has historically not been too different from that of the LTH whales, but that appears to have changed recently.

The metric has pulled away for these new whales this year with some very sharp growth, as its value has now reached the $110.6 billion mark. This means that the STH whales have collectively bought their coins at an initial investment of a whopping $110.6 billion.

The Realized Cap of the LTH whales, on the other hand, has continued its usual trajectory, floating around $66.9 billion currently. This means that there is now a massive gap between the indicator for these two cohorts.

But what’s the reason behind the sudden emergence of this brand-new trend? As mentioned before, the STH cutoff stands at 155 days, which means that the Realized Cap of the STH whales would signify the total value of the purchases made by the whales over the last five months.

In the past five months, there has been one event in particular that has stood out, which has also never been present in any of the prior cycles: the approval of the spot exchange-traded funds (ETFs).

The spot ETFs provide an alternative mode of investment into the asset through a means that’s familiar to traditional investors. These funds have been bringing in some unprecedented demand into BTC and as their holdings also fall under the 155 days mark, they would count as STH whales.

Bitcoin has also been rallying this year, so all this new investment would have had to purchase at relatively high prices, thus causing the Realized Cap, which correlates to direct capital flows, to inflate even further.
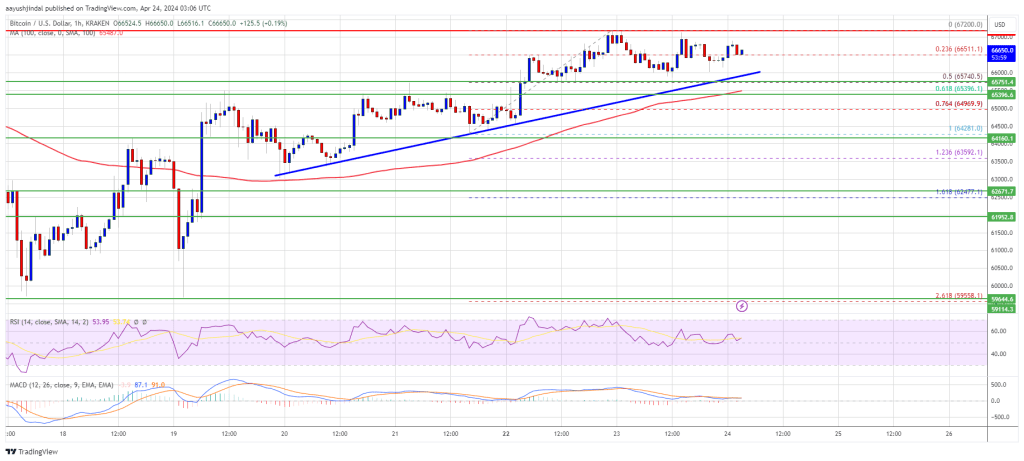
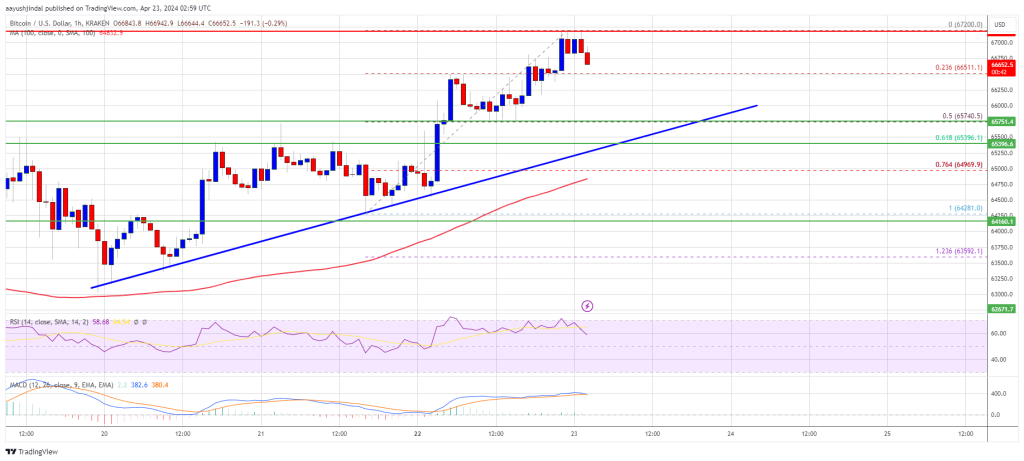
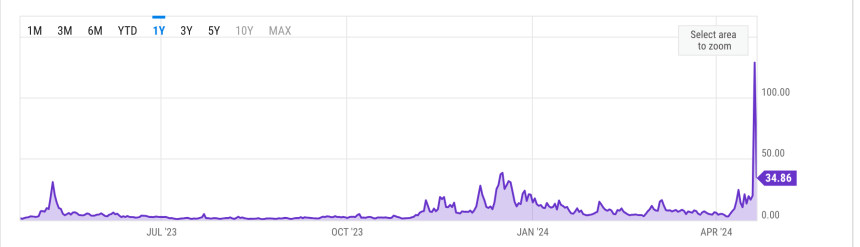
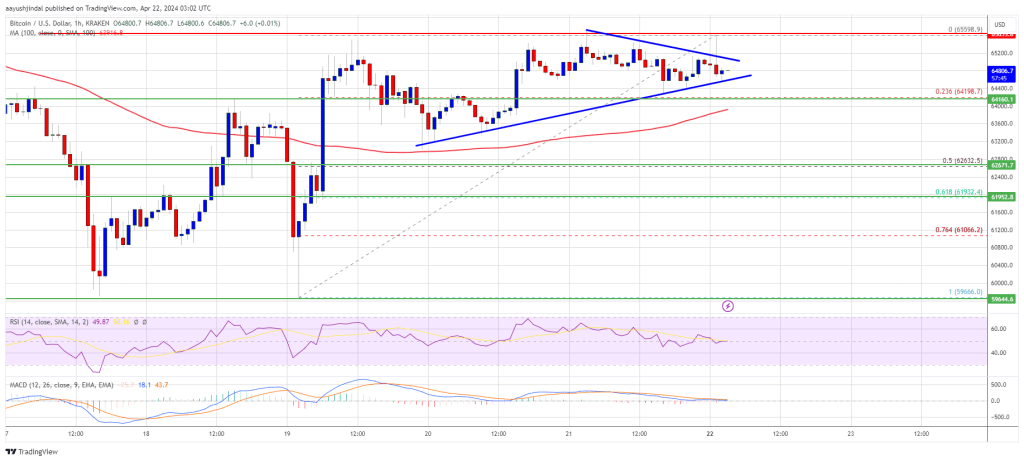
BTC Price

Bitcoin is now trading at $66,400 after witnessing a surge of more than 6% over the past week.

Bitcoin Price Chart

Analysts Identify Key Scenario For Bitcoin Hitting $100,000

Prior to the Bitcoin Halving event, BTC’s price saw considerable instability, but it has since rebounded, reaching the $66,000 level, triggering bullish predictions from top crypto analysts regarding the coin’s future path.

Captain Faibik, a crytocurrency analyst and trader, has emerged with an intriguing prediction, underscoring a narrative that could potentially propel the price of Bitcoin to the coveted $100,000 mark in the upcoming months.

Bitcoin Poised For A Notable Rally To $100,000 

According to Captain Faibik, Bitcoin has managed to hold the $60,000 support level in the wake of bullish investors in the market. As a result, the largest crypto asset by market cap is currently making a strong comeback.

These bullish investors, according to Faibik must reclaim the crucial $72,000 resistance level in order to see a major rally to the $100,000 price level. This scenario acts as a ray of hope for the cryptocurrency community, igniting speculations and influencing projections about Bitcoin’s potential for future growth. Given the anticipated impact of the Bitcoin Halving and bulls, the $72,000 level could be realized in the short term.

Bitcoin

The expert previously highlighted that the Bitcoin weekly candle closed above the Exponential Moving Average (EMA) 10, demonstrating that the bulls are still very much in charge of the market. Following the Descending Channel break out in October last year, BTC Bulls has firmly secured the weekly EMA10, prompting the crypto analyst to put his next price target for the digital asset at $100,000.

Faibik also noted that the daily Relative Strength Index (RSI) for Bitcoin has emerged from a falling wedge pattern. This breakout suggests that a 15% to 20% bullish rally in Bitcoin’s value is on the horizon.

Meanwhile, in the daily timeframe, a bullish flag formation is underway, and in the event of an upward breakout from the bullish flag, Faibik anticipates a new all-time high for Bitcoin by May.

Is A $1.5 million Price Level Possible For BTC?

One of the most bullish predictions for Bitcoin this year came from Ark Invest Chief Executive Officer (CEO) Cathie Wood. The CEO foresees the digital asset to rise by over 2,000% reaching a whopping $1.5 million by 2030.

During an interview in Hong Kong, Wood reiterated her projections for BTC, which were supported by a thorough investigation that included institution surveys and evaluations of market volatility.

She stated:

I have been asked this question from different angles, and our analysis from multiple perspectives indicates that by 2030, Bitcoin could rise to $1.5 million. This price prediction is based on a survey of institutions, using a discount rate and volatility analysis.

Initially, Wood’s forecast for Bitcoin was estimated at $600,000 in the next six years. However, considering the effect of the Bitcoin Spot Exchange-Traded Funds (ETFs), she now believes the coin has the potential to hit $1.5 million.

Bitcoin

Bitcoin Price Eyes Next Breakout As The Bulls Aim For $70K

Bitcoin price climbed above the $66,000 resistance zone and started consolidation. BTC is now eyeing the next move above the $67,200 resistance zone.

  • Bitcoin is eyeing a decent increase above the $67,200 resistance zone.
  • The price is trading above $65,500 and the 100 hourly Simple moving average.
  • There is a connecting bullish trend line forming with support at $65,900 on the hourly chart of the BTC/USD pair (data feed from Kraken).
  • The pair could gain bullish momentum if it clears the $67,200 resistance zone.

Bitcoin Price Eyes More Upsides

Bitcoin price started a fresh increase above the $65,500 and $66,000 resistance levels. BTC even climbed above the $67,000 level. It traded as high as $67,200 and is currently consolidating gains.

There was a minor decline below the $66,500 level, but the price remained stable above the 23.6% Fib retracement level of the upward move from the $64,280 swing low to the $67,200 low. Bitcoin price is still trading above $65,500 and the 100 hourly Simple moving average.

There is also a connecting bullish trend line forming with support at $65,900 on the hourly chart of the BTC/USD pair. The trend line is near the 50% Fib retracement level of the upward move from the $64,280 swing low to the $67,200 low.

Immediate resistance is near the $67,000 level. The first major resistance could be $67,200. A clear move above the $67,200 resistance might send the price higher. The next resistance now sits at $68,500. If there is a clear move above the $68,500 resistance zone, the price could continue to move up. In the stated case, the price could rise toward $70,000.

Bitcoin Price

Source: BTCUSD on TradingView.com

The next major resistance is near the $70,500 zone. Any more gains might send Bitcoin toward the $72,000 resistance zone in the near term.

Are Dips Limited In BTC?

If Bitcoin fails to rise above the $67,000 resistance zone, it could start a downside correction. Immediate support on the downside is near the $66,200 level.

The first major support is $66,000 or the trend line. If there is a close below $66,000, the price could start to drop toward $65,400. Any more losses might send the price toward the $64,200 support zone in the near term.

Technical indicators:

Hourly MACD – The MACD is now losing pace in the bullish zone.

Hourly RSI (Relative Strength Index) – The RSI for BTC/USD is now above the 50 level.

Major Support Levels – $66,200, followed by $66,000.

Major Resistance Levels – $67,000, $67,200, and $68,500.

Is A $72K Bitcoin Surge On The Horizon? Glassnode’s Latest Analysis Points To An Answer

Recent insights from Glassnode’s cofounders, shared under their X (formerly Twitter) account ‘Negentrophic’ have sparked interest in Bitcoin market dynamics, leading to a promising stabilization and possible price surge.

Market Sentiments And EMA Trends

With Bitcoin’s value recently wavering below the $70,000 mark, a detailed analysis from the cofounders suggests that a strong support level around the $62,000 50-day Exponential Moving Average (EMA) could set the stage for a significant rebound.

This crucial support level indicates a strong buying sentiment, indicating the market’s confidence in the cryptocurrency’s value and a potential resistance against further declines.

Using the strategic placement of the 50-day EMA as a support point, the analysis suggests that investors might see the current price levels as a solid base, preventing significant downward movements.

This perspective is reinforced by recent price movements, where despite a pre-halving general dip, Bitcoin has experienced a 7.1% increase in value over the past week, and the same uptick continued in the last 24 hours.

Bitcoin (BTC) price chart on TradingView

Further analysis by the Glassnode cofounders delves into the behavior of EMAs over different durations. Short-term EMAs indicate a growing inclination among investors to buy, while longer-term EMAs lean towards selling.

This contrasting behavior between short and long-term EMAs sheds light on the current phase of the market, which seems to be in a period of consolidation after the notable 92% increase in Bitcoin’s price over six weeks earlier in the year.

Such insights are vital as they offer a deeper understanding of the underlying market forces and investor behavior during volatile periods.

Meanwhile, Glassnode’s team’s analytical approach extends beyond simple price movements. Yesterday, they compared the current market conditions to the early 2021 “strong correction,” which they term “wave 4” of the ongoing market cycle.

This historical perspective provides a lens through which current trends can be evaluated, suggesting a cyclic return to bullish conditions reminiscent of past market behaviors.

Bitcoin Bullish Projections And Market Dynamics

Bitfinex analysts have highlighted significant activities around Bitcoin withdrawals, supporting the optimistic outlook on Bitcoin. The current levels, echo those of January 2023, suggest that investors are increasingly moving their Bitcoin to cold storage—a sign that many anticipate further price increases.

Veering back to Glassnode’s projections yesterday based on their indexes and Fibonacci levels, the cofounders were boldly optimistic, anticipating a potential 350% increase from current market levels.

Notably, this forecast highlights the expected financial trajectory and underscores a growing confidence among experts and market analysts in Bitcoin’s market performance and its foundational economic principles.

Featured image from Unsplash, Chart from TradingView

Samson Mow On Bitcoin Halving: Brace For Supply Shock, Omega Candle In Sight

Samson Mow, the chief executive at Jan3, recently spoke to Forbes about the latest Bitcoin halving and its potential to catalyze what he refers to as the “Omega candles” – significant price movements that could elevate Bitcoin to the $1 million mark.

According to Mow, halvings ensure a controlled distribution of Bitcoin, maintaining scarcity and value.

The Mechanics Of Halving And Its Market Implications

Samson Mow detailed in the interview with Forbes the mechanics behind Bitcoin halvings—a critical process built into Bitcoin’s framework by its creator, Satoshi Nakamoto.

This mechanism is designed to halve the block rewards given to miners every 210,000 blocks, or approximately every four years, reducing the reward by 50%.

So far, the most recent halving has reduced the reward for mining from 6.25 BTC to 3.125 BTC per mined block. However, initially, miners received 50 BTC per block.

Still, due to the halvings, this amount has decreased over time to manage inflation and extend the mining lifecycle of Bitcoin’s capped supply of 21 million coins. If not for these halvings, the total supply of Bitcoin would have already been mined.

In the same discussion, Mow highlighted the significant impact of newly approved spot-based Bitcoin ETFs, which received SEC approval earlier this year. He believes these ETFs, combined with the reduced block rewards from the halving, could precipitate a “supply shock” in the BTC market.

Mow further speculated on the occurrence of what he calls “Omega candles”—large price movement events in the Bitcoin market.

He noted that even before the recent halving, the daily demand for Bitcoin was significantly outstripping supply, predicting these Omega candles as almost certain events due to their high volatility and substantial price changes.

Mow views these developments as marking the beginning of a new era for Bitcoin, coinciding with its next, or fifth, halving in the coming four years.

Bitcoin Bright Future And Market Performance

Regarding positive sentiment on Bitcoin, Geoff Kendrick of Standard Chartered also supports this bullish outlook, projecting substantial inflows into BTC akin to those experienced by gold with the advent of gold ETFs.

Kendrick suggests that the maturation of the spot ETF market could channel between $50 and $100 billion into BTC.

However, despite the post-halving price not reaching the anticipated heights, BTC has demonstrated resilience and potential for considerable growth. Meanwhile, analysts remain confident, predicting significant long-term value increases.

For instance, Michael Sullivan’s analysis suggests a possible reach of $245,000 by 2029 if BTC maintains a 30% compound annual growth rate, underlining the optimistic projections shared by several market experts.

This optimism is further supported by recent trends, including a 7.1% increase in Bitcoin’s price over the last week, which indicates a possible recovery on the horizon.

Bitcoin (BTC) price chart on TradingView

Featured image from Unsplash, Chart from TradingView

Is The Bitcoin Top Already Here? This Historical Pattern Says So

A historical pattern currently forming in a Bitcoin on-chain indicator could suggest that a top may be near for the asset, if not already in.

Bitcoin SOPR Ratio Is Forming A Historical Top Pattern Right Now

In a CryptoQuant Quicktake post, an analyst has discussed about a pattern regarding the SOPR Ratio. The “Spent Output Profit Ratio” (SOPR) is an indicator that tells us whether the Bitcoin investors are selling their coins at a profit or loss right now.

When the value of this metric is greater than 1, it means that profit-selling is dominant in the market currently. On the other hand, the metric being under the threshold suggests the average holder is moving coins at some net loss.

In the context of the current topic, the SOPR itself isn’t of interest; rather, it is a different version called the SOPR Ratio. The name may be a bit confusing as SOPR already contains a “ratio,” but the latter ratio here corresponds to the fact that this indicator compares the SOPR of two Bitcoin cohorts: the long-term holders (LTHs) and short-term holders (STHs).

These investor groups make up for the two main divisions of the BTC market done based on holding time, with 155 days being the cutoff between the two. The STHs are those who bought within the past 155 days, while the LTHs include the HODLers carrying coins for longer than this timespan.

Now, here is a chart that shows the trend in the 7-day moving average (MA) of the Bitcoin SOPR Ratio over the history of the cryptocurrency:

Bitcoin SOPR Ratio

As displayed in the above graph, the 7-day MA Bitcoin SOPR Ratio had been heading up throughout 2023 and early parts of 2024, but recently, the metric has hit a top and reversed its direction. Whenever the SOPR Ratio is higher than 1, it means the LTHs, who are generally known to be resolute hands, are participating in a higher degree of profit-taking than the STHs.

It would appear that as BTC had observed its rally and approached a new all-time high (ATH), these diamond hands had started harvesting some of the gains they had earned over their long holding time. And once the price set a new ATH, these investors participated in peak profit-taking. Since then, their profit-selling has been dropping off, although they are still harvesting notably higher gains than the STHs.

In the chart, the analyst highlights how this pattern has been repeated at different points in the asset’s history. While the scale of the peak LTH profit-taking has been heading down over the cycles, it’s still true that the metric’s top has coincided with tops in the price during each of them.

As the line drawn by the quant suggests, it’s possible that the latest peak in the metric may have in fact been the top for this cycle. This is only, however, assuming that the pattern of diminishing returns in the indicator holds to the exact degree judged by the line.

It’s possible that the peak will still be higher than the current levels, while at the same time being lower than the previous cycle’s peak, thus still being in-line with the historical Bitcoin pattern.

Whatever the case be, though, the fact that the SOPR ratio has apparently hit a top could still be a bearish signal, if only in the short term.

BTC Price

Bitcoin has been making some steady recovery over the last few days as its price has now surged back above $66,100.

Bitcoin Price Chart

Bitcoin Market Dynamics Still Positive Post-Halving – Bitfinex Analysis

In the midst of the dramatic changes that have occurred in the cryptocurrency space after the Bitcoin halving event, Bitfinex provides a perceptive analysis that reassures investors that the market dynamics of BTC have remained positive in the post-halving period. Bitfinex examines the on-chain data and finds encouraging signs for Bitcoin in spite of the United States economy’s current state of uncertainty in its most recent Alpha report, which was released on April 22.

Bitcoin Market Dynamics Remains Bullish

According to the Hong Kong-based crypto platform, exchange withdrawals of Bitcoin are currently at levels not seen since January 2023. This simply indicates that a lot of investors are putting their assets in cold storage in expectation of price rises.

Also, the exchange noted that long-term investors’ aggressive selling has not yet caused the usual pre-halving price decline, which suggests that new market participants are absorbing the selling pressure quite well, highlighting the tenacity of the present market structure of Bitcoin.

The Bitfinex Alpha report revealed that the average daily net inflow from spot Bitcoin Exchange-Traded Funds (ETFs) is $150 million. Given the ETFs’ inflows far exceeding the $30 and $40 million daily issuance rate of BTC following the halving, this significant supply and demand imbalance could encourage further price appreciation.

Bitfinex further claims the massive purchases of spot Bitcoin ETFs, which have dominated the entire year’s market narrative, may decline. However, recent ETF outflows have shown that ETF demand may be starting to stabilize.

It is important to note that the recently concluded Halving cut down miners’ reward from 6.25 BTC to 3.125 BTC. As a result, miners are now modifying their operating tactics in order to sustain their activities against the decline in reward following the Halving.

Thus, the amount of Bitcoin that miners are sending to exchanges has significantly decreased, which may indicate that they are selling ahead of time or collateralizing their holdings to upgrade infrastructure. Consequently, this could possibly lead to a gradual increase in selling pressure rather than a sudden drop in value at the Halving.

New BTC Whales Surpassed Old Whales

Since the conclusion of the fourth Halving, on-chain data shows a significant rise in new Bitcoin whales. CryptoQuant Chief Executive Officer (CEO) Ki Young Ju, reported the development, noting that the initial investment made by the new whales in Bitcoin is nearly twice that of the old whales combined.

According to the data, the total holding by these new whales, which are short-term holders, is valued at $110.6 billion. Meanwhile, the old whales, which are long-term holders, own a whopping $67 billion worth of BTC. This change in whale demographics may impact Bitcoin’s future course and the dynamics of the cryptocurrency landscape as a whole.

Bitcoin

Standard Chartered Reaffirms $150,000 Bitcoin Price Target By Year-End

Geoff Kendrick, head of digital assets research at Standard Chartered, recently reiterated the bank’s ambitious Bitcoin price target of $150,000 by the end of this year, despite current market volatility and geopolitical tensions. In a comprehensive interview with BNN Bloomberg, Kendrick highlighted the significant role of ETF inflows and upcoming halving events in driving Bitcoin’s price.

Why Bitcoin Is Set For A Rally To $150,000 By Year-End

One of the principal drivers identified by Kendrick is the remarkable influx of capital into Bitcoin ETFs within the United States. Since the inception of these ETFs in early 2024, they have witnessed approximately $12 billion in net inflows. Kendrick highlighted the significance of these developments, stating, “The ETF inflows in the US have dominated really the demand supply metrics in 2024 so far. This is huge in terms of how the ETFs have gone so far.”

He drew parallels between the current trends in Bitcoin and the historical performance of gold following the introduction of gold ETFs. Kendrick elaborated on the potential scale of this trend by projecting, “From the start of this year to when the ETF market in the US is mature, we’ll get between $50 and $100 billion of inflow.”

In addition to the ETF inflows, the Bitcoin halving event was identified as another pivotal factor. This event, which reduces the reward for mining new blocks thereby halving the rate of new Bitcoin entering circulation, is set to reduce the daily production from 900 BTC to 450 BTC.

Although Kendrick mentioned that this halving might be “less important than previous ones,” he still considers it significant in the short-term supply dynamics. He stated, “Obviously, once we have the halving […], you have only half as many new coins, so that helps at the margin.”

Responding to questions about market skepticism, particularly criticism from figures such as JPMorgan CEO Jamie Dimon, who described Bitcoin as a “Ponzi scheme,” Kendrick offered a defense of Bitcoin’s underlying technology. He argued, “There’s a lot of people out there that don’t understand the basic methodology behind Bitcoin. And it’s really that blockchain technology, which is where the value is medium term.”

Looking Further Ahead

Kendrick continued, explaining the transformative potential of blockchain technology not just for financial services but across various industries, “Bitcoin is the first in on that. It’s the largest asset at the moment, makes up for more than 50% of the crypto market, but that opens up the Ethereum and other use cases, which quite frankly, over the next five to 10 years, you can easily see a lot of traditional finance go on chain.”

Furthermore, he addressed the recent market volatility, noting that Bitcoin had experienced a significant sell-off just prior to the halving, with $260 million in Bitcoin leverage positions being liquidated. The Standard Chartered exec interpreted this as a market correction that might set the stage for a healthier build-up post-halving, saying, “We’ve had a large move lower in Bitcoin. Specifically, on Saturday last weekend, there were $260 million Bitcoin leverage positions that were liquidated. So the market is now looking much more square going into the halving, if you like, in terms of leverage.”

Summarizing his perspective on the future trajectory of Bitcoin, Kendrick expressed a confident outlook, projecting not only recovery but a robust increase in Bitcoin’s price, driven by both the maturation of the ETF market and ongoing technological advancements. His vision for Bitcoin by the end of 2025 reaches even beyond the current year’s target, predicting a potential value of $200,000 per coin.

At press time, BTC traded at $66,556.

Bitcoin price

Bitcoin Price Extends Increase, Why Dips Turned Attractive In Short-Term

Bitcoin price extended its increase and climbed above the $66,000 resistance zone. BTC is now showing positive signs and might find bids near $65,500.

  • Bitcoin gained pace for a move above the $65,500 resistance zone.
  • The price is trading above $65,500 and the 100 hourly Simple moving average.
  • There is a key bullish trend line forming with support at $65,700 on the hourly chart of the BTC/USD pair (data feed from Kraken).
  • The pair could correct lower, but the bulls might remain active near the $65,500 support.

Bitcoin Price Gains Strength

Bitcoin price started a fresh increase above the $64,500 and $65,000 resistance levels. BTC bulls even pushed the price above the $66,000 resistance. It traded to a new weekly high at $67,200 and is currently consolidating gains.

The price is slowly moving lower toward the 23.6% Fib retracement level of the upward move from the $64,281 swing low to the $67,200 low. Bitcoin price is still trading above $65,500 and the 100 hourly Simple moving average.

There is also a key bullish trend line forming with support at $65,700 on the hourly chart of the BTC/USD pair. The trend line is near the 50% Fib retracement level of the upward move from the $64,281 swing low to the $67,200 low.

Immediate resistance is near the $67,000 level. The first major resistance could be $67,200. The next resistance now sits at $68,500. If there is a clear move above the $68,500 resistance zone, the price could continue to move up. In the stated case, the price could rise toward $70,000.

Bitcoin Price

Source: BTCUSD on TradingView.com

The next major resistance is near the $70,500 zone. Any more gains might send Bitcoin toward the $72,000 resistance zone in the near term.

Downside Correction In BTC?

If Bitcoin fails to rise above the $67,000 resistance zone, it could start a downside correction. Immediate support on the downside is near the $66,500 level.

The first major support is $65,700 or the trend line. If there is a close below $65,500, the price could start to drop toward $65,000. Any more losses might send the price toward the $64,200 support zone in the near term.

Technical indicators:

Hourly MACD – The MACD is now losing pace in the bullish zone.

Hourly RSI (Relative Strength Index) – The RSI for BTC/USD is now above the 50 level.

Major Support Levels – $66,500, followed by $65,500.

Major Resistance Levels – $67,000, $67,200, and $68,500.

‘More Upside Is Coming’: Crypto Market Set For 350% Growth, Predicts Glassnode Cofounders

Negentropic, the official X (formerly Twitter) account of Glassnode’s cofounders, has offered its own bullish sentiment for the crypto market.

Glassnode Cofounders: There Would Be A Massive Growth Beyond Recent Corrections

According to their analysis, the market, excluding the top 10 cryptocurrencies, known as “OTHERS,” is showing signs of a strong uptrend with the potential for “more upside” growth.

This observation amidst increased volatility and uncertainty following the recent Bitcoin Halving event on April 20 reduced miners’ block subsidy rewards from 6.25 BTC to 3.125 BTC.

The cofounders pointed out an intriguing pattern in the market’s behavior, comparing the current conditions to the “strong correction” seen in early 2021, which they identified as “wave 4” in the market cycle.

Using their index and Fibonacci levels, Glassnode’s cofounders anticipate approximately a 350% increase from the current market levels, noting:

More upside is coming. This index and our Fibonacci levels gives us, that we may see ~350% upside from current levels.

Notably, this bullish projection underscores their confidence in the potential for further market expansion despite recent downturns.

Crypto Market Recovery Amid Bitcoin Criticism And Post-Halving Predictions

While the Glassnode Co-founders have predicted significant growth for the crypto market, it’s important to note that the overall market sentiment remains bullish. After a notable decline last week, the global crypto market is showing signs of recovery, with nearly a 3% increase in the past 24 hours.

This upward movement can be attributed to major cryptocurrencies like Bitcoin and Ethereum, which have seen gains of 2.7% and 1.7% over the same period.

BTC price chart on TradingView amid crypto news

Bitcoin, the flagship cryptocurrency, has recently faced criticism from prominent figures like Peter Schiff, who criticized its high transaction fees and longer processing times.

Due to these challenges, Schiff labeled Bitcoin as a “failure” in terms of digital currency. However, it’s worth noting that Bitcoin’s average transaction fee has significantly decreased to $34.86 on April 21, following a record high of $128.45 the day before.

Bitcoin Average Transaction Fee

Meanwhile, analyst and founder of the Capriole Investment fund Charles Edwards has shared three possible scenarios for Bitcoin after the Halving.

Edwards highlighted the increase in Bitcoin’s electrical cost to $77,400 per new BTC coin produced, while the overall miner price, including block rewards and fees, surged to $244,000.

He predicts that Bitcoin’s price may skyrocket, approximately 15% of miners may shut down their operations, or transaction fees will remain elevated. Edwards expects a combination of these scenarios to unfold, ultimately leading to Bitcoin’s price surpassing $100,000.

Featured image from Unsplash, Chart from TradingView

Market Expert Predicts New Paradigm For Bitcoin: ‘Days Under $100,000 Numbered’

As the Bitcoin (BTC) Halving event concluded for the fourth time, the cryptocurrency market witnessed notable changes in key metrics. 

These developments have led Charles Edwards, a market expert and founder of Capriole Invest, to issue bold predictions that hint at a paradigm shift in the BTC market. 

Bitcoin Trading At ‘Deep Discount’

One of the key metrics highlighted by Edwards is the staggering electrical cost associated with mining a single Bitcoin. Edwards reveals that this cost has now reached an astonishing $77,4000. This figure represents the raw electricity expenses required to power the Bitcoin network for every newly mined BTC.

Another significant metric that Edwards draws attention to is the Bitcoin Miner Price, which soared to $244,000 on Saturday. This metric encompasses the block reward and fees miners receive for every Bitcoin they successfully mine. 

Notably, this surge in miner price coincided with transaction fees skyrocketing to $230, marking a four-fold increase compared to the previous all-time high of $68 set in 2021.

Bitcoin

Considering the metrics above, Edwards suggests that BTC currently trades at a “deep discount.”  This is because BTC’s price is lower than the electrical costs of mining it.

Typically, this situation only lasts for a few days every four years, suggesting that the price will only take a short time to catch up and surpass this price level, which is slightly below BTC’s all-time high (ATH) of $73,7000, reached on March 14th. 

Edwards outlines three possible outcomes in the wake of these developments. First, he anticipates a scenario in which the price of Bitcoin experiences a significant surge. 

Secondly, there is a likelihood that approximately 15% of miners may be forced to shut down due to unfavorable economics. Finally, Edwards suggests that average transaction fees are expected to remain substantially higher.

Based on the analysis of these metrics and the potential scenarios, Edwards boldly predicts that Bitcoin’s days under the $100,000 mark are “numbered.” While it remains to be seen which of the three outcomes will prevail, Edwards expects a combination of all three factors to contribute to Bitcoin’s price appreciation.

Optimal Buying Opportunity? 

Bitcoin has demonstrated significant price consolidation above the $60,000 mark since Friday, following temporary drops below this threshold amid mounting anticipation for the Halving event. 

Crypto analyst Ali Martinez recently analyzed Bitcoin’s current price state, suggesting that a potential bottom may have formed above these levels, increasing the likelihood of surpassing upper resistance levels shortly.

According to Ali Martinez’s analysis, Bitcoin strives to establish the $66,000 price level as a crucial support zone. Data reveals that approximately 1.54 million addresses collectively purchased 747,000 BTC at this level. If Bitcoin successfully secures this support, it may pave the way for further upward movement.

Martinez identifies Bitcoin’s next critical resistance levels, between $69,900 and $71,200. These levels represent significant price barriers for BTC bulls, and Bitcoin may encounter selling pressure at these levels. 

In addition, the analyst points out that the Bitcoin MVRV ratio, a metric that compares the market value of Bitcoin to its realized value, has shown a promising pattern, as seen in the chart below. 

Bitcoin

Martinez highlights that whenever the MVRV ratio falls below its 90-day average since November 2022, it historically indicates an optimal buying opportunity for Bitcoin. Interestingly, such buying opportunities have resulted in average gains of approximately 67%.

According to Martinez, based on current market conditions and an analysis of the MVRV ratio, now may be an opportune time to consider buying Bitcoin. The historical data and the potential for significant price appreciation support this view. 

Bitcoin

BTC is trading at $66,100, up 1.6% in the past 24 hours. 

Featured image from Shutterstock, chart from TradingView.com

Ethereum Spot ETFs Approval Skepticism Persists, As ETH Recovers

Ethereum Spot Exchange-Traded Funds (ETFs) approval odds continue to witness notable pessimism as the cryptocurrency space awaits the United States Securities and Exchange Commission’s (SEC) decision on the products scheduled for May.

The expectation surrounding the SEC’s decision highlights how important ETF approval is in terms of giving conventional investors more convenient access to Ethereum’s spot market. Presently, data from Polymarket, the world’s largest prediction market, shows that ETH ETF approval odds have fallen to a mere 11%.

Pessimism Deepens As Ethereum ETFs Remain Uncertain

As the May deadline draws near, doubt and skepticism loom large on the horizon, casting a dark shadow for the products. One of the most recent figures to voice doubts about the SEC’s willingness to approve the exchange-traded products this May is Nate Geraci, the president of ETF Store.

According to Geraci, the regulatory watchdog is eerily silent on Ethereum spot ETFs. He further suggested that the products might not be approved due to the SEC’s significantly lower level of engagement with ETF issuers than in previous interactions.

“Logic says that is correct, but also wonder if SEC learned a lesson from clown show with spot Bitcoin ETFs,” he added. Thus, he has pointed out two possible options for the products, which are either an approval or lawsuit from the Commission.

Commenting on the president’s insights, a pseudonymous X user questioned if there is a possibility that activities are taking place behind closed doors in order to avoid disrupting the pre-launch market. Geraci responded, saying he believes that could be possible, drawing attention to Van Eck CEO Jan Van Eck’s review, which might prove otherwise.

It is worth noting that Van Eck is one of the earliest firms to submit its application for an Ethereum exchange product. Even though the company was the first to file for an application, Jan Van Eck is pessimistic about the approval of the ETPs, saying they will probably be rejected in May.

He stated:

The way the legal process goes is the regulators will give you comments on your application, and that happened for weeks and weeks before the Bitcoin ETFs. And right now, pins are dropping as far as Ethereum is concerned.

In light of this, investors prepare for an unpredictable result while managing market swings and modifying their investment plans in the face of changing regulations.

ETH Price Sees Positive Movement

While Ethereum ETFs might be experiencing negative sentiment, ETH, on the other hand, has witnessed a positive uptick lately. ETH has revisited the $3,000 level again after falling as low as $2,888 during the weekend.

Today, ETH price rose by over 4%, reaching around $3,234, indicating potential for further price recovery. At the time of writing, Ethereum was trading at $3,215, demonstrating an increase of 1.40% in the past day.

Also, the asset’s market cap and trading volume are up by 1.40% and 5.96% in the last 24 hours. Given the anticipated impact of the recently concluded Bitcoin Halving on cryptocurrencies, ETH could be poised for noteworthy moves in the coming months.

Ethereum

Is The Bitcoin Bloodbath Over? Analysts Say $60,000 Is The Cycle’s Bottom

Bitcoin enthusiasts around the globe can now breathe a collective sigh of relief as the world’s premier cryptocurrency, Bitcoin, rebounds from a recent downturn.

Last week witnessed Bitcoin, akin to the broader market, sliding below the $60,000 mark, primarily due to risk aversion, the US tax season, and escalating geopolitical tensions in the Middle East. However, in a surprising turn of events, Bitcoin has not only recovered but has surged past the $66,000 mark, reigniting optimism and sparking discussions about its future trajectory.

This recent resurgence in Bitcoin’s price comes on the heels of a significant price correction that coincided with April’s highly anticipated Bitcoin halving event. The halving event, a recurring phenomenon in Bitcoin’s protocol, entails a reduction in the rate at which new Bitcoins are mined, effectively halving the supply.

Historically, this event has been associated with heightened market volatility, as some analysts feared that the supply shock could trigger a prolonged sell-off.

Nevertheless, prominent figures in the cryptocurrency space, such as Tuur Demeester, offer a more sanguine perspective. Demeester suggests that the recent dip to $60,000 might signal the floor of the correction, aligning with historical patterns observed during bull markets.

According to Demeester, a 20% drawdown from highs is considered a typical correction for Bitcoin, and thus, there is a strong possibility that $60,000 could serve as a support level moving forward.

While Demeester advocates for stability in Bitcoin’s price, anoother analyst, McKenna, foresee a period of sideways movement. McKenna agrees with Demeester regarding the $60,000 floor but predicts that Bitcoin may enter a re-accumulation phase, characterized by prolonged sideways price action.

Interestingly, McKenna believes that this sideways movement could present an opportune moment for alternative cryptocurrencies, known as altcoins, to shine in the short term.

The recent resurgence in Bitcoin’s price has sparked optimism among investors and analysts alike. As attention turns to May, all eyes are on whether Bitcoin’s sideways movement materializes and if the effects of the halving event truly dissipate.

With cautious optimism prevailing, the current price range between $60,000 and $71,000 could become a pivotal zone for future price dynamics, ushering in a new era of prosperity in the cryptocurrency markets.

Featured image from Pxfuel, chart from TradingView

Brazil Wants BTC: 7,400 Bitcoin Futures Contracts Created On First Day Of Trading

After announcing in March its plans to include Bitcoin futures in its offerings, B3, a Brazilian stock exchange, has officially opened up trades, achieving a significant milestone on its very first day of trading Bitcoin futures. 

B3 Bitcoin Futures Sees Surge In Demand

Following its launch of Bitcoin futures on April 17, B3 experienced a massive wave of demand and interest from cryptocurrency enthusiasts eager to trade the newly listed Bitcoin futures. The stock exchange reported that on the debut trading day, more than 7,400 Bitcoin futures contracts were actively traded. 

This unprecedented trading volume underscores investors’ strong interest in cryptocurrency derivatives as well as the increasing demand for BTC exposure among Brazilian cryptocurrency traders and enthusiasts. 

Notably, B3 disclosed that the demand for Bitcoin futures on its exchange was so profound that it had hit 111,000 buy or sell orders on the trading screen. The market had displayed intense participation in the newly launched contracts, with the Director of Listed Products at B3, Marcos Skistymas, affirming that the heightened demand resulted from B3’s introduction of its first-ever derivative linked to a cryptocurrency. 

The introduction of Bitcoin futures marks a significant step forward for the stock exchange, aligning with its vision to expand its offerings to cater to users’ needs. Skistymas has also indicated that the market’s response to the recently listed Bitcoin futures was overwhelmingly positive, reflecting a significant potential for these contracts within the Brazilian market. 

BTC Futures To Act As A Hedge Against Market Volatility

According to Skistymas, Bitcoin futures were a “suitable instrument” that could become a hedge against Bitcoin, potentially providing Brazilian investors a means to manage the flurry of risks associated with Bitcoin’s price fluctuations.

For more clarity, a Bitcoin future is a contract between investors who wager on the future price of the pioneer cryptocurrency, providing exposure to Bitcoin without the need to purchase it. Given btc’s high volatility and price fluctuations during certain market conditions, accurately predicting the price of the cryptocurrency can be challenging. Additionally, only a handful of crypto analysts and investors have managed to forecast Bitcoin’s price actions with precision. 

At the beginning of the year, the price of BTC surged from below $50,000 to an all-time high of more than $75,000 in March 2024. As of writing, the cryptocurrency is trading at $66,129 after witnessing a major price correction and plummeting by 0.09% over the past month, according to CoinMarketCap. 

Irrespective of BTC’s unpredictability and price variations, the launch of Bitcoin futures on B3 has the potential to bring in a new era of adoption among Brazilian investors, providing them with fresh opportunities to diversify their portfolios with these regulated financial instruments.

Bitcoin price chart from Tradingview.com

Bitcoin Miners Strike Gold: $107 Million Profit From Runes-Fueled Minting Spree

Bitcoin miners have struck a proverbial goldmine, reaping an astonishing $107 million in profits, according to data from Glassnode, a leading analytics platform. This unprecedented windfall, amassed on April 20th, underscores a significant shift in the revenue dynamics of Bitcoin mining operations.

The meteoric rise in transaction fees serves as a bellwether for the evolving economic landscape of Bitcoin mining. As the network adapts to new market demands and technological advancements, transaction fees have emerged as a crucial revenue stream for miners. This trend is particularly noteworthy given the scheduled reductions in block rewards, highlighting the resilience and adaptability of Bitcoin’s economic model.

Runes-Fueled Minting Spree Boosts Miner Revenue

Driving this surge in profitability is a recent minting spree focused on Runes, a pivotal development that has left a tangible mark on the network’s dynamics. Reports indicate that a staggering 75% of the total profits stemmed from transaction fees, marking a new pinnacle in the distribution of revenue among BTC miners.

Runes is similar to Ordinals; they both let users permanently store data directly on the Bitcoin blockchain, like an inscription etched in stone. But there’s a key distinction in what they store: Ordinals are one-of-a-kind digital collectibles, similar to fancy trading cards.

Runes, on the other hand, are designed to act more like meme coins, those widely tradable and often humorous tokens that have been a recent craze in the crypto world.

This paradigm shift in income composition underscores the growing importance of transaction fees as a vital income source, especially as block rewards face planned reductions in the context of Bitcoin’s halving system.

This financial triumph comes amidst ongoing debates surrounding the sustainability and profitability of mining activities. With escalating energy demands and mounting regulatory scrutiny, the viability of mining operations has been called into question. However, the recent data paints a reassuring picture of the economic vitality of Bitcoin mining, demonstrating its resilience in the face of external pressures.

Implications For Bitcoin’s Future

Beyond the immediate financial gains, the surge in transaction fees holds profound implications for the future trajectory of Bitcoin. The unprecedented collection of fees signifies robust network activity and user engagement, indicating strong demand and utilization of the Bitcoin blockchain.

This bodes well for the long-term sustainability and development of Bitcoin as a prominent digital currency, bolstering confidence among stakeholders and enthusiasts alike.

Featured image from VistaCreate, chart from TradingView

Bitcoin Price Approaches Breakout, Can BTC Pump Above $66K?

Bitcoin price recovered and climbed above the $64,000 resistance zone. BTC is now facing hurdles near the $65,500 and $66,000 levels.

  • Bitcoin is now struggling to gain pace for a move above the $65,500 resistance zone.
  • The price is trading above $64,000 and the 100 hourly Simple moving average.
  • There is a key contracting triangle forming with resistance at $65,100 on the hourly chart of the BTC/USD pair (data feed from Kraken).
  • The pair could start a fresh surge if it clears the $65,500 resistance zone.

Bitcoin Price Starts Increase

Bitcoin price found support above $60,000 and started a fresh increase. BTC climbed above the $62,500 and $63,500 resistance levels. The bulls even pushed the price above the $65,000 level.

However, the bears seem to be active near the $65,500 zone. The recent high was formed at $65,598 and the price is now consolidating gains. There was a drop below the $65,000 level, but the price is still above the 23.6% Fib retracement level of the upward move from the $59,666 swing low to the $65,598 low.

Bitcoin price is trading above $64,000 and the 100 hourly Simple moving average. Immediate resistance is near the $65,100 level. There is also a key contracting triangle forming with resistance at $65,100 on the hourly chart of the BTC/USD pair.

The first major resistance could be $65,500. The next resistance now sits at $66,000. If there is a clear move above the $66,000 resistance zone, the price could continue to move up. In the stated case, the price could rise toward $67,500.

Bitcoin Price

Source: BTCUSD on TradingView.com

The next major resistance is near the $68,500 zone. Any more gains might send Bitcoin toward the $70,000 resistance zone in the near term.

Downside Correction In BTC?

If Bitcoin fails to rise above the $65,500 resistance zone, it could start a downside correction. Immediate support on the downside is near the $64,500 level.

The first major support is $64,000. If there is a close below $64,000, the price could start to drop toward the 50% Fib retracement level of the upward move from the $59,666 swing low to the $65,598 low at $62,500. Any more losses might send the price toward the $61,200 support zone in the near term.

Technical indicators:

Hourly MACD – The MACD is now losing pace in the bullish zone.

Hourly RSI (Relative Strength Index) – The RSI for BTC/USD is now near the 50 level.

Major Support Levels – $64,500, followed by $64,000.

Major Resistance Levels – $65,100, $65,500, and $66,000.

Were Bitcoin Miners Behind The BTC Price Crash Below $60,000?

The price of Bitcoin fell drastically towards the $60,000 mark in the days leading up to the just concluded halving. On-chain data has shed light on what could very well be the reason for this price dip in the middle of all the excitement around the halving.

Particularly, data has revealed that some miners have been selling their holdings in the days leading up to the halving event, with the entire BTC holdings of miners hitting a 12-year low. 

Miners’ Bitcoin Holdings Hit 12-Year Low

On-chain analytics platform IntoTheBlock noted this interesting trend amongst Bitcoin miners. According to the platform’s “Miners’ Bitcoin Holdings,” the collective BTC reserve across various miners has now dropped below 1.9 million BTC, its lowest in over 12 years.

Interestingly, the metric shows that miner reserves have been on a continued trend of outflows since the beginning of the year, just after the approval of Spot Bitcoin ETFs. This means the outflow from miner wallets can be linked to increased demand from the various Bitcoin ETF wallets, with the latter now controlling over 4.27% of the total circulating wallets.

At the time of writing, CryptoQuant data puts the total number of miner reserves at 1.818 million BTC, a decrease of 22,000 BTC from 1.84 million on January 3. Additionally, this outflow from the miner reserves was exacerbated in the days leading up to the halving, as noted by IntoTheBlock.

“This indicates that miners have been net sellers leading up to the halving,” IntoTheBlock said in a social media post.

The persistent selling pressure exerted by miners may have been a contributing factor in Bitcoin’s stagnant pace between $65,000 and $70,000 over the past weeks. This outflow of BTC from miner wallets into the market seems to have flooded the market with more than enough BTC, which in turn contributed to a crash to $60,000 during the week.  

What’s Next For Bitcoin?

The practice of Bitcoin miners selling their holdings in the days leading up to the halving is not unusual, as demonstrated by their actions in past halving events. At the time of writing, Bitcoin is trading at $64,978, up 8% after rebounding up at $60,000. The much anticipated fourth Bitcoin halving has now been completed and the industry looks forward to its effect over the next few months. 

The halving is ultimately a balancing act for miners. Although miners’ revenues are cut in half, the reduced Bitcoin supply and possible price increase can help offset some of the losses over time. According to a report, Bitcoin miners could sell up to $5 billion worth of BTC after the halving, with the price of the cryptocurrency potentially falling to $52,000.

Featured image from Pexels, chart from TradingView

Battle For The Halving Block: Bitcoin Users Spend Record $2.4 Million On Block 840,000

With Bitcoin finally completing its fourth-year halving cycle, many users are aggressively competing for halving blocks, paying exorbitant amounts of fees to mine a single block. 

Bitcoin Mining Pool Pays Over $2.4 Million In Block Fees

Earlier today, the 840,000th block was added to the Bitcoin blockchain, triggering the onslaught of the highly anticipated halving event. While the price of BTC did not witness a dramatic change following the halving, transaction fees spiked to unprecedented highs. 

Amidst the massive competition, a mining pool identified as ViaBTC had successfully mined the 840,000th Bitcoin block. Cumulatively, BTC users had spent a staggering $37.7 BTC in mining fees, equivalent to $2.4 million, recording the highest fee ever paid for a Bitcoin block. 

According to reports from mempool, after ViaBTC had produced the 840,000th block, the protocol had initiated an automated reduction of miners’ reward by half, from 6.25 BTC to 3.125 BTC per block. In addition to the fees, ViaBTC had received a total payout of 40.7 BTC, valued at approximately $2.6 million, for mining the historic block.  

While it may seem that Bitcoin miners had thrown caution to the wind by spending over $2.4 million on a single block, the 840,000th block had a major significance within the cryptocurrency space. The historic Bitcoin block is said to hold the first Satoshis, ‘sats,’ the smallest units of BTC following the halving. 

There are several of these “epic sats,” that appear after the halving event, coveted as a rare collector’s item among cryptocurrency enthusiasts. Some even speculate that these Bitcoin fragments could be potentially worth millions of dollars. 

Including the hype surrounding these fragmented BTC, much of the competition for the Bitcoin blocks, following the halving has been attributed to the new Runes Protocol which launched at the same time as the Bitcoin halving. 

Degens Rush To Secure Infamous Rune Tokens

The Runes Protocol, created by Casey Rodamor, a Bitcoin developer, has sent shockwaves through the cryptocurrency community, as degens are avidly competing to etch and mint tokens directly on the Bitcoin network. 

While mining pools were mining new Bitcoin blocks, degens had paid over 78.6 BTC valued at $4.95 million to mint the rarest Runes. This exponential surge in fees has been an unprecedented event, highlighting the increased adoption and participation of the Bitcoin network.

According to reports from Ord.io, a Rune labeled as ‘Decentralized’ was acquired for a fee of 7.99 BTC, equivalent to $510,760. While another titled ‘Dog-Go-To-The-Moon’ was obtained for a fee of 6.73 BTC, worth approximately $429,831.

Leonidas, protocol developer and host of the groundbreaking Ordinals, a system for numbering “epic sats,” has declared the Runes Protocol a remarkable success as degens have “single-handedly offset the drop in miner rewards from the halving.” He concluded that Runes have significantly impacted Bitcoin’s security budget, potentially playing a major role in ensuring the network’s sustainability.

Bitcoin price chart from Tradingview.com (Bitcoin halving)