Forbes Unveils 20 Crypto ‘Zombies,’ Declares Ripple And XRP Among The Undead

In a controversial report, Forbes unveiled a list of 20 “crypto billion-dollar zombies,” Layer 1 (L1) tokens, which the news outlet defines as crypto assets with substantial valuations but “limited utility beyond speculative trading.” 

These cryptocurrencies and projects include Ripple, XRP, Ethereum Classic (ETC), Tezos (XTZ), Algorand (ALGO), and Cardano (ADA), among others. 

XRP And Ethereum Classic In The Spotlight

Ripple Labs, the company behind XRP, was highlighted as a prominent crypto zombie. Despite XRP’s active trading volume of around $2 billion daily, Forbes asserts that the token’s primary purpose remains “speculative” and “lacking meaningful utility.” 

However, Ripple Labs and XRP are not alone in this regard. Forbes reveals that 50 blockchains, excluding Bitcoin (BTC) and Ethereum (ETH), currently trade at values surpassing $1 billion, with at least 20 of them classified as “functional zombies.” Collectively, these 20 blockchains hold a market value of $116 billion, despite having “limited user bases.”
Crypto

According to Forbes, an example of a “functional zombie” is Ethereum Classic, which maintains the distinction of being the original Ethereum chain. 

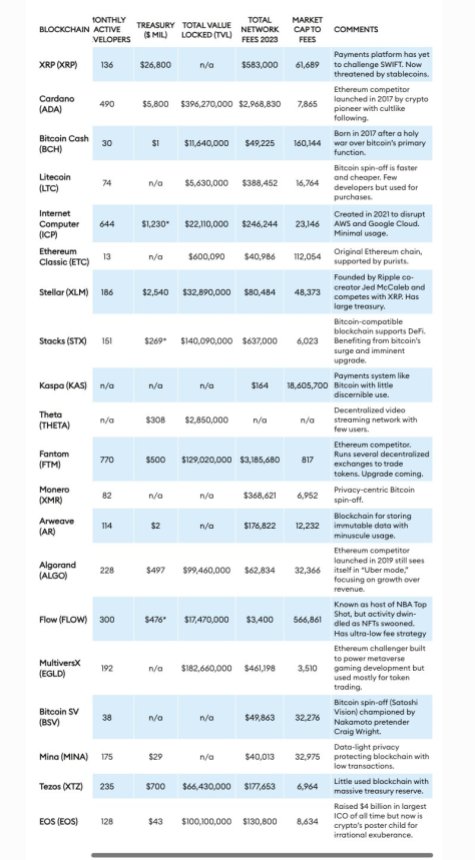
While ETC has a market value of $4.6 billion, its fee generation in 2023 was less than $41,000, raising questions about the blockchain’s viability for the news organization.

Another crypto project in Forbes’ report is Tezos, which raised $230 million through an initial coin offering (ICO) in 2017. 

Tezos’ XTZ token currently holds a market capitalization of $1.2 billion. However, the blockchain’s fee earnings were meager, with $5,640 in February 2024 and a total of $177,653 for all of 2023. 

Algorand, once hailed as an “Ethereum killer” due to its capability of processing 7,500 transactions per second, faces similar challenges. 

Despite a market cap of $2 billion and a treasury holding of $500 million, Algorand earned $63,000 in blockchain transaction fees throughout 2023. For Forbes, this casts doubt on its actual adoption and utility.

Crypto ‘Zombie’ Blockchains

The zombie blockchains are categorized into two groups by Forbes: spin-offs and direct competitors to established blockchains like Bitcoin and Ethereum. 

Spin-off zombies include Bitcoin Cash (BCH), Litecoin (LTC), Monero (XMR), Bitcoin SV (BSV), and Ethereum Classic. 

These blockchains, collectively valued at $23 billion, reportedly emerged from “disagreements” among programmers regarding the governance and direction of the original chains

Forbes notes that when such conflicts arise, hard forks occur, resulting in new networks that share the same transaction history as their predecessors. The agency claims that their market value “often exceeds” their real-world usage.

Overall, The report highlights a growing disparity between the valuations of certain projects in the cryptocurrency industry and their actual utility and usage. Consequently, Forbes refers to these projects as “zombies.”

Crypto

Featured image from Shutterstock, chart from TradingView.com 

Expert Makes Bold Call: It’s Time To Swap Your Dollars For Bitcoin

Billionaire investor Anthony Scaramucci, the founder of SkyBridge Capital, recently discussed the viability of financial assets. He took to X, a social media platform previously known as Twitter and owned by Elon Musk, to highlight the decreasing purchasing power of the United States dollar in comparison to the potential of Bitcoin (BTC).

US Dollar Vs. Bitcoin Value Performance

In the post on X, the SkyBridge Capital founder pointed out that a dollar from 2020 is now only worth about 75 cents, underscoring a significant devaluation due to inflation.

According to Scaramucci, this scenario illustrates why investors should reconsider traditional fiat currencies as a reliable store of value, advocating instead for the inherent benefits of digital assets like Bitcoin.

Scaramucci’s critique comes at a time when the global economy grapples with heightened inflation rates, which have eroded the real value of fiat money.

He specifically cited a “25.14% compounded inflation rate” as a critical indicator of why the dollar is losing ground. In contrast, Bitcoin has not only maintained a strong profile but has also appreciated in value, further cementing its position as a viable hedge against inflation and a potential safe haven for investors.

So far, Bitcoin’s market performance has been quite appealing. Particularly, despite the significant downturn experienced in the past few years, the asset has managed to come out of the bloodbath and recently soared to an all-time high above $73,000 in March.

This peak performance labels Bitcoin as not just a digital asset but a major player in the global financial landscape.

However, despite Scaramucci’s bullish outlook, it’s worth noting that Bitcoin has seen its share of volatility. It has been struggling to maintain its appeal recently, with a modest 0.9% increase in the last 24 hours – a slight recovery from a 2% drop over the past week.

Bitcoin (BTC) price chart on TradingView

BTC Shifting Market Sentiments

Further insights into the market’s behavior towards Bitcoin reveal changing dynamics. Data from CryptoQuant highlighted a negative turn in the Bitcoin funding rate for the first time since October 2023, indicating a cooling interest in speculative trading on the asset.

This shift suggests that while the long-term outlook might still be strong, short-term investor sentiment has become cautious, possibly awaiting clearer signals before making further commitments.

The current market sentiment is also reflected in the technical analysis of a prominent crypto analyst, Ali. In Ali’s recent post on X, a notable mention was made of a “death cross” seen in Bitcoin’s 12-hour chart, where the short-term moving average dips below a long-term counterpart, traditionally a bearish signal.

Additionally, the Tom Demark (TD) Sequential indicator points to potential price reversals after a consistent trend, adding another layer of complexity to Bitcoin’s trading strategy.

Despite these potentially bearish indicators, on-chain data from Santiment shows an interesting trend: Bitcoin whales have increased their holdings significantly, now owning 25.16% of the total supply.

This accumulation suggests that while retail sentiment may be bearish, large-scale investors are seeing the dips as buying opportunities, potentially prepping for a future bullish run.

Featured image from Unsplash, Chart from TradingView

Timing The Breakout: When Will Bitcoin Escape The Post-Halving Consolidation?

Bitcoin (BTC), the largest cryptocurrency in the market, has been trading within a re-accumulation range between the $59,000 and $70,000 price levels for the past month and a half. 

Crypto analyst Rekt Capital recently shared its perspective on this phase and its potential duration, drawing from historical patterns and data in a post on social media platform X (formerly Twitter).

Breakout Timing And Historical Patterns

According to Rekt’s analysis, Bitcoin tends to experience a re-accumulation range following the Halving event, which occurs every four years to counteract any inflationary effect on Bitcoin by lowering the reward amount for miners and maintaining scarcity. 

Historically, This consolidation phase lasts up to 150 days before Bitcoin breaks into a parabolic uptrend. Based on this pattern, if Bitcoin continues to consolidate for the next 150 days, Rekt suggests a breakout would be expected in September 2024.

The ideal duration of a re-accumulation range is crucial in determining Bitcoin’s future trajectory. Rekt Capital noted that when Bitcoin reached a new all-time high (ATH) of $73,700 in mid-March, it accelerated its cycle by 260 days. However, with over 49 days of consolidation, the acceleration has reduced to approximately 210 days.

Resetting The Bitcoin Halving Cycle

Repeating historical trends, where Bitcoin consolidates for 150 days after the Halving, would still indicate an acceleration in the current cycle, albeit by a lesser extent of 60 days. 

Nevertheless, Rekt contends that Bitcoin would ideally need to consolidate for at least 210 days to fully resynchronize with its historical Halving cycles and reset the current acceleration in this cycle to 0. This would bring the rate of acceleration to 0 days and potentially lead to a breakout around November 2024.

The analyst further suggested that to achieve a 200+ day post-Halving consolidation and fully resynchronize with historical Halving cycles, Bitcoin would need to replicate its mid-2023 re-accumulation range, which lasted 224 days before a new uptrend emerged. Rekt concluded:

Overall, how long this current Re-Accumulation Range will last will dictate the remaining acceleration in this cycle and ultimately influence where Bitcoin will finally peak in its Bull Market. 

Bitcoin

The largest cryptocurrency, with a market capitalization of $1.2 billion, is currently trading at $64,400, showing minimal fluctuations compared to Thursday’s price movements. 

Recently, Bitcoin has encountered resistance at the $66,000 level, hindering its ability to consolidate above this threshold. Conversely, the $63,400 level may serve as a support base for the cryptocurrency in the event of heightened downward volatility over the weekend.

Featured image from Shutterstock, chart from TradingView.com

Crypto Analyst Predicts Massive Move For Bitcoin, What’s The Target?

Despite BTC’s recent unimpressive price action, crypto analyst Doctor Profit has shared his bullish sentiment for Bitcoin and the broader crypto market. The analyst further suggested that a parabolic move was imminent and that crypto investors should position themselves accordingly. 

Crypto Market Preparing For A “Third Industrial Revolution”

Doctor Profit mentioned in an X (formerly Twitter) post that the crypto market “is preparing itself for the third Industrial Revolution,” thereby hinting at a trend reversal for Bitcoin and altcoins soon enough. “Be part of it, or regret for [a] lifetime,” the crypto analyst added as he warned crypto investors of missing this market rally.  

Related Reading: HBAR Prices Crashes 35% As BlackRock Denies Any Ties To Hedera

In a previous X post, Doctor Profit gave an idea of what to expect from the crypto market (Bitcoin in particular) when it makes its next leg up. He stated that the flagship crypto will rise to $84,000 after it is done trading the sideway range between $60,000 and $72,000. In another X post, he claimed that the super cycle will start after Bitcoin hits $72,000. 

Meanwhile, Doctor Profit suggested that the price corrections experienced were normal and usually occur in each crypto cycle. He further remarked that the 10 to 20% price fluctuations weren’t big moves. His statement echoes the sentiment of Alex Thorn, Head of Research at Galaxy Digital, who previously warned that bull markets weren’t “straight lines up.”

Bitcoin Is In The Re-Accumulation Period 

In a recent X (formerly Twitter) post, crypto analyst Rekt Capital confirmed that Bitcoin is currently in the Re-Accumulation phase, which occurs after the Bitcoin Halving. He further noted that the goal now “is for Bitcoin to move sideways to catch a breather, for the market to cool off after [a] fantastic Pre-Halving price performance.  

According to Rekt Capital, this Re-Accumulation period can last for multiple weeks “and even up to 150 days.” The analyst revealed that once this period is over, Bitcoin will experience a breakout from this sideways range, followed by a parabolic uptrend

This uptrend phase is said to last for over a year. However, with the probability of this being an accelerated market cycle, Rekt Capital remarked that the duration for this uptrend could be cut in half. Crypto analysts like Tom Dunleavy, Partner and Chief Investment Officer (CIO) at MV Capital, predict that the flagship crypto will rise as high as $100,000 when that time comes. 

At the time of writing, Bitcoin is trading at around $64,360, up in the last 24 hours according to data from CoinMarketCap.

Bitcoin price chart from Tradingview.com

Analysts Call It: XRP Primed For A 700% Surge – Details

Ripple’s XRP token finds itself navigating through turbulent waters. Over the past few months, XRP has experienced significant price fluctuations, leaving investors pondering the trajectory ahead. Despite a modest weekly gain, XRP remains below its 30-day average, signaling a bearish sentiment prevailing in the market.

XRP Price Wobbles: Downward Trend Or Temporary Dip?

At its current value of approximately $0.52, XRP reflects a market sentiment characterized by uncertainty. However, amidst the downward trend, a chorus of analysts is singing a different tune, foreseeing a potential surge in XRP’s price.

Notable crypto analyst Egrag Crypto has outlined optimistic scenarios, projecting price ranges between $1.20 to $4 – or an increase of around 360%-700% – by mid-summer and September, respectively. These predictions, anchored in historical data and technical analysis, envision a bullish trajectory akin to XRP’s performance in 2021.

Beyond The Hype: Reasons For Caution

Amidst the fervor surrounding bullish predictions, a note of caution resonates within the cryptocurrency community. The inherent volatility of the market and lingering regulatory uncertainties serve as sobering reminders of the risks associated with investing in XRP.

While past performance may hint at future possibilities, it offers no guarantees in the ever-evolving landscape of digital assets. Moreover, even in the event of a favorable verdict for Ripple, regulatory scrutiny could persist, casting a pall over XRP’s potential growth trajectory.

Legal Battle: A Catalyst For Change?

Fueling the bullish sentiment are analysts like Dark Defender, who emphasize the pivotal role of Ripple’s ongoing legal battle with the US Securities and Exchange Commission (SEC). The outcome of this protracted lawsuit, which alleges Ripple’s violation of securities laws, holds significant implications for XRP’s future.

Despite the regulatory cloud looming over Ripple, partial victories in court have bolstered optimism among supporters, hinting at a possible turnaround in XRP’s fortunes. Dark Defender, in particular, highlights the prospect of a “momentous pattern shift” upon a favorable resolution of the legal dispute, underlining its potential to catalyze a substantial price rally.

Investors On The Edge

The lawsuit, simmering for over three years, has cast a long shadow over XRP’s trajectory. With the SEC seeking a hefty $2 billion fine against Ripple for alleged securities violations, the stakes are undeniably high.

Ripple, on the other hand, maintains its innocence and contests the charges, offering a counter-penalty of a mere $10 million. Yet, the uncertainty stemming from the legal standoff has left investors on edge, wary of the potential ramifications on XRP’s classification and market dynamics.

Featured image from Science Photo Gallery, chart from TradingView

After WIF, BONK, BODEN: Top Crypto Trader Now Buys These 2 Memecoins

Memecoins are once making waves in the crypto market. In the last 24 hours, 4 of the 10 best-performing cryptocurrencies in the top 100 are meme coins. The biggest gainers include BONK (+10.2%), PEPE (+4.8%), WIF (+4.7%) and FLOKI (+4.1%). With meme coins slowly regaining, crypto traders are seemingly focusing on lesser-known coins.

Top Crypto Trader Focuses On These 2 Memecoins

According to data from on-chain analysis service Lookonchain, the renowned crypto trader known as “paulo.sol” has been making significant moves into new memecoin territories. Paulo.sol, who has previously amassed substantial profits from meme coins like BONK, WIF, and BODEN, is now shifting his focus to acquiring significant stakes in PUPS and POPCAT.

Lookonchain’s recent posts on X (formerly Twitter) provide a deep dive into paulo.sol’s past and present investment patterns. “What a legend! Paulo.sol has realized profits of $9.51M on WIF, $7.04M on BODEN, and $6.28M on BONK,” Lookonchain tweeted. In total, the crypto trader has made $22 million in realized profits.

The posts further reveal that paulo.sol bought into BONK early in November 2023, capturing substantial gains as its value surged. “As early as Nov 11, 2023, paulo.sol noticed the rising of BONK and bought BONK. He made ~$6.28M by buying BONK at low prices and selling at high,” the data provider stated.

The crypto trader continued his strategy by investing in WIF and BODEN in December 2023 and March 2024, respectively, following their sharp price increases. Notably, “paulo.sol did not buy WIF and BODEN when they first went online, but paid attention to and bought heavily when they first rose sharply,” Lookonchain observes.

As of now, paulo.sol continues to hold 12.87 million BODEN tokens valued at approximately $7.6 million and 1.87 million WIF tokens worth around $5.7 million. However, his most recent activities show a pivot towards new meme coins, PUPS and POPCAT, sparking interest among investors and analysts alike.

Lookonchain noted, “We noticed that paulo.sol is buying PUPS and POPCAT recently. He spent $1.77M to buy 4.3M POPCAT at $0.42 today. And he has spent $5.97M to buy 101,712 PUPS at $59 since Apr 11, becoming the largest holder of PUPS on Solana.”

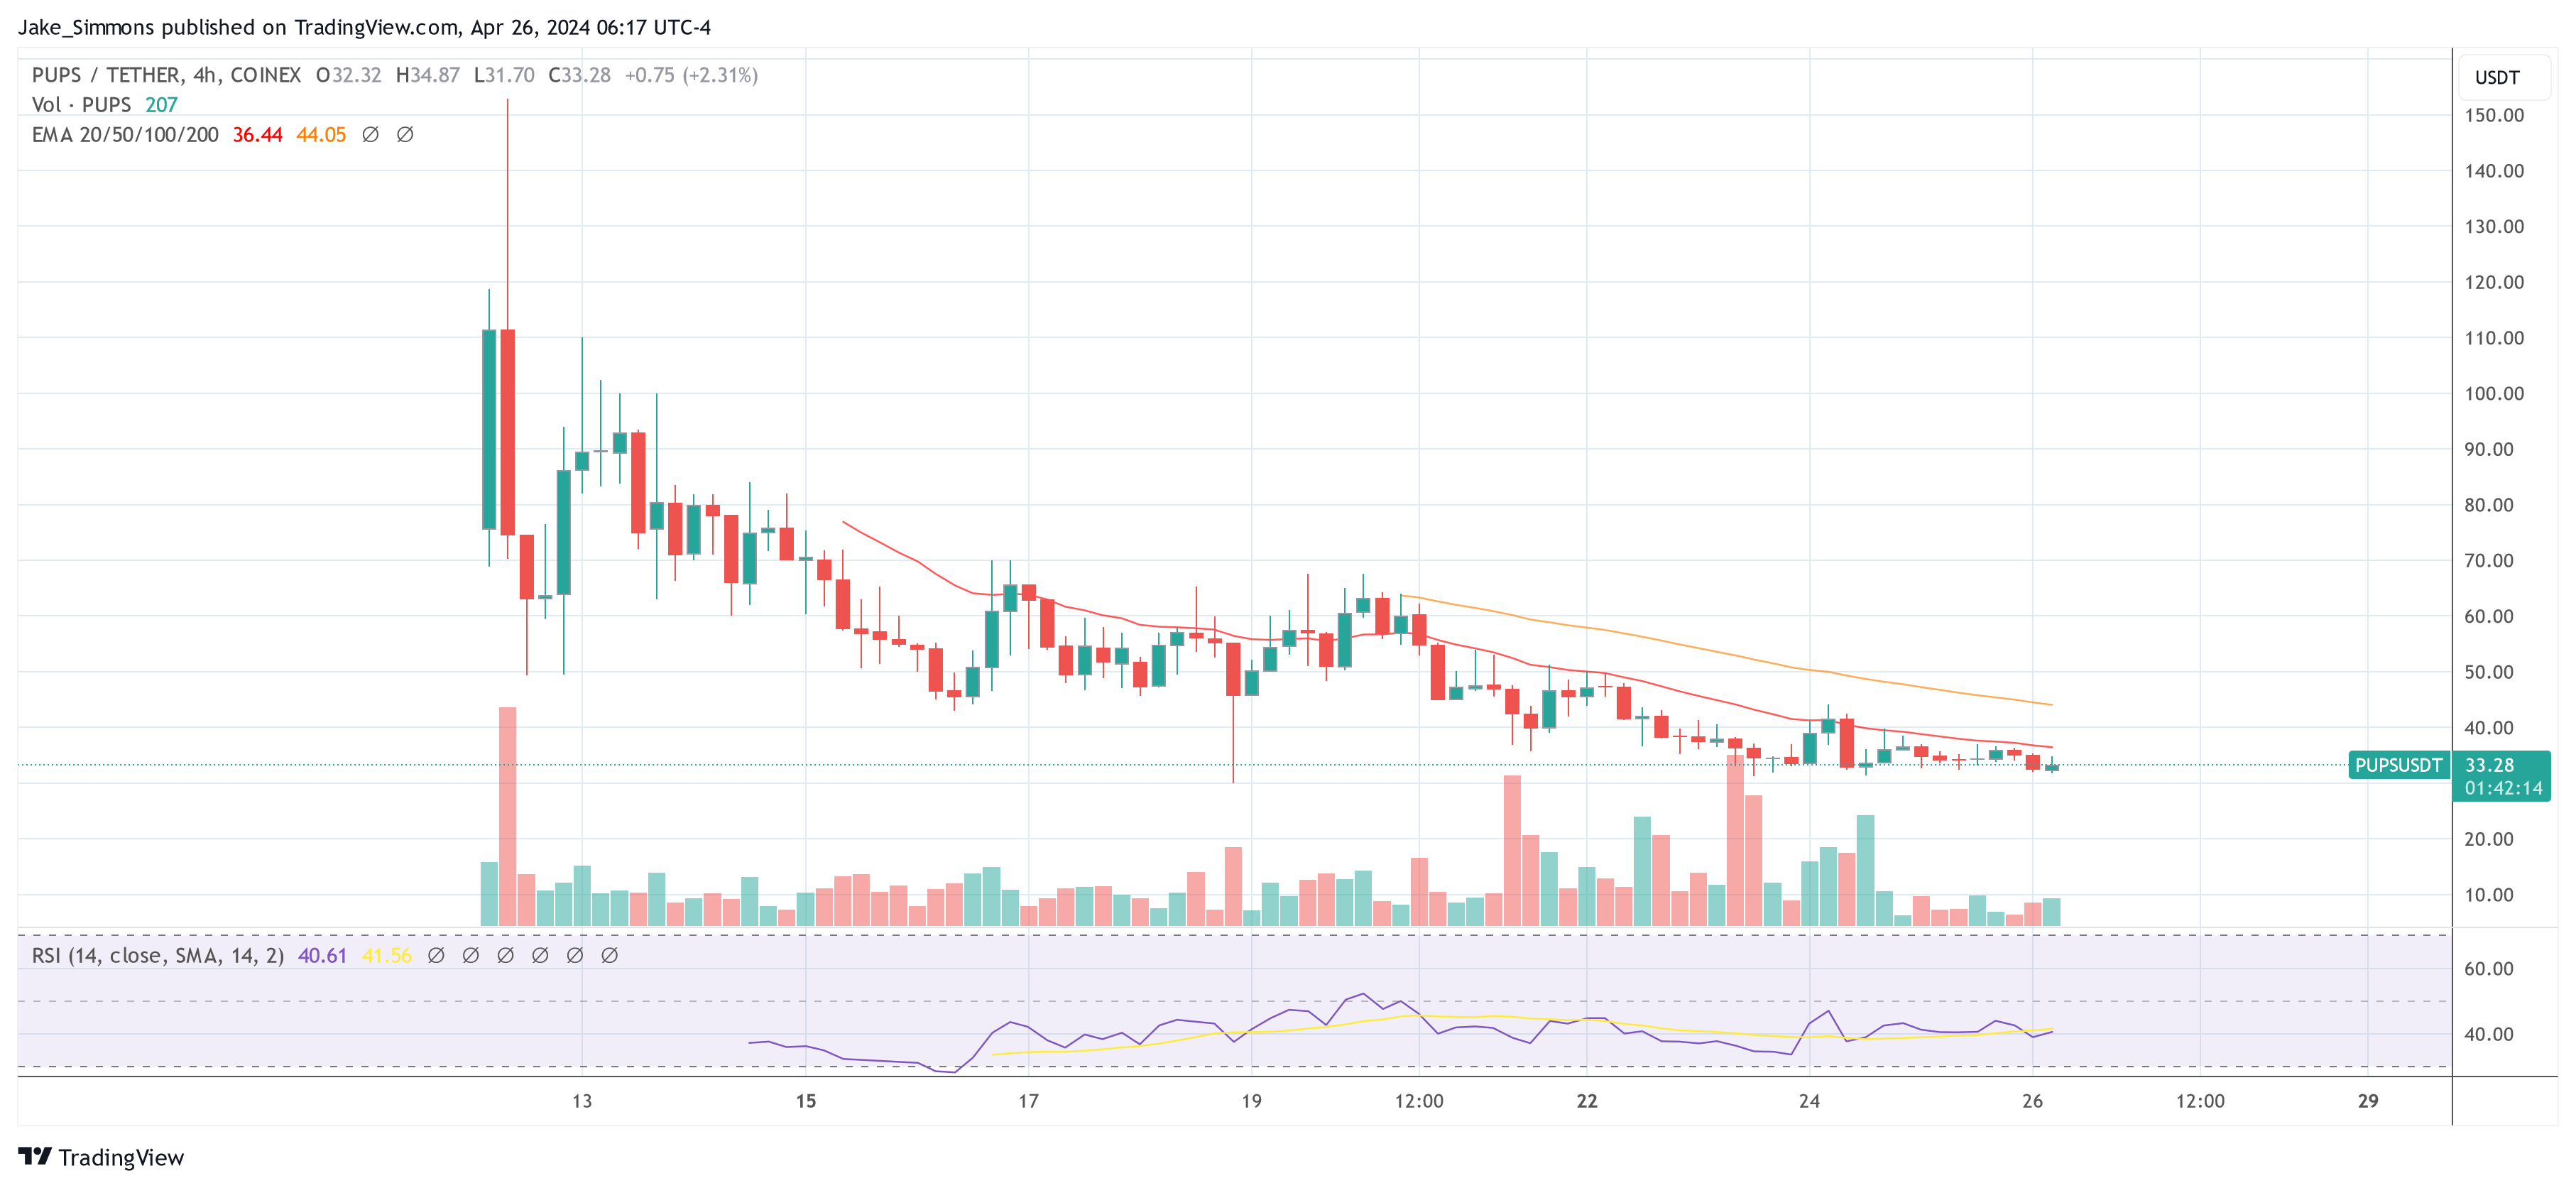
The impact of paulo.sol’s investment has been palpable in the market dynamics of the newly favored meme coins. Despite a general downturn in the memecoin sector, POPCAT’s price surged by 52% today, trading at approximately $0.51 with a trading volume increase of 51% to $166 million. Over the past nine days, POPCAT has risen a whopping 410%.

On the other hand, PUPS is seeing a price drop of 4.2% today, trading at $36.96, with a 27% fall in trading volume to $2.82 million. Since reaching an all-time high above $152 on April 14 (on Coinex), the PUPS price is down more than 78%.

PUPS price

Is SUI Sinking? TVL Tanks As Crypto Price Fails To Keep Afloat

For crypto investors, the last several weeks have been a rollercoaster, with many assets seeing price dips and failing to post meaningful gains. The short-term outlook is bleak, despite some analysts’ continued optimism on the market’s long-term prospects.

Halving Hype Fades

Even the granddaddy of cryptocurrencies, Bitcoin (BTC), hasn’t been immune to the market downturn. Currently trading around $63,400, BTC is down 5% in the past day and a staggering 13% from its all-time high of over $73,000.

This sluggish performance follows the recent Bitcoin halving event, which some enthusiasts believed would trigger a price surge. However, market experts had predicted otherwise, and it seems their forecasts were on point.

The halving, which cuts the number of new Bitcoins entering circulation in half every four years, is intended to control inflation and theoretically increase scarcity over time. However, its impact on short-term price movements appears minimal.

SUI Ecosystem Feels The Squeeze

One cryptocurrency experiencing a particularly harsh beating is Sui (SUI), the native token of the Sui blockchain ecosystem. SUI has been on a downward trajectory for the past week, plummeting a staggering 30% from its all-time high of $2.20.

This week alone, SUI has dipped as low as $1.15 before experiencing a brief uptick, only to fall again. The current price sits around $1.18, reflecting a 10% loss in the past 24 hours.

SUI’s TVL Tumbles

Adding to Sui’s woes is the significant decline in its total value locked. TVL refers to the total amount of cryptocurrency locked in DeFi (Decentralized Finance) protocols within a particular blockchain ecosystem.

A high TVL indicates strong user activity and locked funds, which are seen as positive indicators for the health of the ecosystem. Unfortunately for Sui, its TVL has tumbled 30% from its record high earlier this year, currently sitting at around $535 million according to DefiLlama data.

This drop in TVL suggests a decrease in user engagement and locked funds within the Sui ecosystem, mirroring the broader negative sentiment.

Broader Market Correction Or Underlying Issues?

The current market slump isn’t limited to Sui or even Bitcoin. Major altcoins like Ethereum, Solana, and Curve DAO have also seen losses ranging from 4% to 6% over the past week. This suggests a broader market correction rather than an issue specific to Sui.

Analysts point to several factors potentially contributing to the downturn, including rising inflation concerns, ongoing geopolitical tensions, and a general risk-off sentiment among investors.

What Lies Ahead For Crypto?

While the short-term outlook for the crypto market appears uncertain, many analysts remain optimistic about the long-term potential of the technology. The underlying innovation and potential for disruption across various sectors continue to attract interest.

However, navigating the current volatility will likely require a strong stomach and a long-term investment horizon for those looking to weather the storm.

Featured image from Charleston Dermatology, chart from TradingView

Shiba Inu Price Prediction: Can Meme Coin Hit $0.001 This Year? Investor Makes Daring Call

The world of cryptocurrencies is abuzz with speculation once again, this time centered around Shiba Inu (SHIB), the Dogecoin-inspired meme coin. Prominent Bitcoin investor Armando Pantoja has thrown down the gauntlet, predicting a price surge for SHIB, potentially reaching $0.001 by the end of 2025. This ambitious target has reignited discussions about SHIB’s potential and its ability to carve a niche beyond its meme-coin origins.

SHIB’s past is a story of remarkable growth. In 2021, the meme coin defied expectations, experiencing a meteoric rise of over 800,000%. This phenomenal journey minted crypto millionaires and captured the imagination of retail investors. However, unlike established players like Bitcoin and Ethereum, SHIB’s initial value proposition was primarily driven by its meme status and community enthusiasm.

However, the tides appear to be shifting. Recognizing the need for more than just viral appeal, the Shiba Inu team has been actively developing its ecosystem. A central initiative in this effort is the upcoming Shibarium hardfork, scheduled for launch on May 2nd. This upgrade aims to introduce Shibarium, a layer-2 scaling solution designed to address scalability concerns and enhance user experience.

Shibarium: A Potential Ethereum Killer?

The potential impact of Shibarium is drawing comparisons to the highly anticipated Ethereum 2.0 upgrade. Ethereum, the world’s second-largest cryptocurrency by market cap, has long grappled with scalability issues, leading to high transaction fees and network congestion.

Ethereum 2.0 promises to address these challenges by transitioning to a proof-of-stake consensus mechanism, offering faster processing times and lower fees. However, its development has faced delays, leaving a gap in the market for user-friendly alternatives.

Shibarium’s success could position SHIB as a more attractive option for developers seeking to build decentralized applications (dApps). By offering faster and cheaper transactions, Shibarium could potentially lure developers away from Ethereum, especially those focused on projects requiring frequent interactions and lower costs. This scenario could mirror the way Ethereum itself disrupted the dominance of Bitcoin in the early days of decentralized finance (DeFi).

A Major Obstacle

Despite the optimism surrounding Shibarium, reaching $0.001 by 2025 remains a significant hurdle. The cryptocurrency market is inherently volatile, and unforeseen events can drastically impact prices. Widespread adoption of Shibarium is crucial for long-term growth, and its success hinges on attracting developers and users to build a robust ecosystem.

As of the time of publication, Shiba Inu is trading at $0.00002459, indicating a decrease of 9% over the previous day. For Shiba Inu to potentially reach a price higher than $0.001 this year, it needs to increase by nearly 4,000%.

Meanwhile, some analysts remain cautious. While acknowledging SHIB’s past gains, they point to the dominance of established cryptocurrencies like Ethereum and the overall market conditions. Platforms like Telegaon offer a more conservative outlook, predicting a maximum price of $0.0000728 for SHIB by 2025, falling short of its all-time high.

Featured image from Pixabay, chart from TradingView

Crypto Bull Run Set To Return Next Week, Predicts Arthur Hayes

Arthur Hayes, co-founder and former CEO of the cryptocurrency exchange BitMEX, took to X to provide a detailed analysis of the US economic landscape and its potential effects on the crypto market. With a reputation for incisive commentary and a deep understanding of both traditional and digital finance, Hayes’s insights are closely watched by industry participants.

Why The Crypto Bull Run Will Return As Soon As Monday

In a post, Hayes noted a significant increase in the Treasury General Account (TGA), which he attributed to an influx of approximately $200 billion from tax receipts. “As expected tax receipts added roughly $200bn to TGA,” Hayes stated, setting the stage for a broader discussion on potential implications for financial markets.

Hayes then shifted focus to upcoming decisions by US Treasury Secretary Janet Yellen concerning the management of the TGA. With a tone mixing respect and sternness, he outlined several potential scenarios, each with profound implications for market liquidity. “Forget about the May Fed meeting. The 2Q24 refunding announcement comes out next week. What games will [Janet] Yellen play, here are some options,” Hayes remarked.

Firstly, he suggested that by “stopping issuing treasuries by running down the TGA to zero,” Yellen could unleash a $1 trillion liquidity injection into the economy. This strategy would involve using the accumulated funds in the TGA for federal spending without issuing new debt, thus directly boosting the money supply.

Secondly, Hayes speculated about “shifting more borrowing to T-bills, which removes money from RRP,” resulting in a $400 billion liquidity boost. This maneuver would involve the Treasury opting for shorter-duration debt instruments, which typically carry lower interest rates but increase the turnover of government securities. This could potentially draw funds away from the overnight reverse repo market, where financial institutions temporarily park their excess cash.

Combining these two approaches, according to Hayes, could lead to “a $1.4 trillion injection of liquidity” if Yellen decides to both cease long-term bond issuance and ramp up the issuance of bills while depleting both TGA and RRP accounts. Hayes emphatically noted, “The Fed is irrelevant, Yellen is a bad bitch, you best respect her.” This statement underscores his belief in the significant impact of Treasury actions over Federal Reserve policies in the current economic setup.

Hayes predicted that these actions could lead to a bullish response in the stock market and, more crucially, a rapid acceleration in the crypto market. “If any of these three options happen, expect a rally in stonks and most importantly a re-acceleration of the crypto bull market,” he explained.

The implications of such fiscal strategies are significant. Increased liquidity typically diminishes the appeal of low-yield investments like bonds and encourages the pursuit of higher returns in riskier assets, including equities and cryptocurrencies. Moreover, a shift in market sentiment toward ‘risk-on’ could see substantial capital flows into the crypto space, perceived as a high-growth, albeit volatile, investment frontier.

In conclusion, Hayes’ analysis suggests that the coming week – the refunding announcement comes on Monday, April 29 – could be critical for market watchers. His perspective, drawing from deep financial expertise, points to a possible pivotal shift in US fiscal policy that could ripple through global markets. For crypto investors, these developments could signal important movements, underlining the need for vigilance and readiness to respond to new economic signals.

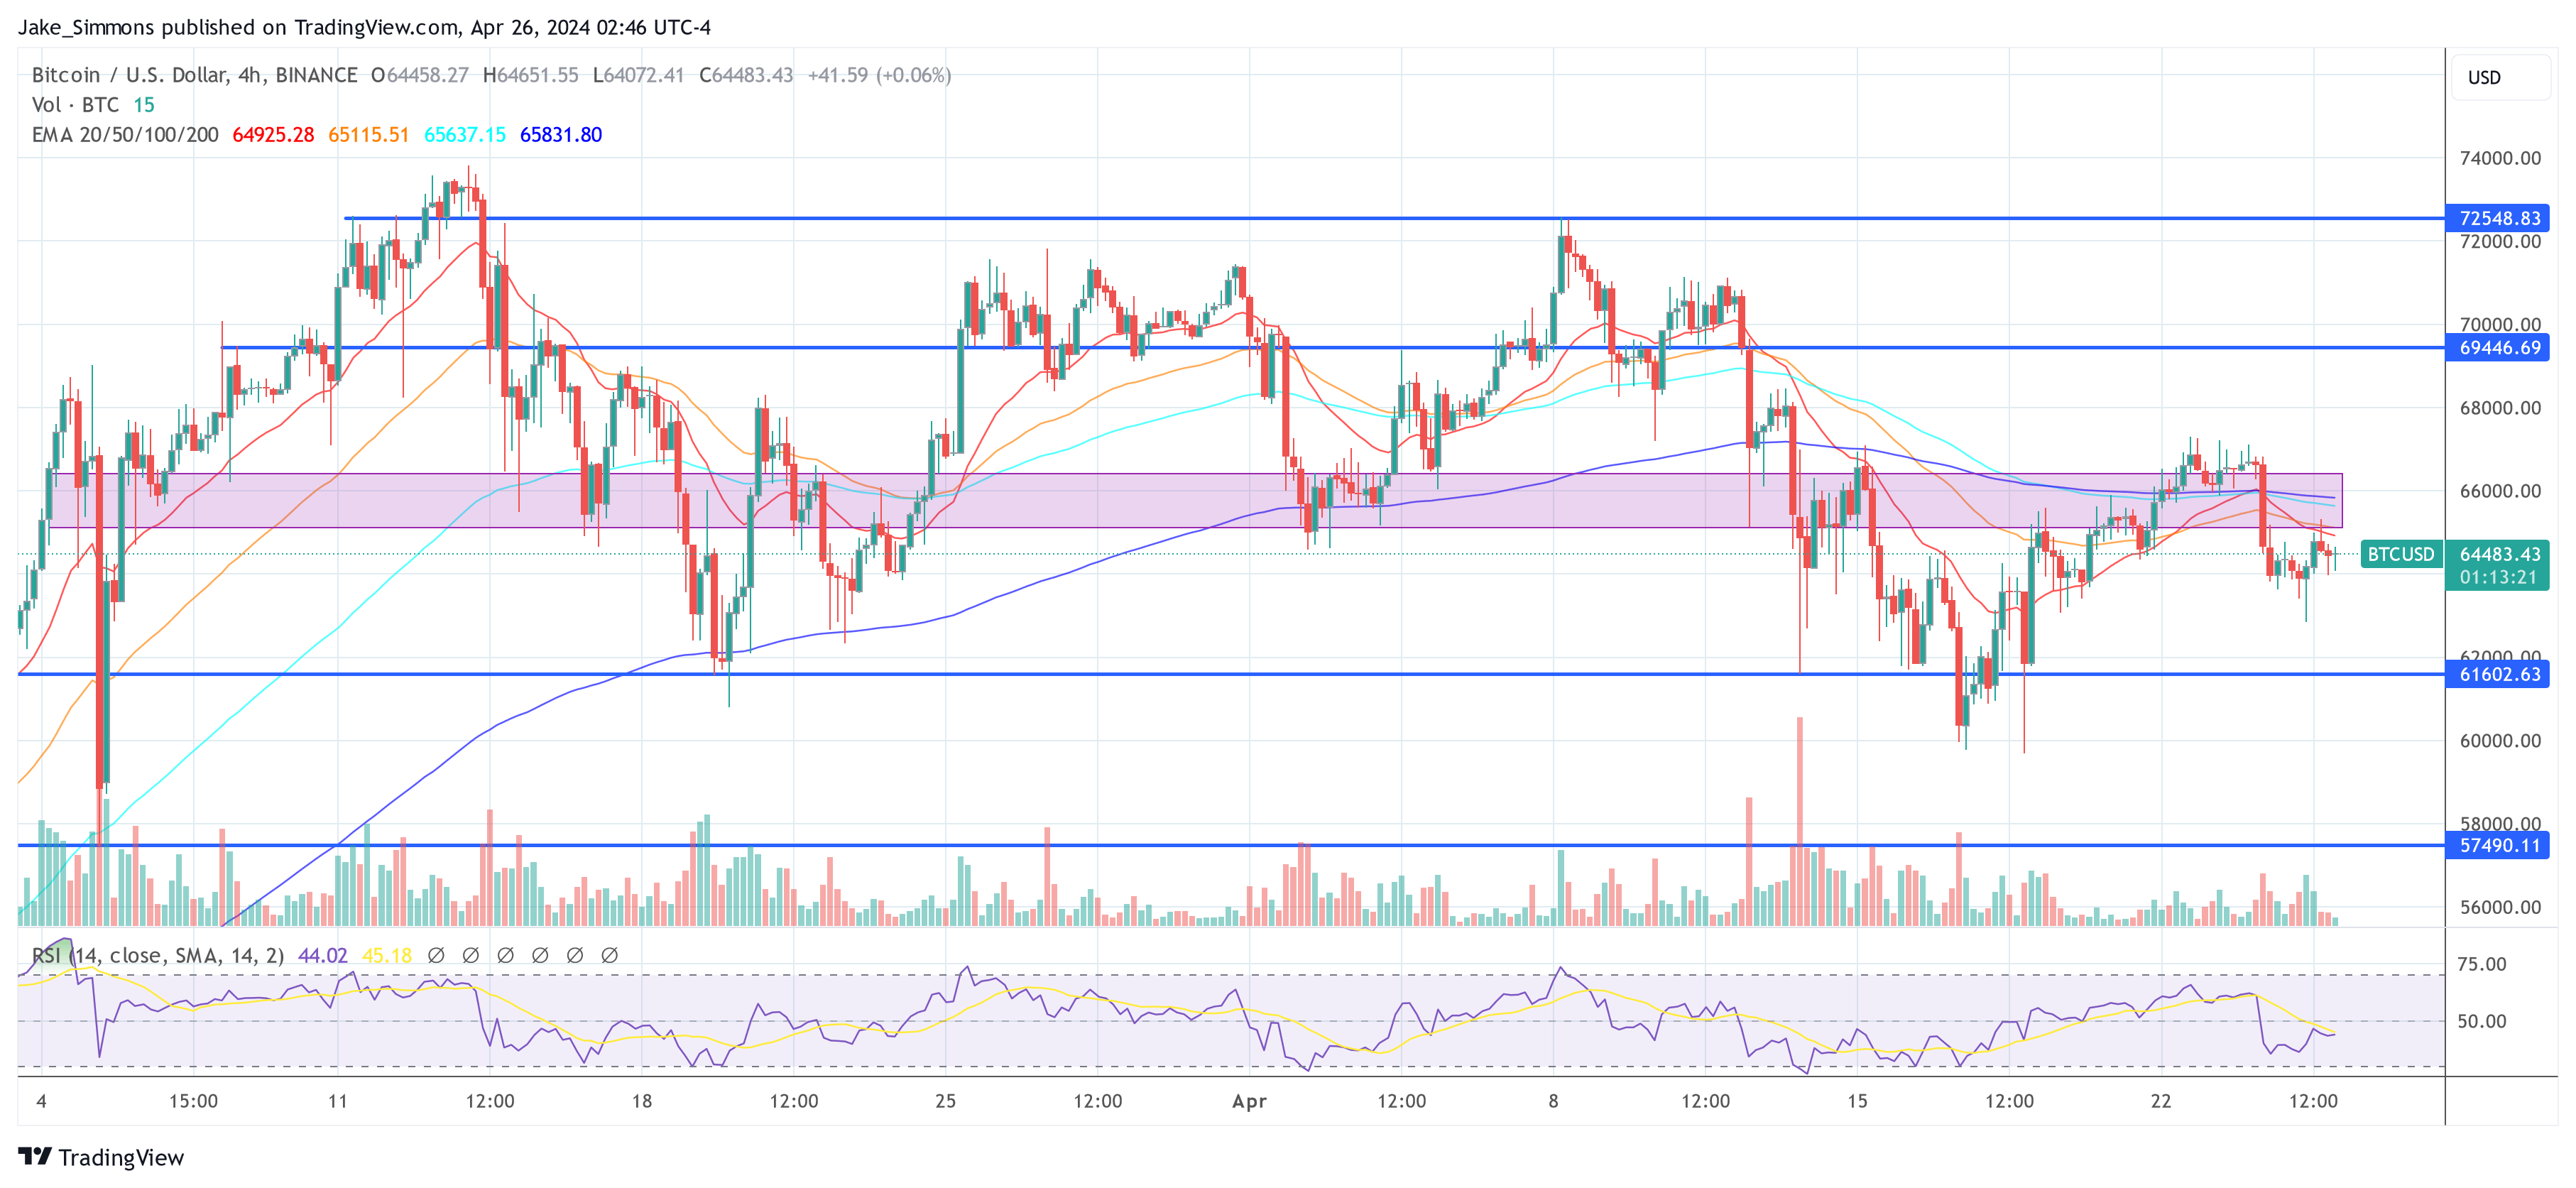
At press time, BTC traded at $64,483.

Bitcoin price

85% Of Altcoins In “Opportunity Zone,” Santiment Reveals

The on-chain analytics firm Santiment has revealed that over 85% of all altcoins in the sector are currently in the historical “opportunity zone.”

MVRV Would Suggest Most Altcoins Are Ready For A Bounce

In a new post on X, Santiment discussed how the altcoin market looks based on their MVRV ratio model. The “Market Value to Realized Value (MVRV) ratio” is a popular on-chain indicator that compares the market cap of Bitcoin against its realized cap.

The market cap here is the usual total valuation of the asset’s circulating supply based on the current spot price. At the same time, the latter is an on-chain capitalization model that calculates the asset’s value by assuming the “true” value of any coin in circulation is the last price at which it is transferred on the blockchain.

Given that the last transaction of any coin would have likely been the last time it changed hands, the price at its time would act as its current cost basis. As such, the realized cap essentially sums up the cost basis of every token in the circulating supply.

Therefore, one way to view the model is as a measure of the total amount of capital the investors have put into the asset. In contrast, the market cap measures the value holders are carrying.

Since the MVRV ratio compares these two models, its value can tell whether Bitcoin investors hold more or less than their total initial investment.

Historically, when investors have been in high profits, tops have become probable to form, as the risk of profit-taking can spike in such periods. On the other hand, a dominance of losses could lead to bottom formations as selling pressure runs out in the market.

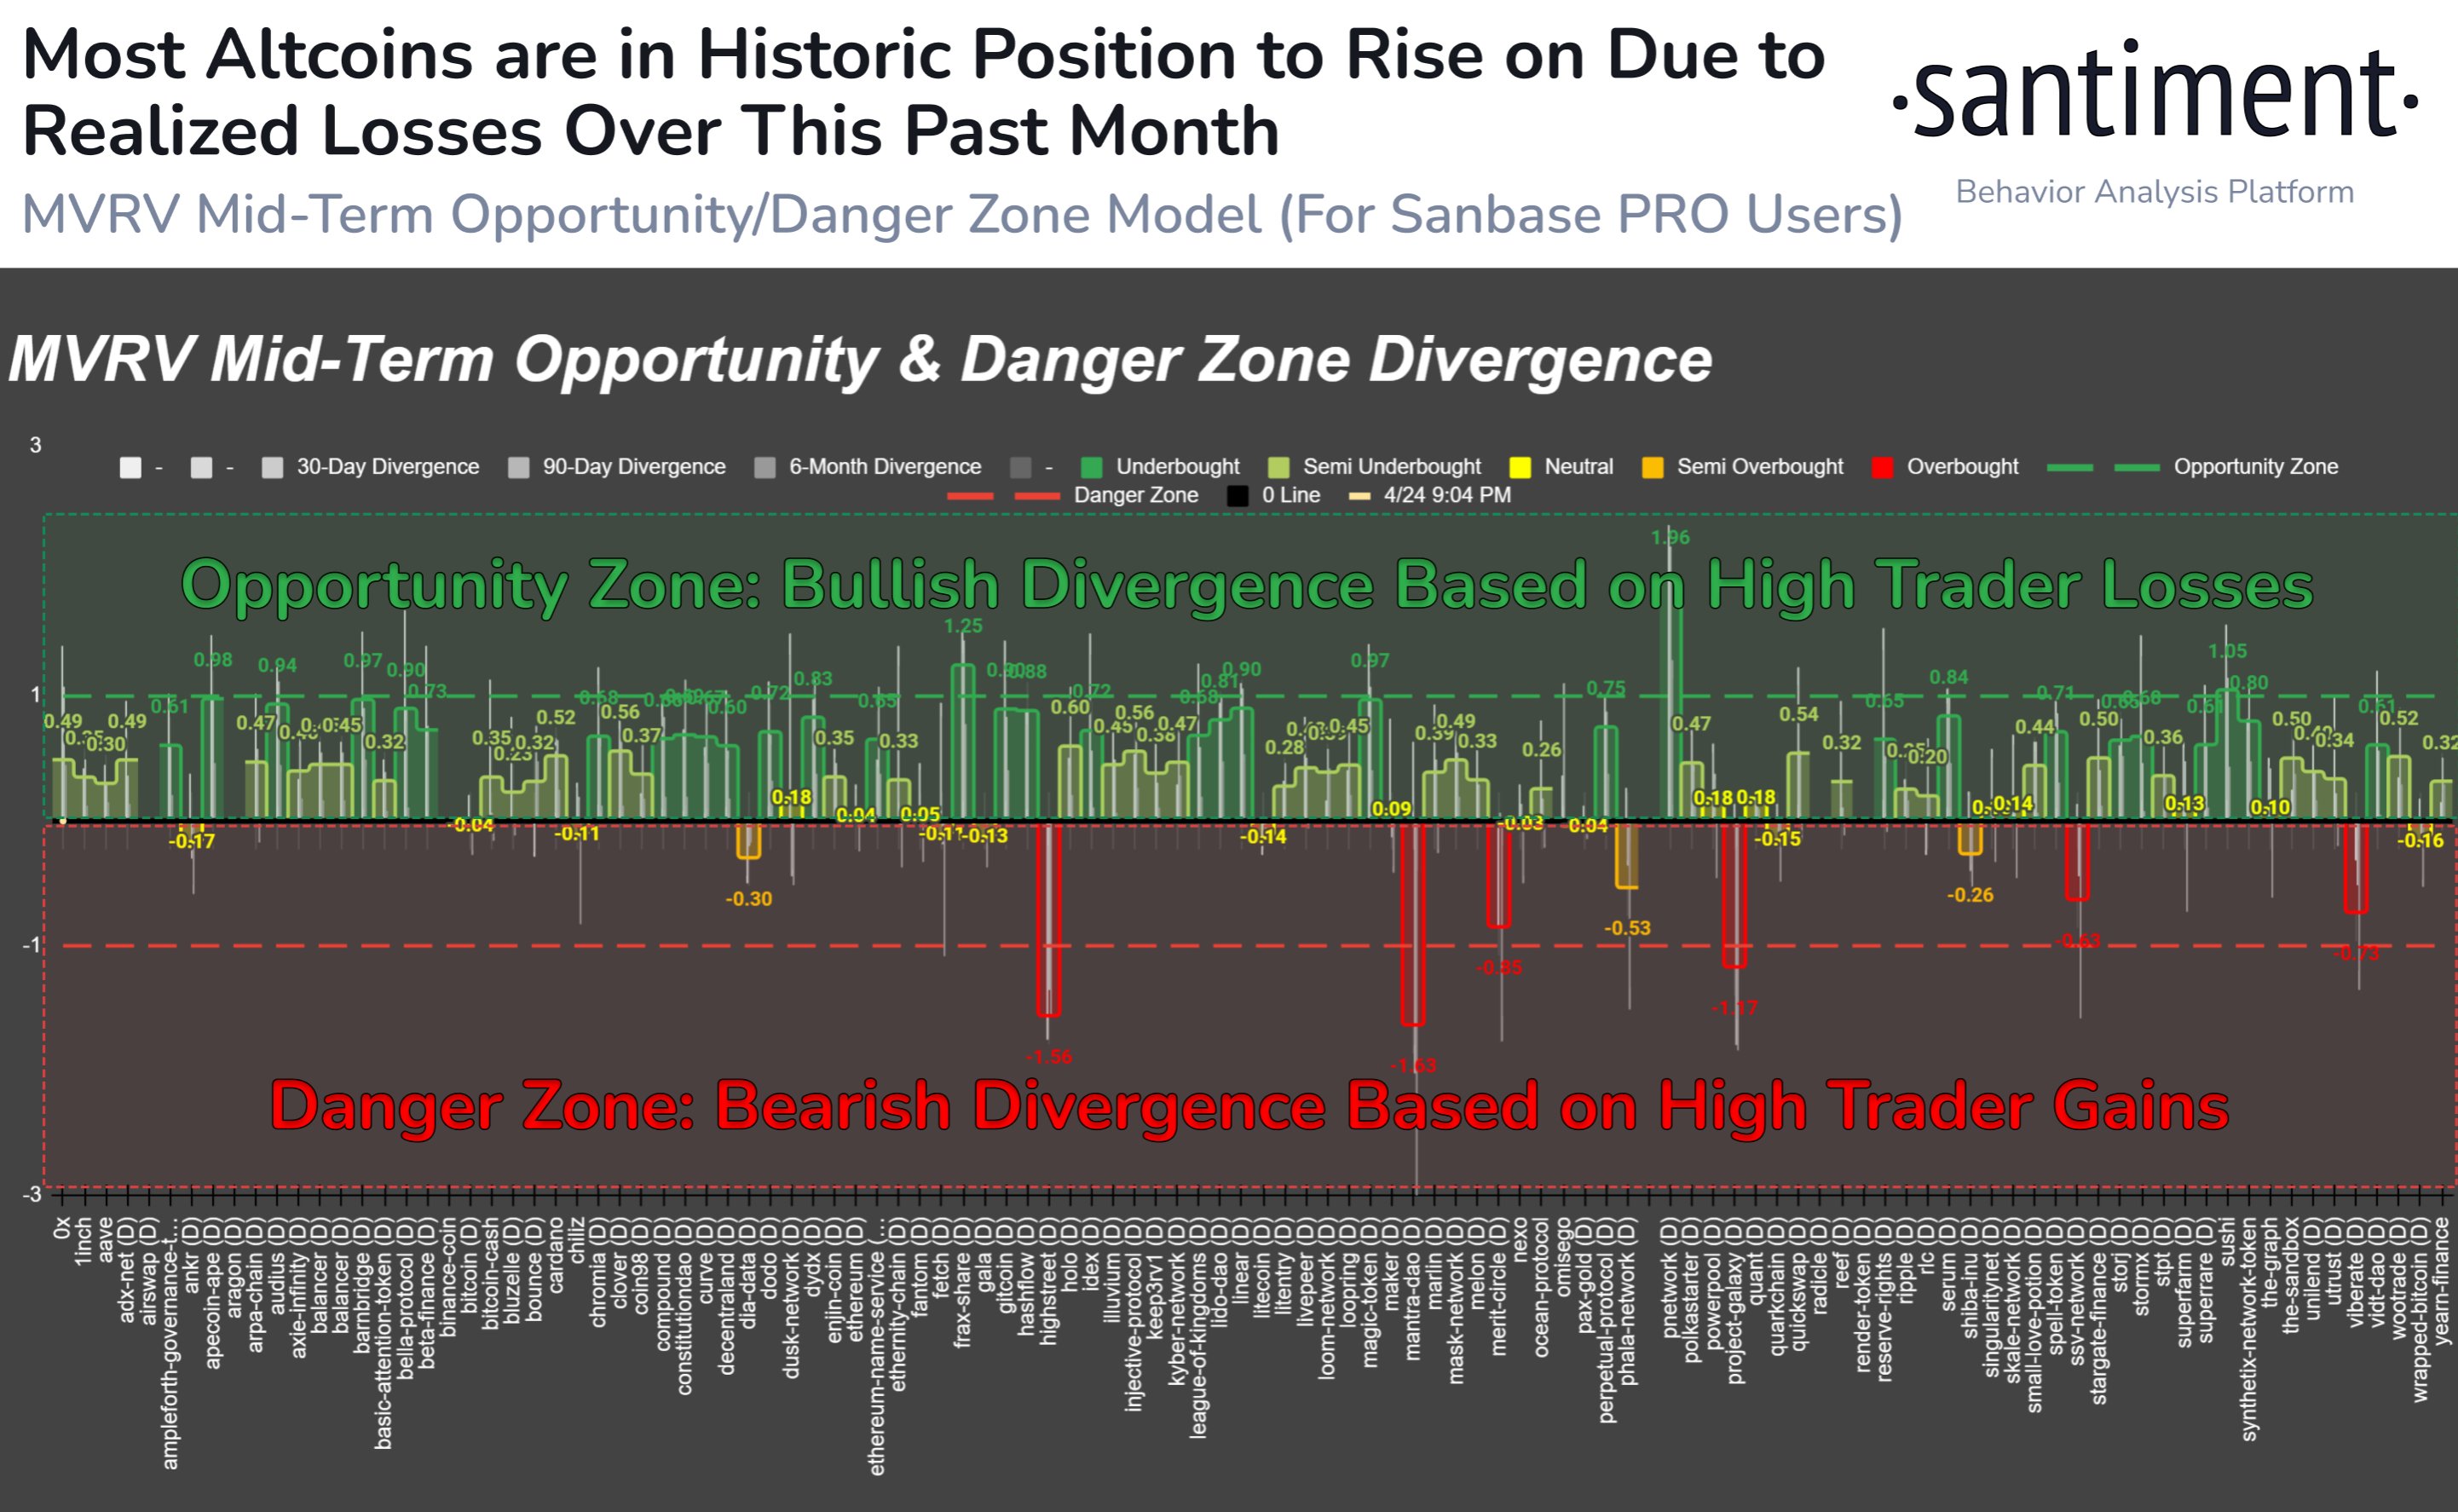
Based on these facts, Santiment has defined an “opportunity” and “danger” zone model for altcoins. The chart below shows how the market currently looks from the perspective of this MVRV model.

Bitcoin MVRV Ratio

Under this model, when the MVRV divergence for any asset on some timeframe is higher than 1, the coin is considered to be inside the bullish opportunity zone. Similarly, if it is less than -1, it suggests it’s in the bearish danger zone.

The chart shows that MVRV divergence for a large part of the market is in the opportunity zone right now. As the analytics firm explains,

Over 85% of assets we track are in a historic opportunity zone when calculating the market value to realized value (MVRV) of wallets’ collective returns over 1-month, 3-month, and 6-month cycles.

Thus, if the model is to go by, now may be the time to go around altcoin shopping.

ETH Price

Ethereum, the largest among the altcoins, has observed a 3% surge over the past week, which has taken its price to $3,150.

BNB Price Chart

Vertex AI Price Forecast: Bitcoin Has 60% Chance Of Hitting $100,000, Key Predictions Unveiled

On-chain analytics firm Spot On Chain’s team of analysts, using Google Cloud’s Vertex artificial intelligence (AI), has conducted an in-depth analysis to forecast the future price of Bitcoin (BTC). 

Their latest report provides valuable insights into the leading cryptocurrency’s short-, medium-, and long-term outlook.

Bitcoin Price Forecasts

According to Spot On Chain’s report, Bitcoin prices are expected to fluctuate between $56,000 and $70,000 during May, June, and July 2024. 

This projected range indicates the potential for market volatility, with a 48% probability assigned to the scenario where BTC prices may dip below $60,000. Moreover, the report advises a cautious approach, acknowledging the possibility of short-term fluctuations or corrections in the price.

Spot On Chain’s analysis reveals a significant movement in the latter half of 2024, with a compelling 63% probability of Bitcoin reaching $100,000. 

This mid-term projection reflects a prevailing bullish sentiment in the market, further fueled by anticipated rate cuts after the Federal Open Market Committee’s (FOMC) December 2023 meeting. 

These rate cuts aim to bring the federal funds rate down to 4.6% and are expected to boost demand for risk-on assets such as stocks and Bitcoin.

Looking ahead to the first half of 2025, Spot On Chain’s modeling indicates a strong probability that Bitcoin will cross the $150,000 threshold. Specifically, a 42% probability is assigned to this scenario, indicating a bullish outlook for Bitcoin’s price trajectory.

What’s more, looking at the entire year of 2025, the probability of Bitcoin exceeding $150,000 rises to an eye-popping 70%. Based on historical data and patterns in previous cycles, Bitcoin reached a new all-time high approximately 6 to 12 months after the Halving event

Price Consolidation On The Horizon?

Crypto analyst Retk Capital has also provided insights into the current Bitcoin price action, shedding light on key resistance levels and the potential for a consolidation phase before an anticipated parabolic upside.

According to Retk Capital’s analysis, Bitcoin has consistently been rejected from the $65,600 resistance level, failing to regain it as a support level. 

This resistance zone has significantly impeded Bitcoin’s upward movement in recent days, as seen on the cryptocurrency’s daily BTC/USD chart below. 

Bitcoin

Retk Capital further highlights that Bitcoin has been witnessing downside wicks into a pool of liquidity at approximately $60,600. This occurrence has been observed over multiple weeks, indicating the presence of buyers in that price range. 

If Bitcoin experiences further downward movement, the analyst believes that there is a possibility that it may approach this area once again. The analyst further notes:

Price dropping without context can be emotionally challenging. However, understanding that this downside is part of the consolation within a technical range-bound structure that will precede Parabolic Upside makes this experience much more comforting.

As of this writing, BTC is trading at $63,900, down nearly 8% over the past two weeks and the same percentage over the past 30 days.

Featured image from Shutterstock, chart from TradingView.com

BNB Smart Chain Shines In Q1: Triple-Digit Surges In Key Metrics

The Binance Smart Chain (BNB Chain), developed by the world’s largest cryptocurrency exchange by trading volume, Binance, experienced significant growth and performance in the first quarter (Q1) of 2024. 

As highlighted in a recent report by Messari, Binance Smart Chain has surged in market cap, revenue, average daily active addresses, decentralized finance (DeFi), total value locked (TVL), and average daily decentralized exchange (DEX) volume. 

BNB Outperforms Bitcoin In Q1 2024

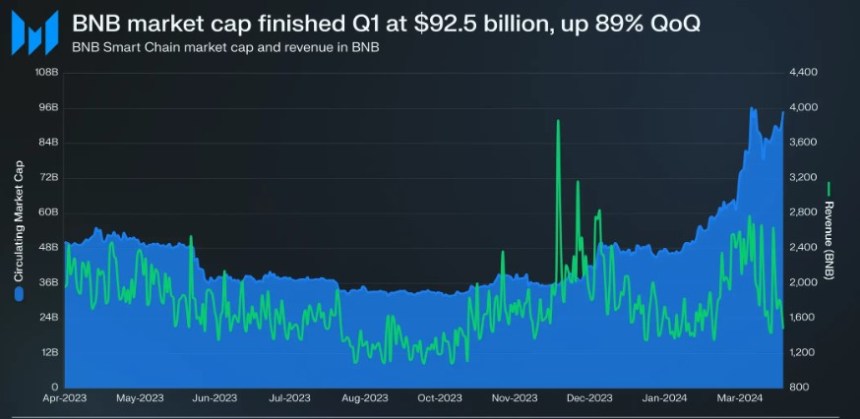
During Q1 2024, BNB Smart Chain demonstrated notable market cap growth, soaring by 89% quarter-over-quarter (QoQ). It reached a market cap of $92.5 billion, securing the third position among all tokens, excluding stablecoins. Only Ethereum (ETH) and Bitcoin (BTC) surpassed BNB in market cap. 

Interestingly, the report notes that BNB’s performance surpassed that of Bitcoin, which saw a 65% increase in outstanding market capitalization over the same period.

BNB

Revenue generated by the Binance Smart Chain experienced a substantial boost in Q1. The network collected $66.8 million in revenue, marking a 70% QoQ increase. 

According to Messari, this surge in revenue was primarily driven by the appreciation of BNB’s price. Notably, Q1’s revenue exceeded that of any quarter in 2023. DeFi transactions, particularly gas fees, were significant in revenue contributions, accounting for 46% of the total.

Despite a slight decrease in average daily transactions, BNB Smart Chain experienced a 27% year-over-year (YoY) increase, demonstrating sustained growth in network activity. 

Average daily active addresses surged by 26% QoQ, reaching 1.3 million. Several protocols on the BNB Smart Chain witnessed increased transaction volumes and active addresses, with Tether’s USDT and decentralized exchange (DEX) PancakeSwap leading the way.

DEX Trading Volume Explodes

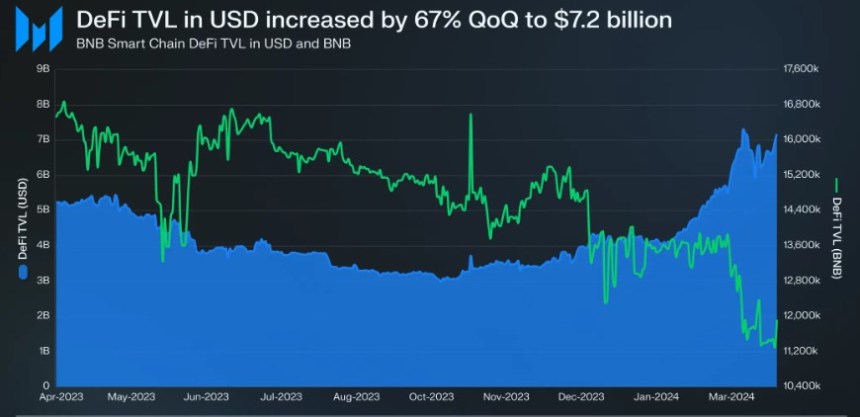
BNB Smart Chain’s DeFi TVL, denominated in USD, experienced a 67% QoQ surge, reaching $7.2 billion. This growth positioned the Binance Smart Chain as the third-highest chain regarding DeFi TVL, denominated in USD. 

However, when denominated in BNB, TVL decreased slightly by 12%. This indicates that the surge in USD value was primarily driven by BNB price appreciation and capital inflows.

BNB

Decentralized exchanges on the Binance Smart Chain witnessed a staggering 193% QoQ increase in average daily trading volume. The total DEX volume for Q1 reached $1.1 billion, with PancakeSwap emerging as the dominant DEX on the platform. 

PancakeSwap’s average daily DEX volume surged by 140% QoQ, surpassing other competitors and solidifying its position as the preferred DEX on the BNB Smart Chain.

Overall, Binance Smart Chain’s performance in the first quarter of 2024 showed significant growth across various parameters, reinforcing its position as an important blockchain platform. 

BNB

The exchange’s native token, Binance Coin, is currently trading at $607, reflecting a 2% price increase over the past 24 hours and a 10% increase over the past 7 days. 

These positive price movements bring the token closer to its all-time high of $686, reached in May 2021.

Featured image from Shutterstock, chart from TradingView.com

Cardano Crisis Or Comeback? ADA’s Key Metric Hits Low, What This Means For Investors

Data from analytics platform IntoTheBlock have illuminated a troubling trend within the Cardano (ADA) network, showing a significant dip in ‘profitability’ for its holders.

While cryptocurrencies like Bitcoin and TRX show a high percentage of holders in profit, Cardano stands in stark contrast, with only 35% of its holders currently seeing gains.

This insight into the Cardano ecosystem reveals deeper challenges, as many of ADA’s transactions now appear to be at a loss.

Details Into ADA Investors Profitability

The report’s specifics indicate that out of 1.59 million addresses holding 14.07 billion ADA, a substantial amount of these tokens were acquired at higher price points that are not profitable under current market conditions.

In particular, 2.73 million addresses are underwater, holding 20.07 billion ADA purchased at price levels between $0.5975 and $0.7265. This significant segment of loss-bearing investments places downward pressure on ADA’s market price, contributing to recent price volatility.

Cardano (ADA) holders metric.

Despite the immediate bearish outlook, ADA has shown resilience with a weekly gain of 4.2%, bringing its price to $0.4661 at the time of writing. This slight recovery suggests that while short-term pressures are evident, investor confidence remains in the token’s fundamentals.

Notably, the crypto community is buzzing about potential future gains for ADA based on historical data and technical analysis. Prominent crypto analyst Ali has pointed out that ADA’s Market Value to Realized Value (MVRV) ratio is lower than -22%, indicating that the asset is significantly undervalued.

This situation is similar to June 2023, following which ADA experienced a substantial 75% increase in value. Ali forecasts a potential surge in ADA’s price to $0.80 from these past trends, which would mark a significant recovery and the highest value for the token in over a year.

Cardano Technical Analysis Supports Bullish Predictions

Another analyst, Trend Rider on X, further supported the optimistic projections for ADA and noted that Cardano’s technical indicators signal a potential bull run.

According to Trend Rider, ADA’s Relative Strength Index (RSI) and Simple Moving Average (SMA) crossovers form a pattern that mirrors previous setups, leading to major price increases. For instance, a similar formation was observed before ADA’s monumental rise from $0.05 to $3.00.

This confluence of technical and market value analyses presents a compelling case for Cardano’s potential turnaround. While current holder profitability is low, the technical indicators and historical performance suggest that ADA could be on the cusp of a significant upward trajectory.

ADA price chart on TradingView

Featured image from Unsplash, Chart from TradingView

Is Bitcoin’s Rally Over? Leverage Drops As Halving Highs Fade: Report

Recent trends in the crypto market have indicated a notable shift in trader behavior, particularly among those investing in Bitcoin.

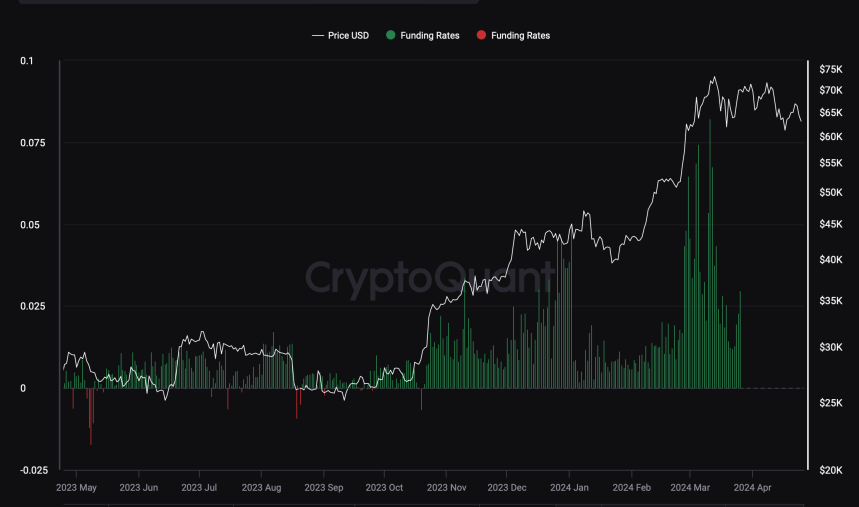
Using data from CryptoQuant, Bloomberg has revealed that the Bitcoin funding rate—the cost for traders to open long positions in Bitcoin’s perpetual futures—has turned negative for the first time since October 2023.

Bitcoin Funding Rates

This change suggests a “cooling interest” in leveraging bullish bets on Bitcoin, coinciding with the fading impact of major market drivers.

Bitcoin Market Dynamics Post-Halving

The decline in Bitcoin’s funding rate correlates with a reduction in net inflows to US spot Bitcoin Exchange-Traded Funds (ETFs), which previously pushed the cryptocurrency to record highs.

Despite the anticipation surrounding the Bitcoin Halving—an event reducing the reward for mining new blocks and theoretically lessening the supply of new coins—the price impact has been surprisingly muted.

According to Bloomberg, this subdued response has compounded the effects of broader economic factors, such as geopolitical tensions and changes in monetary policy expectations, leading to increased risk aversion among investors.

Following the latest Bitcoin halving, the market has not seen the bullish surge many expected. Instead, Bitcoin has only seen a correction of over 10%, from its all-time high (ATH) in March with prices stabilizing in the $63,000 region, at the time of writing.

Bitcoin (BTC) price chart on TradingView

As CryptoQuant’s Head of Research Julio Moreno pointed out, the recent downturn in Bitcoin’s funding rates to below zero underscores a “decreased eagerness” among traders to take long positions.

According to Bloomberg, this trend is supported by a significant drop in daily inflows to US spot Bitcoin ETFs and a reduction in open interest in Bitcoin futures at the Chicago Mercantile Exchange (CME), which indicates a broader cooling of enthusiasm for crypto investments.

In a Bloomberg report, K33 Research analyst Vetle Lunde noted that the “current streak of neutral-to-below-neutral funding rates is unusual,” suggesting that the market might be entering a price-consolidation phase.

Notably, this period of reduced leverage activity could potentially lead to further price stabilization, but it also raises questions about the near-term prospects for Bitcoin’s recovery.

Adjustments In Mining Difficulty And Market Implications

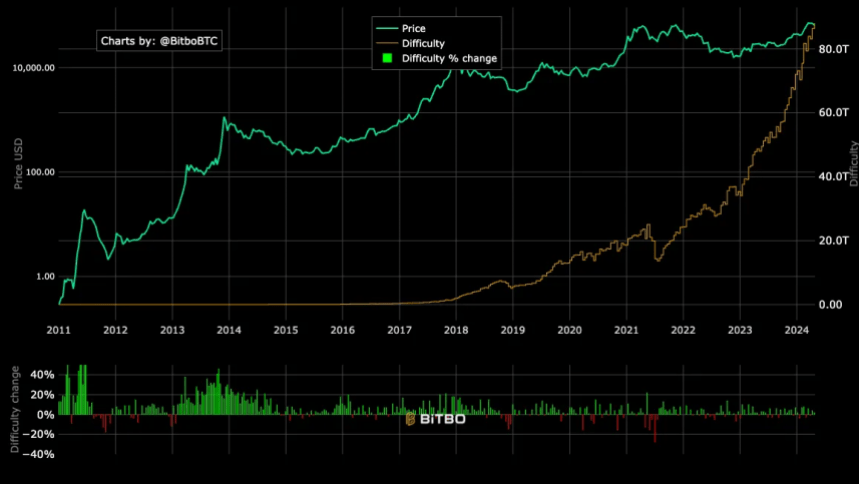
Interestingly, alongside these market adjustments, Bitcoin’s mining difficulty has increased for the first time immediately following the fourth halving.

The difficulty adjustment, which occurs every 2016 block, increased by 2%, reaching a new high of 88.1 trillion, according to Bitbo data.

Bitcoin Mining Difficulty History Chart.

This adjustment contradicts past trends where the difficulty typically decreased post-halving due to reduced profitability pushing less efficient miners out of the market.

This anomaly in mining difficulty suggests that despite lower rewards post-Halving, miners remain active, possibly buoyed by more efficient mining technologies or strategic shifts within mining operations.

This resilience in mining activity could help sustain the network’s security and processing power. Still, it reflects the complexities of predicting Bitcoin’s market dynamics solely based on historical halving outcomes.

Featured image from Unsplash, Chart from TradingView

SEC Anticipated To Reject Spot Ethereum ETFs In Upcoming Decision, ETH Price Takes 5% Hit

Over the past 24 hours, Ethereum (ETH), the second-largest cryptocurrency by market capitalization, has experienced a significant 5% price drop. This drop comes amid growing speculation that the highly anticipated Ethereum ETFs will likely be rejected by the US Securities and Exchange Commission (SEC) in the upcoming May deadline.

US Bitcoin ETF Issuers Brace For SEC’s Expected Denial

According to a recent Reuters report, various US Bitcoin ETF issuers and firms anticipate the SEC’s denial of their applications to launch ETFs tied to the price of ETH. 

These expectations have been fueled by “discouraging meetings” between the applicants and the regulatory agency in recent weeks, as disclosed by four individuals familiar with the matter.

Prominent investment firms such as VanEck, ARK Investment Management, and seven other issuers have submitted filings with the SEC to list ETFs that would track the spot price of Ethereum. 

As the first in line, VanEck’s and ARK’s applications are subject to the SEC’s decisions by May 23 and May 24, respectively.

The sources involved in the meetings between Bitcoin ETF issuers and the SEC have reported that the discussions have been primarily “one-sided,” with agency staff not engaging in substantive details about the proposed products. 

This starkly contrasts the intensive and detailed discussions between issuers and the agency before the SEC’s landmark approval of spot Bitcoin ETFs in January. 

The issuers argued during the meetings that the approval of spot Bitcoin ETFs and Ethereum futures-based ETFs by the SEC in October set a precedent for the spot ETH products. They also made efforts to address potential regulatory concerns. 

Despite their arguments, the report notes that the SEC staff did not clarify specific concerns or engage in meaningful dialogue, further indicating a possible denial of the requests.

Setback For Crypto Industry

If these expectations materialize, it would be a setback for the cryptocurrency industry, which had hoped that the approval of spot Bitcoin ETFs would pave the way for similar products and contribute to the mainstream adoption of cryptocurrencies. 

According to Todd Rosenbluth, head of ETF analysis at data firm VettaFi, the likely delay in approval or rejection until later in 2024 or beyond has left the regulatory landscape uncertain.

While some issuers have expressed their intention to submit additional disclosure paperwork to continue the conversation with the SEC, the overall sentiment indicates a growing belief that the applications will be rejected.

VanEck CEO Jan van Eck has already stated that the company’s application will likely be rejected, while ARK Investment Management has yet to comment.

Rejected Ethereum ETFs Could Spark Potential Court Battles

Several applicants expect the SEC to cite broader issues, such as the nature and depth of statistical data on the underlying ETH market, as reasons for their decision in the event of ETF rejections. 

Matt Hougan, chief investment officer at Bitwise Asset Management, which has filed for a spot in Ethereum ETF, believes that the SEC may require more time to observe Ethereum futures and gather additional data.

Industry insiders further speculate that rejecting Ethereum ETFs could potentially lead to legal action, with one source suggesting that the courts may get involved before Ethereum ETFs eventually become a reality.

The anticipated rejection has already influenced the price of Ethereum, with Hong Fang, president of the crypto exchange OKX, stating that the cryptocurrency is experiencing downward pressure as market participants factor in the likelihood of a negative outcome.

Ethereum ETFs

Currently, ETH is trading at $3,100, further highlighting the cryptocurrency’s persistent downtrend over broader time frames. Over the past fourteen and thirty days, the token has experienced significant declines of 12% and 14%, respectively.

Featured image from Shutterstock, chart from TradingView.com