
Issues such as community discontent, farm accounts and restrictive criteria have plagued recent airdrops.
Cryptocurrency Financial News
Issues such as community discontent, farm accounts and restrictive criteria have plagued recent airdrops.
Crypto analyst Ali Martinez has revealed that it may still be an excellent time to accumulate Bitcoin. This comes amidst the flagship crypto’s recent price recovery, with the crypto token skyrocketing above $64,000.
Martinez mentioned in an X (formerly Twitter) post that Bitcoin’s Market Value to Realized Value (MVRV) 90-day ratio indicates that it is still in a “prime buy zone” despite its recent price surge from $57,000 to $64,000. The MVRV is a metric used to determine whether a crypto token is undervalued or overvalued.
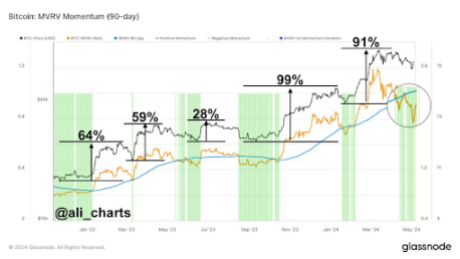
Based on Martinez’s findings, Bitcoin looks to be currently undervalued, which presents a good opportunity to accumulate the crypto token. The analyst’s revelation undoubtedly provides reassurance for those who failed to buy the dip and are looking for a perfect entry to invest in Bitcoin.
Interestingly, Bitcoin whales didn’t waste time accumulating during Bitcoin’s recent decline, as Bitcoinist reported that these investors bought 47,500 BTC ($2.8 billion) between May 2 and 3. However, the MVRV ratio being at that level suggests that many of these whales are investors adding to their positions, meaning that significant buying pressure shouldn’t be expected anytime soon.
Crypto analyst Michaël van de Poppe also recently suggested that Bitcoin is still undervalued. He noted that the crypto token is back above $60,000, and retail isn’t here yet. He mentioned in another X post that these retail investors won’t return until the summer, which means that everyone currently positioning themselves is still early.
Crypto analyst Mikybull Crypto recently hinted that Bitcoin is almost ready for another parabolic rally. He stated that Bitcoin’s local bottom is in considering that the “next liquidity grab interest is above.” He added that Bitcoin will first “clear out the $67,000 level and consolidate in preparation for the $73,000 level.
Related Reading: Fantom Revival: Crypto Analyst Predicts A Jump To $1.2 For FTM Price
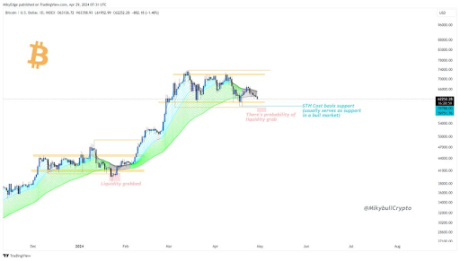
Meanwhile, the analyst revealed in another X post that Bitcoin has “finally experienced a MACD (Moving Average Convergence/Divergence) bullish cross” on the daily chart, just like it did in January 2024, which led to the crypto token rising to as high as $73,000 in March. According to Mikybull Crypto, Bitcoin reclaiming above the 50-day Moving Average will “further confirm the bullish continuation.”
For those looking to long Bitcoin, Mikybull Crypto remarked that the $64,000 range is an “ideal zone” to do so. He predicts that Bitcoin might clear out the CME gap between $62,580 and $64,105 before consolidating at around $64,000.
At the time of writing, Bitcoin is trading at around $65,300, up over 2% in the last 24 hours, according to data from CoinMarketCap.
In a recent report by Bloomberg, it has been revealed that more than 90% of stablecoin transaction volumes do not originate from genuine users, according to a new metric co-developed by Visa.
Visa and Allium Labs have created a dashboard designed to filter out transactions initiated by bots and large-scale traders to isolate those made by real individuals. Out of approximately $2.2 trillion in total transactions recorded in April, a mere $149 billion was identified as “organic payments activity” by Visa.
The data challenges the optimistic outlook of stablecoin proponents who believe these tokens can transform the $150 trillion payments industry.
Fintech giants such as PayPal Inc. and Stripe Inc. have been exploring stablecoins, with Stripe co-founder John Collison expressing bullishness on the tokens due to “technical improvements.”
Pranav Sood, the executive general manager for EMEA at payments platform Airwallex, commented on the findings: “It says that stablecoins are still in a very nascent moment in their evolution as a payment instrument.”
Sood emphasized the need to focus on increasing existing payment infrastructure in the short and mid-term while acknowledging the long-term potential of stablecoins.
Accurately tracking crypto activity’s “real” value using blockchain data has always been challenging. Glassnode, a data provider, estimates that the record $3 trillion assigned to digital tokens at the bull market’s peak in 2021 was closer to $875 billion.
According to Bloomberg, the nature of stablecoin transactions often leads to double-counting, depending on the platform users employ for fund transfers. For example, converting $100 of Circle’s USDC stablecoin to PayPal’s PYUSD on the decentralized exchange (DEX) Uniswap would result in $200 of total stablecoin volume being recorded on-chain.
Visa, which processed over $12 trillion the previous year, could suffer if stablecoins gain widespread acceptance as payment.
Interestingly, despite this troubling data, analysts at Bernstein predicted that the total value of all stablecoins in circulation could reach $2.8 trillion by 2028, nearly 18 times their current combined circulation.
While PayPal and Stripe have made strides in adopting stablecoins, Airwallex has observed limited demand for stablecoin-based payment solutions among its customers, primarily due to concerns about “user-friendliness.”
Sood emphasized the significant barrier of overcoming entrenched payment methods, citing the continued use of checks for 40% to 60% of business payments in the United States.
The Bloomberg report sheds light on the dominance of non-genuine user activity in stablecoin transactions. The study underscores the importance of improving existing payment infrastructure and addressing user-friendly concerns to unlock the long-term potential of stablecoins.
Featured image from Shutterstock, chart from TradingView.com
Smart contracts platform Avalanche (AVAX) is generating excitement in the crypto community with a potential breakout signal. Prominent analyst World of Chart has identified a bullish technical pattern that could propel AVAX prices significantly higher in the coming days.
World of Chart points to the presence of a “falling wedge” pattern on AVAX’s price chart. This pattern typically forms during a consolidation phase, with price action confined between two converging trendlines that slope downwards.
Forming Falling Wedge Incase Of Breakout Expecting Upside Continuation Successful Breakout Can Lead Massive Rally In Coming Days#Crypto #Avax pic.twitter.com/YJHJYarrSw
— World Of Charts (@WorldOfCharts1) May 5, 2024
The key aspect of this pattern lies in the diminishing price range within the wedge, suggesting a buildup of buying pressure. A breakout from the upper trendline is often interpreted as a bullish signal, indicating a potential reversal of the downtrend and the start of a price surge.
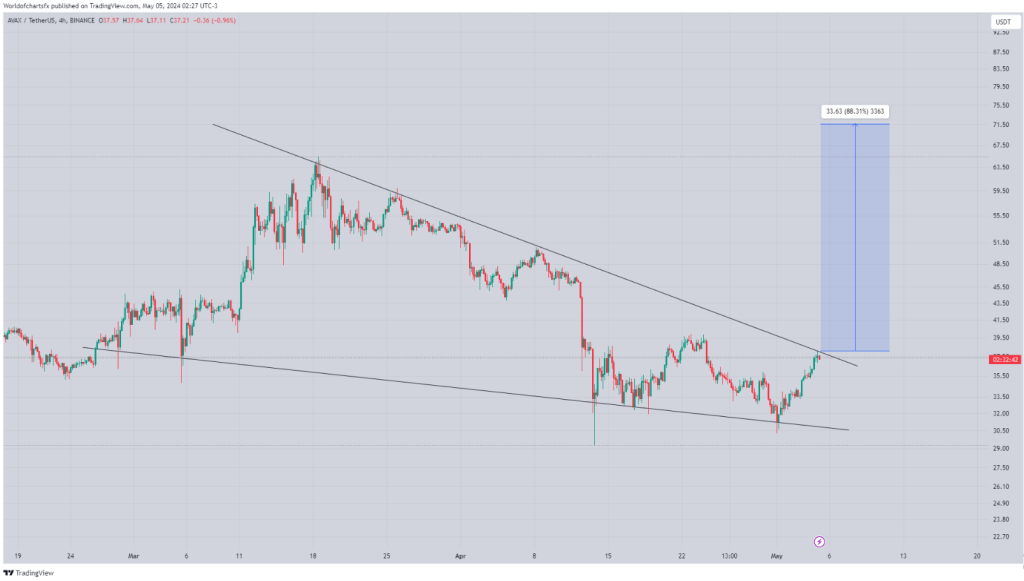
AVAX might see a significant upswing if it is able to break above the upper trendline of the falling wedge, according to World of Chart.
Following the breakout, there may be a substantial price increase as a result of this ascent, which would confirm the bullish formation. The expert draws attention to the possibility of significant momentum and an explosive upward advance.
The possibility of an AVAX breakout has ignited discussions and speculation among crypto investors and traders, particularly those who actively follow technical analysis.
Investor Caution Advised Despite Bullish Outlook
While the potential for a bullish breakout is high, World of Chart emphasizes the inherent volatility and uncertainty of the cryptocurrency market. External factors beyond technical analysis can significantly impact price movements.
Technical Indicators Paint A Positive Picture
Beyond the falling wedge pattern, other technical indicators seem to be adding weight to the bullish narrative for AVAX. The recent price increase of over 16% in a single week suggests a potential shift in investor sentiment.
Additionally, the impressive surge in trading volume signifies heightened market activity and growing investor interest in AVAX.
Eyes On The Prize: Will Avalanche Deliver?
The coming days will be crucial, with all eyes glued to the price action and any signs of a breakout. A successful breakout could lead to significant gains for AVAX holders, while a failed breakout could dampen investor enthusiasm.
Featured image from Pexels, chart from TradingView
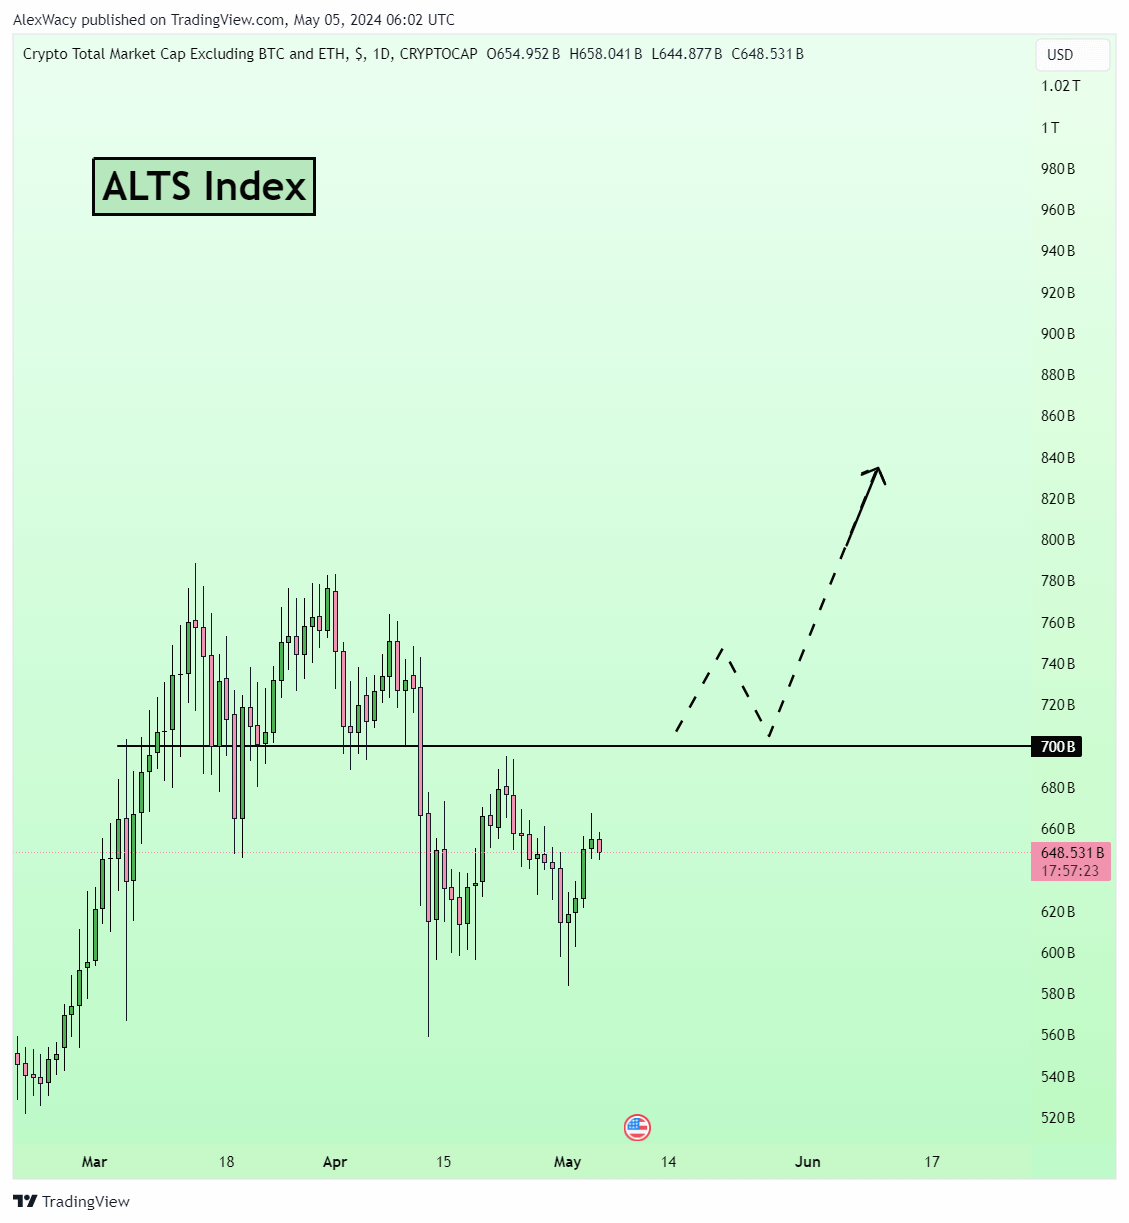
As the crypto market exhibits signs of a burgeoning altseason, crypto analyst Alex Wacy has shared a strategic forecast with his 175,000 followers on X. Wacy predicts a selective yet explosive growth phase for altcoins, emphasizing the critical nature of asset selection and market timing.
Wacy’s recent thread underscores the anticipation of a massive altseason: “Only ~15% of altcoins will bring 10-100x in this hyper growth. Asset selection matters more than ever. One slip-up, and you’re out.” His analysis highlights the potentially selective nature of the upcoming market phase, suggesting significant disparities in performance among altcoins.
Wacy believes the market is currently undervalued and primed for a significant uptick. He suggests that the consolidation of the total altcoin market cap above $700 billion would confirm the bull trend, signaling the onset of altseason. This perspective is rooted in current market behaviors where sentiment remains largely bearish, presenting a contrarian opportunity for growth.
He categorizes the current sentiment into three types of capitulation—price, time, and growth—indicating varied investor behaviors that often precede market recoveries. The prevailing fear of further drops, according to Wacy, will likely clear out weak hands, setting the stage for a supercycle driven by Fear of Missing Out (FOMO) and subsequent strong buying activities.
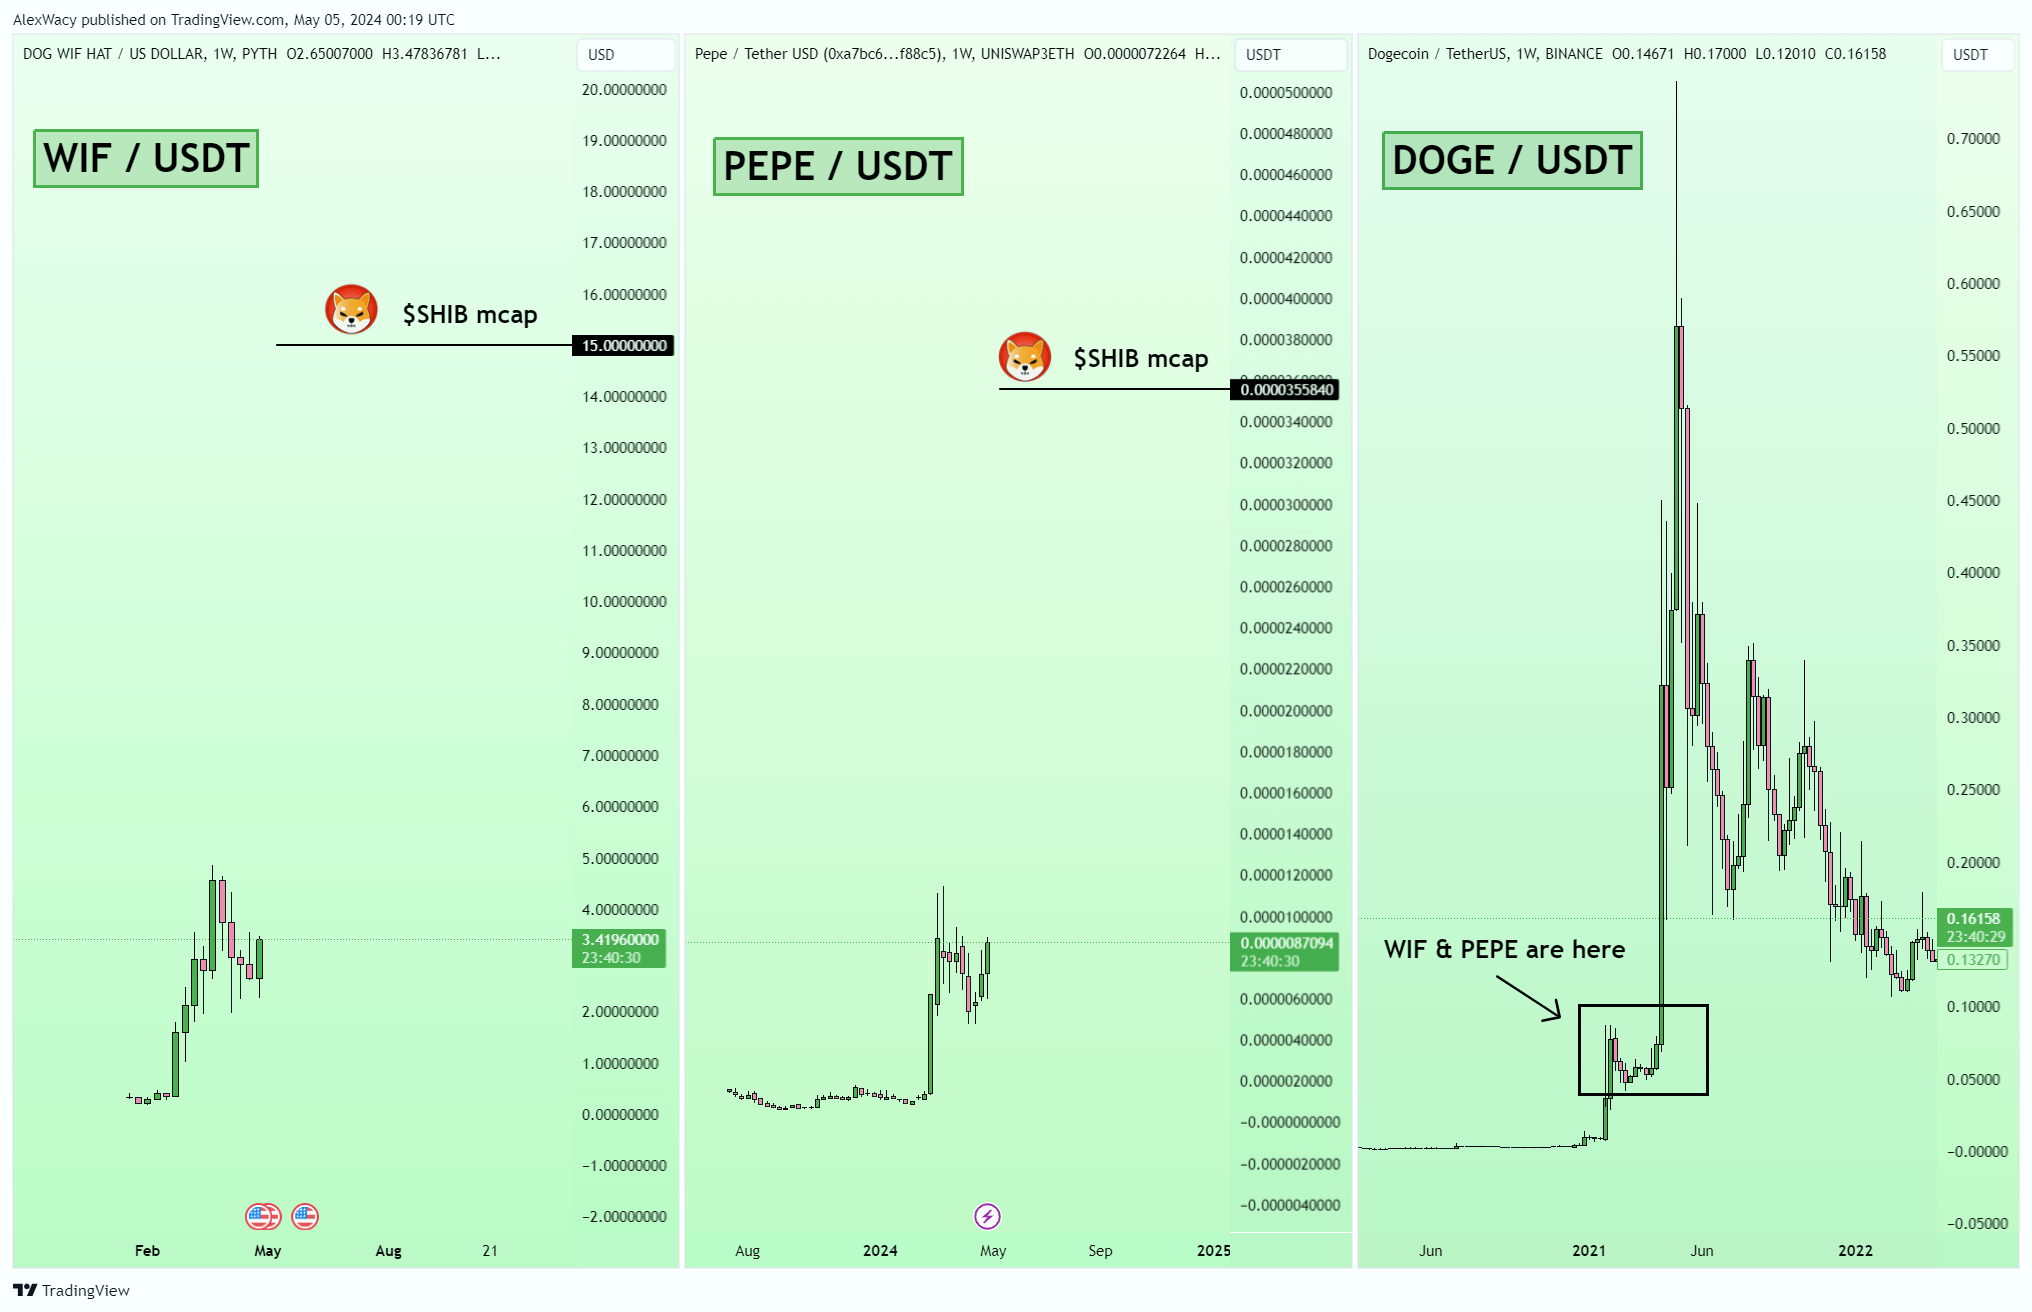
#1 And #2: WIF as well as PEPE are the memecoins highlighted by Wacy as potential early movers in the anticipated altseason. “Look at WIF and PEPE, structurally similar to DOGE during its meteoric rise. These coins have cultivated a community and meme appeal that could very well parallel SHIB’s market cap in the previous cycle,” Wacy asserts. He notes that PEPE appears particularly poised for a breakout, whereas WIF, though currently weaker, has the potential for quick shifts in market sentiment.
#3 Ondo Finance (ONDO): This Real World Asset (RWA) focused coin is characterized by its robust buy support during price dips. Wacy sees ONDO as an undervalued asset with a significant upside. “ONDO has a resilient buy floor; even slight retractions to around $0.64 could offer lucrative entry points ahead of substantial upward trajectories,” he advises. His first target is the $1.62 price zone.
#4 Arweave (AR): Known for its decentralized data storage solutions, Arweave is praised by Wacy for its strong market structure and resilience during downturns. Moreover, Arweave is building AO, a decentralized computer network which can be run from anywhere. “Arweave isn’t just storage; it’s a foundational technology in a decentralized future. A consolidation above $49 would likely be the catalyst for an explosive growth phase,” he predicts.
#5 Echelon (PRIME): Wacy discusses PRIME’s multifaceted ecosystem, which encompasses a trading card game and an AI-powered game, both of which are gaining traction. “Echelon stands at the confluence of gaming and blockchain technology, attracting a broad audience with its innovative gameplay and decentralized features,” he remarks. From a technical analysis perspective, the PRIME price is near a favorable buying zone from $14.97 to $17.5. “Hoping that altcoins are already entering the altseason, would like to see a V-shaped reversal,” Wacy states.
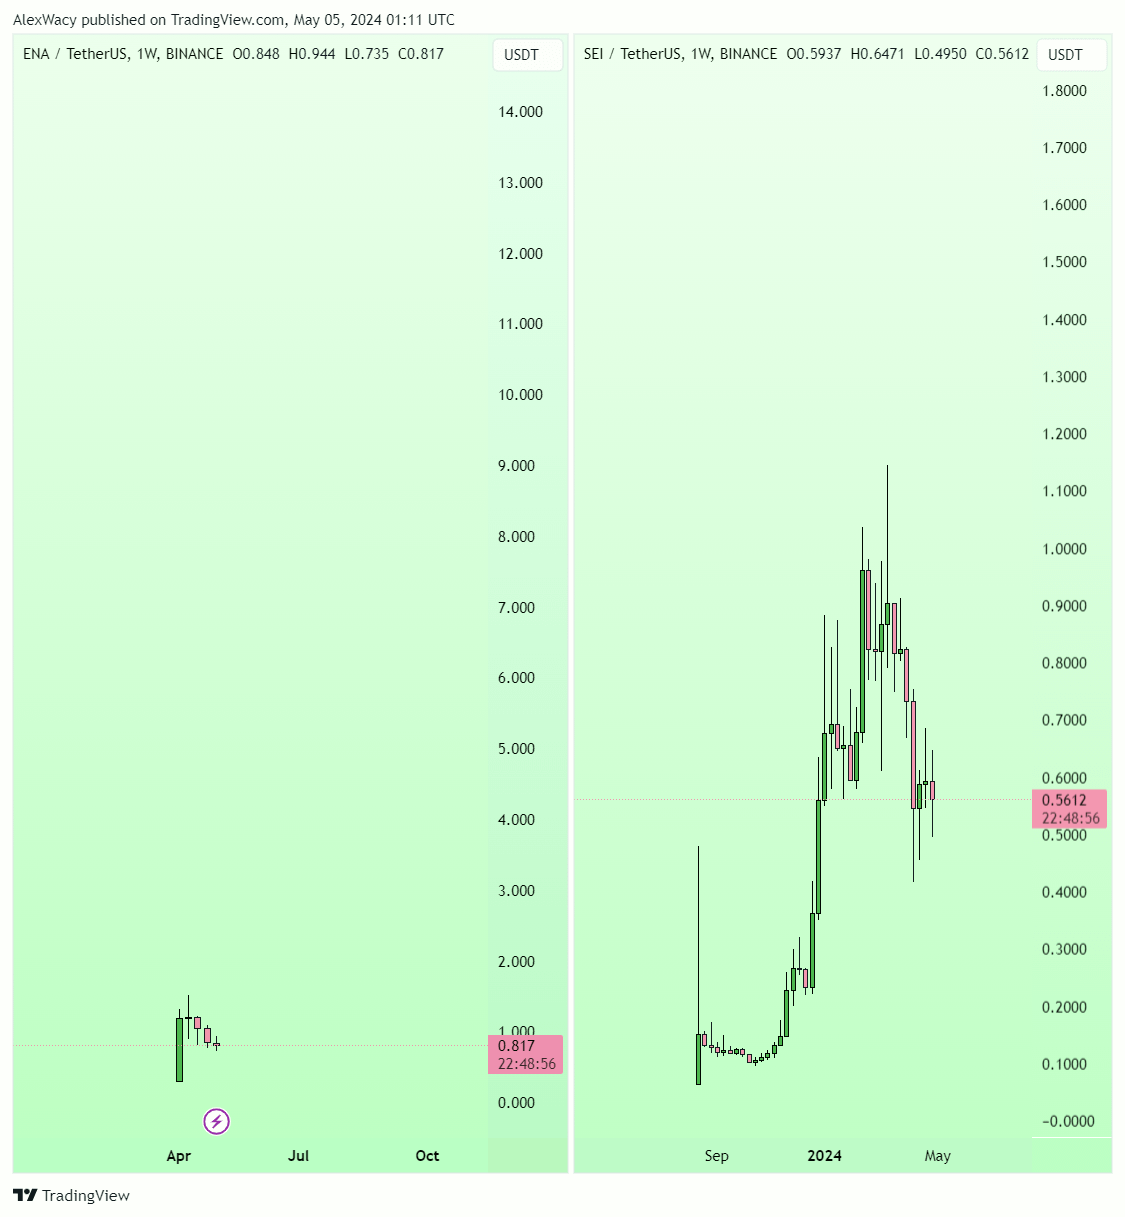
#6 Ethena (ENA): This synthetic dollar protocol offers an alternative to traditional banking and is poised for growth. “Ethena’s pattern on the weekly charts typically precedes major price movements. With the next major unlock event slated for April 2025, the buildup could be substantial,” Wacy explains. He likens ENA’s current price trajectory with the one of SEI.
Strategic Profit-Taking
Wacy also provides strategic advice on profit-taking, anticipating that the altcoin market index, TOTAL3, could ascend to between $2 trillion and $2.3 trillion during the altseason. He suggests considering partial profit-taking once the market reaches approximately $1.6 trillion. His rationale is based on historical patterns where many investors fall prey to greed, resulting in substantial losses.
The analyst further advises preparing a profit-taking strategy in advance, advocating for the reservation of 10-15% of positions for potential further growth beyond initial targets. He warns that the last surge in a growth phase often triggers excessive greed, suggesting that recognizing such signals could be crucial for timely exits before the onset of bear market conditions.
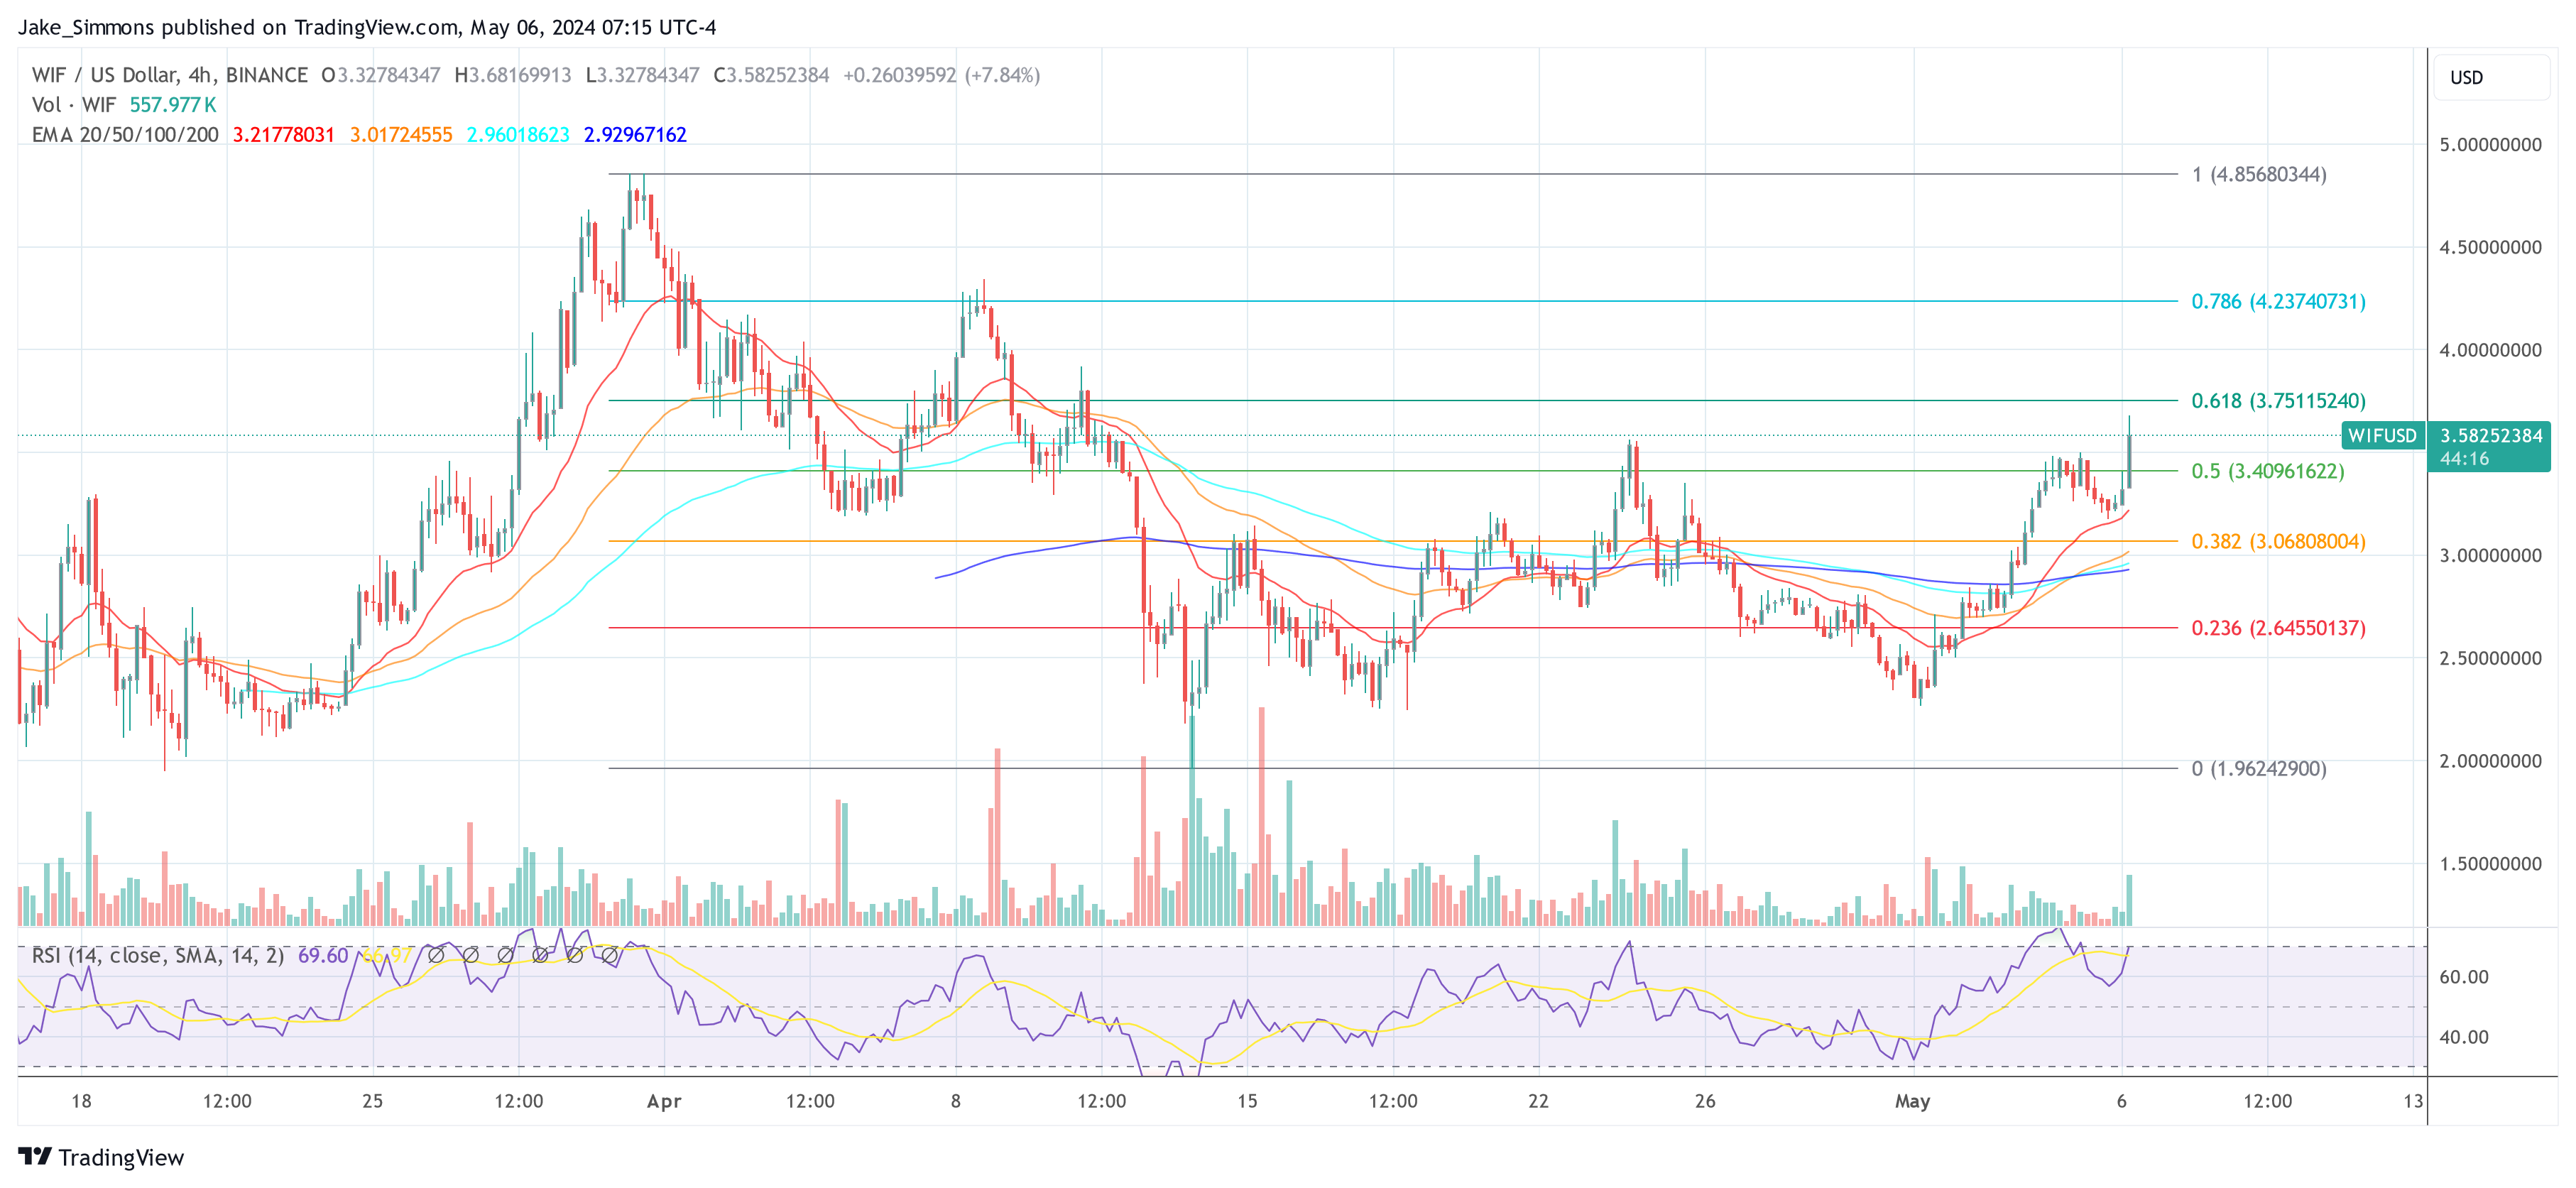
At press time, WIF traded at $3.58.
An Australian Federal Court mostly ruled in favor of Australia’s markets regulator in its case against BPS Financial Pty Ltd (BPS) over its Qoin scheme, on Friday.

The trade agreements between China and Hong Kong could allow mainland investors to access BTC ETF in Hong Kong.
Telegram, the messaging giant, has reached a staggering 900 million users. This surge directly impacts Telegram Open Network (TON), the blockchain designed to work seamlessly within Telegram. TON has seen a remarkable 15% growth in the last week, highlighting its potential to become a mainstream crypto player.

TON price action. Source: Coingecko
The key to TON’s recent success lies in its tight integration with Telegram. Users can ditch the hassle of separate crypto wallets and make transactions directly through Telegram’s native wallet.
This frictionless experience, coupled with TON’s cheap transactions and fee-free USDT transfers, is a major draw for everyday users who might be hesitant to dive into the complexities of traditional crypto exchanges.
Gm
Telegram hits 900M Monthly Active Users, Gm back if you are one of them. pic.twitter.com/B6AlwEK71B
— TON
(@ton_blockchain) May 5, 2024
While TON facilitates everyday transactions, its goals extend further. The Telegram ecosystem thrives on a network of apps and bots that introduce inventive ways to interact with your wallet. A prime example is “farming,” which allows users to participate in decentralized finance (DeFi) activities using TON or other tokens, all within the familiar Telegram interface.
This functionality to “farm” directly within chat windows showcases how TON fosters a deeper integration with cryptocurrencies. It breaks down the barriers between messaging and finance, potentially leading to a more seamless adoption of crypto in our daily digital interactions.
Security Concerns
However, TON’s path to mainstream adoption isn’t paved with roses. The biggest thorn in its side is security. While the integrated wallet offers undeniable convenience for small transactions, security experts raise concerns about its suitability for storing large amounts of cryptocurrency.
Unlike traditional hardware wallets, which are considered the gold standard for secure crypto storage, Telegram’s software wallet might be more susceptible to hacks or breaches. This could be a significant deterrent for users wary of entrusting their hard-earned crypto to a messaging app.
Regulatory Tightrope
Another looming challenge for TON is the ever-evolving regulatory landscape surrounding cryptocurrencies. Governments worldwide are still grappling with how to handle these digital assets, and regulations can significantly impact how TON operates within different markets.
Navigating this regulatory tightrope will be crucial for TON’s long-term success. The network needs to ensure it complies with evolving regulations while still offering users the functionality and freedom they expect from a decentralized blockchain.
Featured image from Pexels, chart from TradingView

According to a Chainalysis report, there are a total of 1.75 million dormant BTC addresses inactive for over a decade.
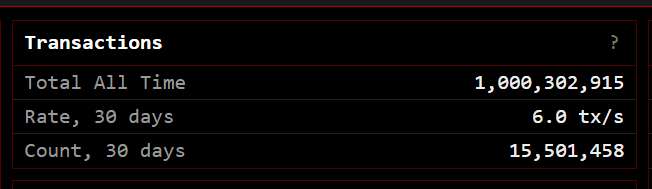
Bitcoin, the trailblazer of cryptocurrencies, reached a symbolic milestone this weekend, processing its 1-billionth transaction. This achievement has ignited a celebratory mood among proponents, who hail it as a testament to the digital currency’s growing legitimacy and potential. However, beneath the champagne toasts, whispers of caution linger as analysts grapple with the true significance of this benchmark.
At the heart of the celebration lies the accomplishment itself. Bitcoin’s decentralized network, often touted for its security, has demonstrably facilitated 1 billion transactions – a testament to its ability to function flawlessly at scale.
This feat, based on data by Clark Moody, is particularly noteworthy when compared to established payment giants like Visa, which took roughly 25 years to reach the same milestone. Proponents like Tarik Sammour emphasize this achievement, highlighting that “Bitcoin has done so flawlessly, securely, and without any centralized intermediary,” a stark contrast to the traditional financial system.
What’s amazing is not that the #Bitcoin network has now processed 1B transactions, but that it has done so flawlessly, securely, and without any centralised intermediary. https://t.co/XC09H5bO6u
— Tarik Sammour (@tarik_sammour) May 6, 2024
The celebratory mood extends to Bitcoin’s potential as a viable payments platform. Analysts point to the rapid growth of Bitcoin compared to established players like Visa and Mastercard. Founder of the Orange Pill App, Matteo Pallegrini, emphasizes this point, underscoring Bitcoin’s resilience despite facing giants with “billions of dollars in marketing spend and thousands of employees.”
This comparison fuels the narrative that Bitcoin is disrupting the payments landscape, offering a faster and more transparent alternative.
A Look Beyond The Billion: Challenges On The Horizon
While the celebratory chorus is loud, a closer look reveals some lingering concerns. Bitcoin grapples with scalability issues, struggling to handle the high transaction volume necessary to truly compete with traditional payment processors.
This often translates to high transaction fees, potentially hindering broader adoption. Furthermore, the environmental impact of Bitcoin mining, which relies on vast amounts of energy, remains a significant point of contention.
The Verdict: A Toast With Reservations
The 1 billion transaction milestone undoubtedly marks a significant moment for Bitcoin. It underscores the growing popularity and potential of this digital currency. However, a balanced perspective recognizes the challenges Bitcoin faces – scalability, transaction fees, and environmental concerns.
Related Reading: XRP Holders Stack Coins Despite Price Dip: Bullish Signal Or HODL Of Desperation?
While institutional investment and comparisons to internet adoption are encouraging signs, widespread individual adoption remains a question mark. The future of Bitcoin hinges on its ability to address these issues and evolve into a truly viable alternative in the global financial landscape.
Featured image from Pexels, chart from TradingView

Department store gift vouchers, stocks, and loyalty points from tech giants can be donated to charities, but not crypto.
The cryptocurrency market has been battered by recent storms, with many altcoins experiencing significant price drops. XRP, however, seems to be weathering the tempest with a hint of defiance. While its price has dipped, on-chain data reveals intriguing trends that suggest a potential silver lining for XRP investors.
Despite the price decline, a surprising trend has emerged. The number of investors holding between a thousand and 1 million XRP tokens has actually grown by 0.20% over the past month, according to data from Santiment. This could signify a growing population of “diamond hands” – investors who hold onto their XRP despite market volatility, believing in its long-term potential.
However, another possibility exists. The decrease in the number of whales holding between 1,000 and 1 million XRP tokens could indicate these larger investors are consolidating their holdings, potentially accumulating even greater amounts of XRP. This consolidation could be a precursor to future market moves by these whales.
Technical analysis paints a cautiously optimistic picture for XRP. The Chaikin Money Flow (CMF), an indicator that tracks the flow of money into and out of an asset, has been trending upwards despite the price decline.
This “bullish divergence” suggests that even as the price falls, there might be a hidden buying force accumulating XRP. Investors might be interpreting the price drop as a buying opportunity, anticipating a future upswing.
A Sea Of Uncertainty: Legal Battles And Market Headwinds
While the on-chain data and technical indicators offer some positive signs, it’s crucial to acknowledge the storm clouds still lingering over XRP. The ongoing legal battle between Ripple Labs, the company behind XRP, and the US Securities and Exchange Commission (SEC) continues to cast a shadow. The outcome of this case could significantly impact XRP’s price and overall market perception.
Furthermore, the general health of the cryptocurrency market remains a significant factor. If the broader market continues its downward trend, it could drag XRP down with it, regardless of any positive on-chain developments.
A Coin To Watch?
XRP’s current situation is a curious mix of resilience and vulnerability. The uptick in smaller investors and potential whale consolidation suggest some underlying belief in XRP’s future. The technical indicators hint at a possible price reversal, but the legal battle and broader market uncertainties create a complex landscape.
Featured image from VitalMTB, chart from TradingView
Cardano (ADA) might be going through a lackluster price action at the moment, but analyst Ali Martinez believes the crypto might be gearing up for a parabolic run. While taking to social media platform X, Martinez talked about an intricate price analysis that ADA investors might find appealing.
Particularly, the analyst noted that the cryptocurrency’s current price formation is showing signs of a comeback, according to its price history.
The price of Cardano has been on a correction path since the middle of March when it peaked at $0.79. Interestingly, current price levels means that the cryptocurrency has corrected over 40% from this peak.
This has led to concerns from some investors about the ADA’s price trajectory for the rest of the years, particularly considering different inactivity concerns and others surrounding the cryptocurrency. However, according to Martinez, this cycle is normal for the cryptocurrency.
The renowned analyst’s take on ADA is based on its historical trend. According to the 1M ADA/USD timeframe chart shared by Martinez, the 50% price drop ADA recorded in the past month could be a golden opportunity for crypto investors to position themselves for a price surge.
Looking at ADA’s price history shows this may just be a temporary setback before the next rally. A similar price action played out between 2019 and 2020 before the surge to new all-time highs in 2021.
After breaking out of a consolidating channel in 2020, ADA went on a 75% surge and then corrected by 56% over three months. This correction was soon forgotten as ADA bounced up and went on an impressive 4,095% bull run to reach its current all-time high of $3.09.
As Martinez noted, a similar price action seems to be playing out. ADA recently broke out of a consolidating channel which played out for almost the entirety of 2023. This break above the channel saw ADA performing a 72% surge before its recent correction.
If history were to repeat itself, ADA might kickstart a parabolic run in May and push up to new highs in the coming months. Martinez predicted a 2,480% price surge to $9.98 within the next nine months.
History doesn’t repeat itself, but it often rhymes!
If that is the case for #Cardano, we should be positioning ourselves for what’s coming, understanding that the recent price correction might just be one of the last buy-the-dip opportunities $ADA will give you. pic.twitter.com/wlKs7fNhb8
— Ali (@ali_charts) May 3, 2024
It is important to note that the crypto market has evolved significantly since 2021 and crypto assets have become less volatile, especially during uptrends. Many things have to be put in place in order for a $9 ADA price to become a reality.
For instance, there needs to be a wider inflow and mainstream adoption of cryptocurrencies. According to crypto prediction website Telegaon, Cardano could reach the $9 price level by the end of the decade.
Martinez believes the recent price correction might actually be one of the last buy-the-dip opportunities for investors to get on ADA. At the time of writing, ADA is trading at $0.4638 and is down by 1% in the past 24 hours.
Featured image from Pexels, chart from TradingView
Arthur Hayes, the co-founder and former CEO of BitMEX, recently shared his thoughts on the current Bitcoin price action. He stated that the flagship crypto has hit a local low and predicted what its future trajectory will look like.
In a recent blog post, Hayes mentioned that Bitcoin hit a local low when it dropped to around $58,600 earlier this week. As such, he doesn’t foresee the flagship crypto dropping below that price range again anytime soon.
Instead, he predicts that Bitcoin will rally above $60,000 (which it already did) and “then range-bound price action between $60,000 and $70,000 until August.”
Hayes also suggested that Bitcoin’s recent decline was due to several factors, including the Fed rate decision, the Bitcoin halving sell-the-news event, and the slowdown in the demand for US Spot Bitcoin ETFs.
He also used the opportunity to touch on the recent Fed and Treasury policy announcements, which he believes will significantly impact crypto.
Hayes claimed those announcements meant the government would likely resort to money printing soon enough. He believes the potential injection of liquidity into the US economy will “dampen negative price movement” in the crypto market. As such, he expects that prices will “bottom, chop, and begin a slow grind higher.”
Hayes’ projections are similar to crypto expert Michaël van de Poppe, who recently predicted that Bitcoin will likely consolidate for a few months. Interestingly, Van de Poppe also alluded to the Fed’s recent policies, noting that a Quantitative Easing is close, which would be bullish for Bitcoin.
However, Hayes sounded apprehensive of the long-term effects of the recent monetary announcements, noting that they had an inflationary nature.
Therefore, although more money is expected to flow into the crypto market with the Fed’s decision, it could cause inflation to skyrocket. This would eventually lead to higher interest rates, negatively affecting risk assets like Bitcoin.
The MEXC co-founder said he would buy Solana and “doggie coins for momentum trading positions.” For long-term “shitcoin positions,” he mentioned that he would increase his allocations in Pendle while identifying other tokens that he considers undervalued. Basically, he plans to use this month to increase his exposure.
Once he had done that, he remarked that he would wait for the market to “appreciate the inflationary nature of the recent US monetary policy announcements.”
Meanwhile, as to what doggie coins Hayes might be accumulating, Dogwifhat (WIF) is likely one of them, considering he once mentioned that he would load up on WIF as Bitcoin bottoms out.
Featured image from Pexels, chart from TradingView
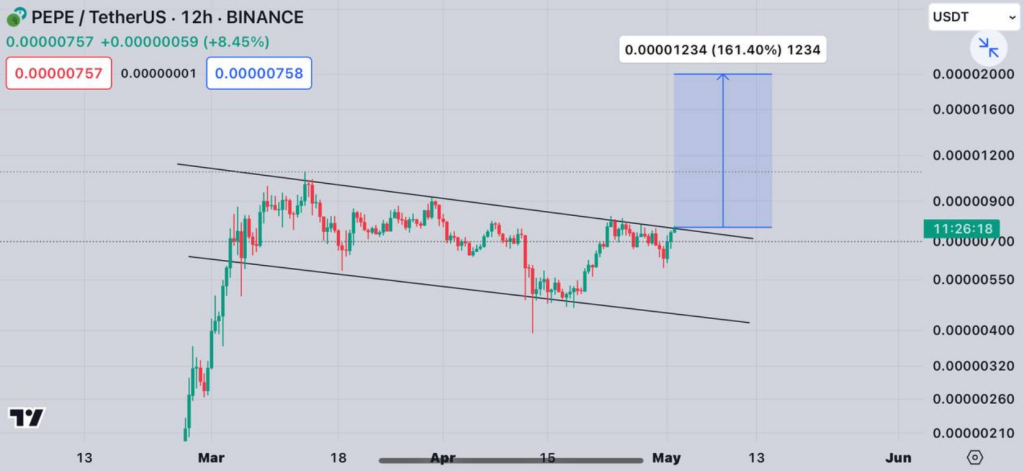
The cryptocurrency market may be experiencing a cool down, but one meme coin is refusing to catch a cold. PEPE, a token emblazoned with the internet’s famous frog, has defied recent bearish trends with a surge in price and trading activity. This resilience has fueled speculation of a potential “bullish breakout” in the coming days, with some analysts predicting astronomical gains.
While Bitcoin and Ethereum have taken a breather in recent weeks, PEPE has exhibited surprising strength. Unlike its more established counterparts, PEPE hasn’t succumbed to the broader market chill. In fact, the meme coin has managed to inch up slightly this week and even enjoyed a nearly 10% price jump in the last 24 hours. This resilience has captured the attention of investors and analysts alike.
The newfound bullishness surrounding PEPE is further bolstered by a surge in trading activity. The coin boasts a 24-hour trading volume exceeding a staggering $1.26 billion, placing it firmly in the spotlight. Additionally, PEPE’s market capitalization currently sits at a healthy $3.23 billion, a testament to its growing presence within the crypto landscape.
Technical Analysis Paints A Bullish Picture
Adding fuel to the fire, crypto analyst World Of Charts has identified a bullish flag pattern in PEPE’s recent price action. This technical indicator often precedes a price breakout, suggesting that PEPE might be on the cusp of a significant upward trajectory.
$Pepe#PEPE On Verge Of Another Breakout Formed Bullish Flag & Testing Its Upper Resistance Incase Of Breakout Expecting Another 80-90% Bullish Wave In Coming Days#Crypto pic.twitter.com/f2jtxpOIp3
— World Of Charts (@WorldOfCharts1) May 2, 2024
World Of Charts predicts a potential price surge of 80-90% in the coming days if the coin manages to break free from its current resistance level.
Meme Coin Frenzy: A Double-Edged Sword?
Despite the optimistic outlook, a cloud of caution hangs over PEPE’s future. The coin falls under the category of meme coins, a notorious sector within the cryptocurrency market known for its volatility and often lacking strong fundamental backing.
Unlike established projects with real-world applications, meme coins often rely on community hype and internet trends to propel their value. This can lead to sharp price spikes followed by equally dramatic crashes.
While the prospect of an 80-90% return on investment is undeniably enticing, experts urge potential investors to approach PEPE with a dose of healthy skepticism. The analyst prediction, while optimistic, should not be taken as financial gospel. The cryptocurrency market, especially the meme coin segment, is inherently unpredictable.
Featured image from Pexels, chart from TradingView
The price of Shiba Inu (SHIB), the self-proclaimed “Dogecoin killer,” has been caught in a technical tug-of-war, with bears attempting to push it lower and bulls clinging to signs of hope. Analysts are scrutinizing the memecoin’s chart pattern and on-chain data to decipher its next move.
A descending triangle formation has emerged on SHIB’s 3-day chart. This pattern typically indicates a potential price decline, as the asset’s price gets squeezed between converging support and resistance lines. The big question for SHIB holders: will the price break below support and continue its descent, or will it defy gravity and break out of the triangle, sparking an uptrend?
Adding fuel to the bearish fire, SHIB has witnessed a significant drop in demand. Data from Santiment reveals a worrying trend: the daily active addresses for SHIB have plummeted by more than 50% over the past month. This suggests a shrinking user base and potentially lower trading volume, which can put downward pressure on the price.
New Investors Give SHIB The Cold Shoulder
Further dampening spirits is the sharp decline in new addresses joining the SHIB party. According to on-chain data, the number of new addresses created daily to trade SHIB has nosedived by 51% in the same period. This lack of fresh blood entering the market could exacerbate the selling pressure.
SHIB’s High Valuation: A Recipe For Sell-Off?
Another factor causing concern is SHIB’s Market Value to Realized Value (MVRV) ratio. This metric compares the current market price with the average acquisition price of all SHIB tokens. Currently, SHIB’s MVRV ratio sits at a lofty 38%. When this ratio is high, it suggests the asset might be overvalued, potentially triggering existing holders to cash in on their profits and contribute to a sell-off.
A Silver Lining?
Despite the prevailing bearish sentiment, a glimmer of hope flickers for SHIB. The coin’s weighted sentiment has surprisingly turned positive recently, indicating a shift in market perception. This newfound optimism could translate into a price breakout, defying the descending triangle’s bearish implications.
Related Reading: Bitcoin Update: $120 Million Futures Liquidated As Price Takes A Beating
Can Bullish Sentiment Propel SHIB To Higher Ground?
If the positive sentiment persists, analysts predict a potential price surge for SHIB, reaching $0.00003. This would be a welcome change for investors who have witnessed a recent price slump.
Meanwhile, SHIB’s Fibonacci retracement level shows that the memecoin’s price may drop further 15% to trade at a low of $0.000018 if the bears continue to put pressure on it and it falls below support.
SHIB investors now have more cause for concern as this underscores the possible repercussions of a bearish breakthrough.
Featured image from Pexels, chart from TradingView
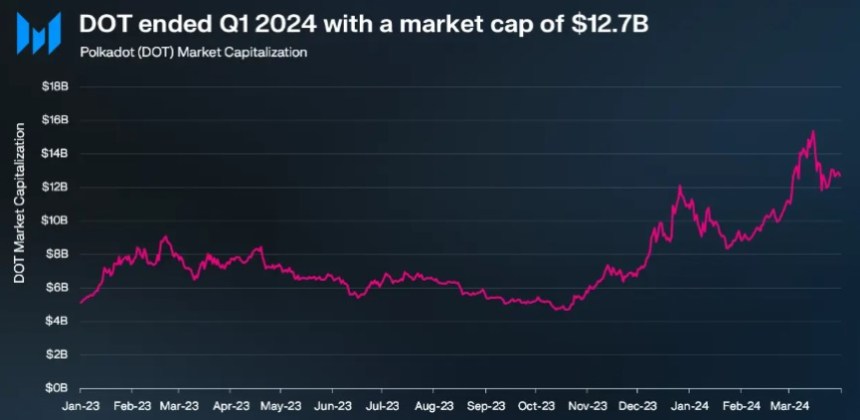
According to a Messari report, the Polkadot (DOT) blockchain protocol made significant progress in the first quarter (Q1) of the year in terms of market capitalization, revenue, and Cross-Consensus Message Format (XCM) activity, as well as a record increase in daily active addresses.
During Q4 2023, Polkadot’s market capitalization experienced a notable 111% quarter-on-quarter (QoQ) increase, reaching $8.4 billion. Building on this momentum, Q1 2024 witnessed a further 16% QoQ rise, elevating the circulating market cap to $12.7 billion.
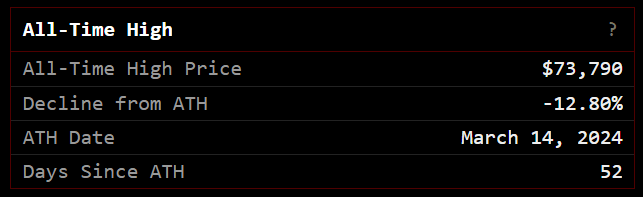
Despite these gains, DOT’s market capitalization remains 80% below its all-time high of $55.5 billion, set on November 8, 2021.
In Q4 2023, Polkadot’s revenue also skyrocketed by 2,880% QoQ, amounting to $2.8 million. Per the report, this surge was primarily attributed to an exponential increase in extrinsics, driven by the Polkadot Inscriptions.
However, revenue metrics for Q1 2024 declined significantly on a QoQ basis, with revenue in USD dropping by 91% to $241,000 and revenue in DOT decreasing by 92% to 28,800. It is worth noting that Polkadot’s revenue tends to be relatively lower compared to its competitors due to the network’s structural design.
Polkadot’s XCM activity continued to show growth in Q1 2024. Daily XCM transfers surged by 89% QoQ to reach 2,700, while non-asset transfer use cases, known as “XCM other,” witnessed a 214% QoQ increase, averaging 185 daily transfers.
The total number of daily XCM messages grew 94% QoQ to 2,800, demonstrating the network’s dynamic ecosystem. In addition, the number of active XCM channels grew 13% QoQ to a total of 230.
Q1 2024 marked a significant kick-off to the year for Polkadot’s parachains, with active addresses reaching an all-time high of 514,000, representing a substantial 48% QoQ growth.
Moonbeam emerged as the leading parachain with 217,000 monthly active addresses, a solid 110% QoQ increase. Nodle followed closely with 54,000 monthly active addresses, doubling from the previous quarter.
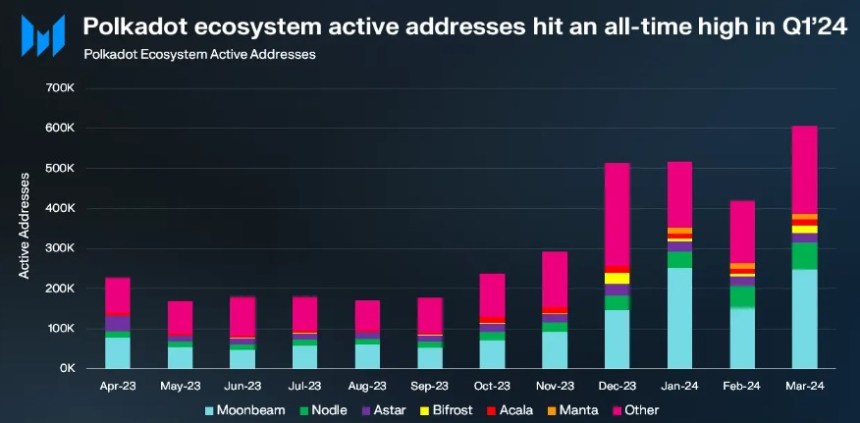
Astar on the other hand, experienced a modest 8% QoQ growth to reach 26,000 active addresses, while Bifrost Finance grew slightly by 2% QoQ to 10,000 addresses. However, Acala experienced a decline, with monthly active addresses falling to 13,000, down 16% QoQ.
Notably, the Manta Network stood out among parachains in Q1 2024, with a significant surge in daily active addresses, reaching 15,000. According to Messari, this increase was fueled by the successful launch of the MANTA token TGE and subsequent listing on Binance, propelling Manta’s Total Value Locked (TVL) to over $440 million.
In terms of price action, Polkadot’s native token DOT has regained bullish momentum following a sharp drop to the $5.8 price mark after reaching a yearly high of $11 on March 14.
Currently, DOT has regained the $7.25 level, up 7% over the past week. However, DOT’s trading volume decreased slightly by 4.7% compared to the previous trading session, amounting to $320 million over the past 24 hours, according to CoinGecko data.
If the bullish momentum persists, Polkadot faces its first resistance at the $7.4 zone, which serves as the last threshold before a potential retest of the $8 resistance wall.
On the other hand, the $6.4 support floor has proven to be successful after being tested for two consecutive days this week, highlighting its significance as a key level to watch for the token’s upward movement prospects.
Featured image from Shuttestock, chart from TradingView.com
Shiba Inu (SHIB) has demonstrated resilience despite recent market downturns. Data reveals that roughly over 700 trillion SHIB tokens held by more than 650,000 wallet addresses remain profitable, reflecting steadfast confidence among holders in the token’s long-term value.
Recent on-chain analytics have uncovered an interesting trend among Shiba Inu investors. Despite a general dip in SHIB’s market price, investors continue to hold a substantial volume of tokens—totaling 733 trillion—showing unrealized gains.
These holdings, maintained by approximately 653,530 individual wallets, were acquired at prices ranging from $0.000002 to $0.000022, averaging out at $0.000011.
This indicates not only a significant level of acquisition but also a broad base of investors who entered the market at lower valuations, positioning themselves in profit despite the coin’s fluctuating fortunes.
The “Break Even Price” indicator, a crucial tool derived from on-chain data, suggests that many SHIB holders are still in the green financially. This could point to a collective strategy among holders to weather short-term price movements, with an eye on potential long-term returns.

Such data reinforces the notion of SHIB as more than just a speculative asset, hinting at a deeper conviction among its community regarding the token’s future potential.
Despite a decline of 5.2% over the past week and 11.9% over the past month, Shiba Inu has seen a recent uptick of 3.3% in its price in the last 24 hours, trading at $0.00002389.
Notably, this upward trajectory in value mirrors the asset’s trading volume, which has also surged from below $400 million last week to above $600 million as of today.
This recovery aligns with significant developmental strides within the Shiba Inu ecosystem, particularly the completion of a hard fork in its Layer-2 blockchain solution, Shibarium.
The Shibarium hard fork, executed at block height 4504576, introduced enhancements aimed at improving usability and transaction efficiency. This was a response to community feedback advocating better performance and lower costs.
This upgrade is expected to boost transaction speeds and stabilize transaction fees on Shibarium, making costs more predictable for users.
Moreover, the recent hard fork’s dual focus—enhancing the Bor and Heimdall components of Shibarium—aims to refine the platform’s technical infrastructure.
1/ #Shibarium has successfully completed its hard fork at block height 4504576!
Get ready for:
•Blazing-fast transactions!
•Predictable gas fees!pic.twitter.com/oQrtF3OMTe
— Shibarium Network (@ShibariumNet) May 2, 2024
By improving the calculation of state sync confirmation and ensuring deterministic finality, the Shiba Inu team appears keen on improving the network’s reliability and scalability.
Featured image from Unsplash, Chart from TradingView
Fantom (FTM) had initially reclaimed the $1 level back in March and expectations were that the coin would rise to $2. But that was before the market crash sent prices spiraling, and Fantom lost almost 50% of its value during this time. However, all hope is not lost of for the coin, as one crypto analyst expects a return of the bullish momentum as long as certain conditions are met.
Crypto analyst MyCryptoParadise took to TradingView to share their analysis on the Fantom price and how it could see a recovery. After the price fell to $0.56, the altcoin began to look for support, which would serve as a bounce-off point, and the analyst revealed that the altcoin is actually getting closer to this support.
For now, the support lies at $0.5679, which is the point that bulls need to hold to confirm a bullish breakout. Following a rejection at the $0.79 resistance, this point has become even more important to hold, as the FTM price searches for “renewed momentum.”
“Should FTM successfully find support and bounce from this level, it could potentially form a double bottom pattern, with the neckline acting as resistance around the 0.798 mark,” the crypto analyst said, highlighting the importance of finding support.
In the event of a breakout, the analyst expects at least a 100% move from here. The first major level to break it the $1 level, and then after that, the crypto analyst sees the price going as high as $1.2 as long as the trend is confirmed.
On the flip side of this, the crypto analyst also identifies a scenario where the Fantom price could continue to break down. In the event that the altcoin is unable to find support above $0.56 and breaks through it instead, the bloodbath could continue.
The bearish continuation which the analyst sees in a situation like this will send the price below $0.5 eventually. The support for the FTM price then lies at the next Bullish OB area, which the crypto analyst identifies to be around $0.449.
“ Reclaiming the support at 0.568 would be crucial for FTM to maintain its bullish momentum,” the analyst said. “Should FTM fail to bounce even after reaching the Bullish OB area, it would signal a bullish invalidation, indicating a continuation of the bearish trend.”
Presently, the Fantom price is trending above support at $0.6641. However, it is down 3% in the last day with 10% losses in the last week.
Bitcoin (BTC), the largest cryptocurrency in the market, has experienced a notable resurgence in its bullish momentum, with the Bitcoin price reclaiming the crucial $61,000 threshold.
This recovery follows a week-long downtrend that led to a 20% drop to $56,000 on Wednesday. As the bullish momentum returns, the possibility of further testing upper resistance levels and reclaiming previously lost price levels grows stronger.
According to market expert Justin Bennett, a recovery of the $61,000 resistance level would open up potential areas such as $67,000 to $68,000. However, at the present moment, this level continues to pose a significant resistance.
Analyzing the recent correction in the Bitcoin price, analyst Crypto Con suggests that the market correction was necessary for the long-term price trajectory.
The full retest of the 20-week Exponential Moving Average (EMA) support at $56,700 and the return to indicator support zones, such as the Directional Movement Index, indicate a healthy price consolidation.
In addition to the technical indicators, on-chain and market data analytics firm CryptoQuant’s founder and CEO, Ki Young Ju, highlights the current bullish sentiment.
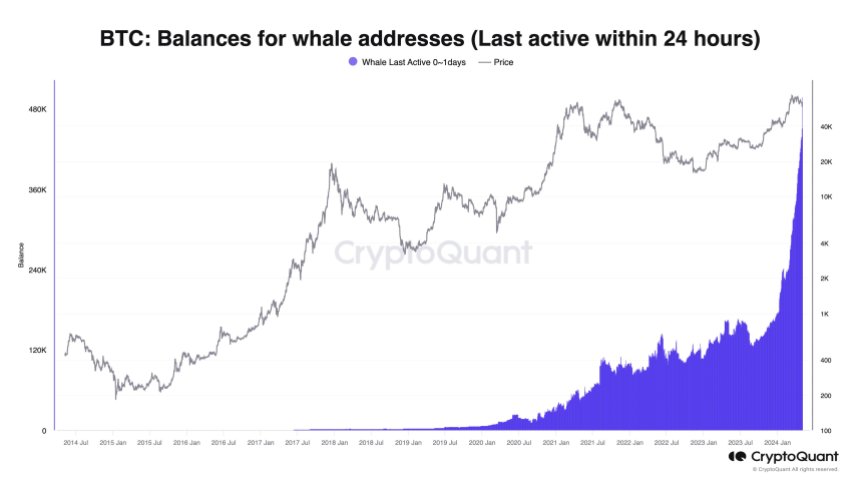
According to their data, whales accumulated a significant amount of Bitcoin, totaling 47,000 BTC, within the past 24 hours. This increased accumulation by large investors further bolsters the positive outlook for Bitcoin’s price.
Crypto analyst Titan of Crypto has provided further bullish predictions for the Bitcoin price, suggesting that recent corrections have resulted in the grabbing of leverage longs liquidity. In addition, the Stochastic Relative Strength Index (RSI)on the 5-day chart is on the verge of crossing into bullish territory.
This occurrence has historically been followed by an upward price movement in Bitcoin, leading to higher highs. Such a pattern has the potential to fuel renewed investor confidence and attract further buying pressure.
Another positive signal highlighted by Titan of Crypto is the recent buy signal generated by the Supertrend indicator, as seen in the chart below. This technical tool helps identify trends in an asset’s price movement.
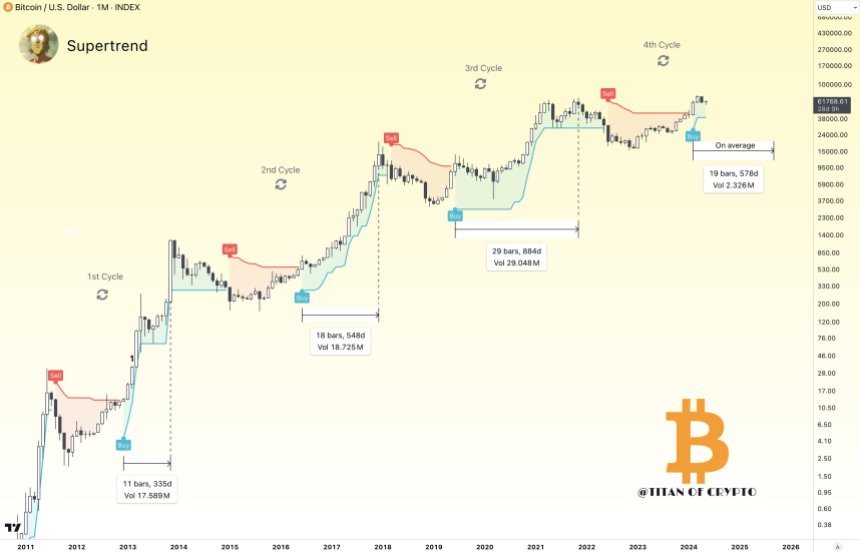
The buy signal, which occurred just three months ago, implies that Bitcoin may still have significant room for growth before reaching its cycle top. According to the analyst, historical data suggests that the average duration from the buy signal to the cycle top is approximately 19 months, indicating the potential for a sustained upward trend.
Currently trading at $61,600, Bitcoin has seen a significant increase of 4.7% in the last 24 hours alone. It remains to be seen if BTC will successfully break above resistance levels, while also challenging the ability of previously retested support levels to withstand potential future downtrends.
Featured image from Shutterstock, chart from TradingView.com


