Crypto Analyst Shares Top AI Altcoin Investments This Month

In an analysis of the current landscape at the nexus of artificial intelligence and altcoins, crypto analyst Prithvir (@Prithvir12) recently shared insights via X that highlight both the opportunities and pitfalls in the AI coin market this month. His analysis covers upcoming AI catalysts, their impact on specific tokens, and personal investment recommendations, shedding light on the nuanced strategies required in this volatile segment.

In-Depth Look At The AI Crypto Market

Prithvir underlines a series of significant events in the AI space that are anticipated to directly impact the crypto markets. He first points to NVIDIA’s earnings announcement scheduled for May 22nd, emphasizing NVIDIA’s pivotal role in AI technology, which could have cascading effects on AI-centric cryptocurrencies.

Further stirring the market is the buzz around OpenAI’s GPT-4oT. Moreover, Prithvir discusses the influence of major tech conferences focused on AI advancements, notably Google’s I/O conference and Apple’s emphasis on AI at its upcoming Worldwide Developers Conference (WWDC). He predicts these events are poised to introduce new AI initiatives that could impact crypto markets.

In his post, Prithvir also analyzes several tokens that have responded differently to these AI catalysts. He describes WLD, associated with OpenAI through Sam Altman, which experienced a 20% drop in price last week, a typical “sell the news” reaction post the GPT-4o announcement. He expresses concerns about WLD’s “ridiculous tokenomics” and the risks posed by potential coordinated short squeezes, advising traders to approach with caution.

Prithvir also touches upon OLAS, which, despite losing some visibility since its peak in 2023, remains active on the Gnosis chain and could be poised for a comeback depending on market conditions and developments within its platform, according to the analyst.

The token SPEC, however, has shown significant volatility, skyrocketing from $5 to $15 and then retracting to $8 within two weeks. Prithvir critiques its high fully diluted valuation (FDV) close to $1 billion, warning of the speculative nature and the inherent risks of engaging with such a volatile asset.

Lastly, he addresses the group of ASI tokens FET, AGIX and OCEAN, representing the Super Intelligence Alliance, noting that their once-leading positions in AI-driven market rallies have dwindled. According to Prithvir, these tokens are currently overvalued, with limited upside potential, indicating a saturated market state for these assets.

Prithvir’s Top Altcoin Picks

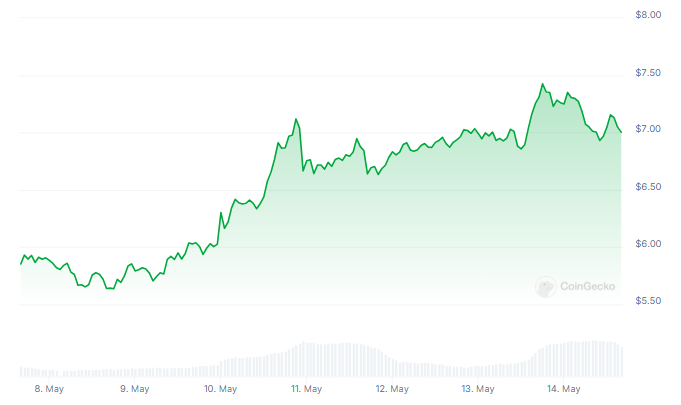
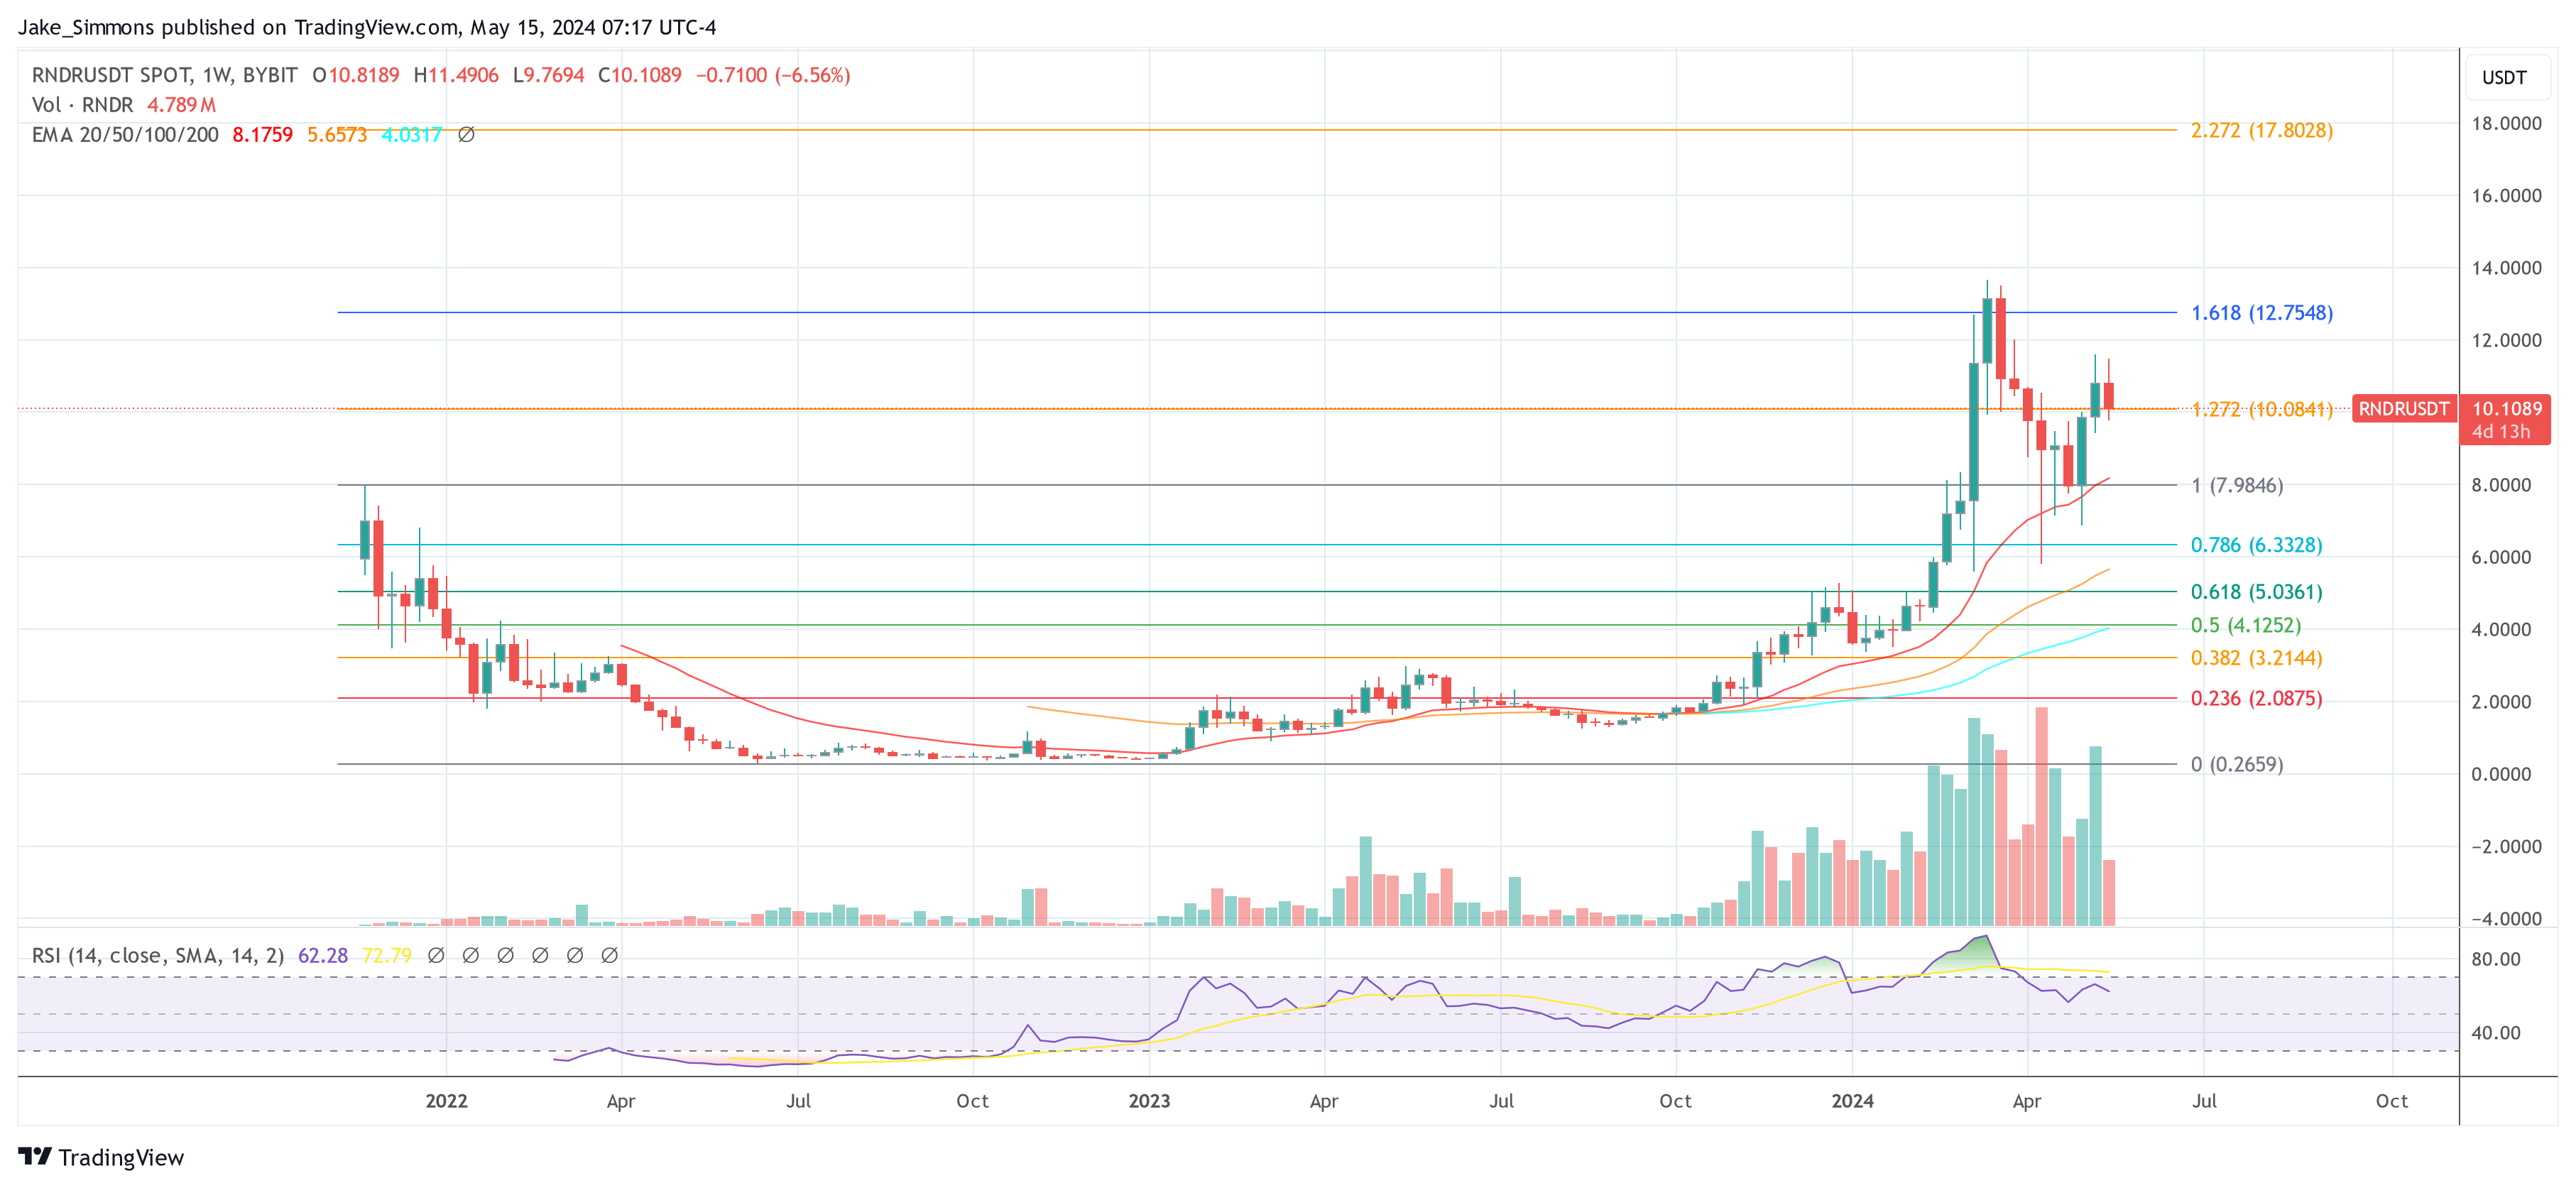
Navigating through the complexities of the AI coin market, Prithvir shares his preferred investment strategies and picks. He highlights Render (RNDR) as a favorable choice, especially leading up to NVIDIA’s earnings and Apple’s WWDC, due to its direct ties to their technologies and expected feature enhancements which might boost its value.

NVIDIA due to comparisons of GPU networks and Apple due to the rendering software they have built that Apple always features at different keynotes. Hence, I think this could be a good swing trade leading up to WWDC Time period – 3 weeks,” the analyst stated.

AR is Prithvir’s “biggest AI coin holding currently.” The project is praised by him for its pivot to AI functionalities with the AO Computer and robust team. The presence of AR on Tier-1 exchanges and its substantial backing makes it a “no-brainer” for a medium-term hold.

He also mentions NEAR, albeit with a smaller investment footprint due to the perceived limited upside. “Smaller position than AR due to more limited upside. But could become one of the consensus AI trades of this cycle due to its brand value, good liquidity and innovations in other sectors such as Chain Abstraction,” Prithvir wrote via X.

At press time, RNDR traded at $10.1089.

Render RNDR token price

XRP To Nearly $600? Analyst Makes Bold Claim, But Can It Overcome Legal Hurdles?

A fresh prediction has ignited discussion in the XRP community. Analyst Cryptobilbuwoo is charting an ambitious course for the cryptocurrency, with a potential price target that has some investors excited and others skeptical.

Echoes Of 2017: Fibonacci Paints A Bullish Picture

Cryptobilbuwoo’s forecast draws inspiration from historical patterns, particularly the XRP rally of 2017. By leveraging Fibonacci retracement levels, a common technical analysis tool, they see a potentially similar scenario unfolding for the altcoin.

Imagine a roadmap to the summit. Fibonacci levels act as checkpoints, highlighting potential resistance or support zones during a price rise. Cryptobilbuwoo suggests XRP could break through the $33 mark, aligning with the key Fib. 1.618 level.

This would be a significant step forward, but the real climb comes next – a projected ascent to $589, based on the Fib. 2.382 level.

A Lofty Target: Can XRP Reach The Top?

However, there’s a significant hurdle to overcome. To reach $589, the coin would require a staggering price increase of over 100,000%. This ambitious target has many market analysts raising eyebrows. It’s a leap that some consider more akin to wishful thinking than a realistic market prediction.

Other crypto market analysts present a contrasting view, suggesting XRP could even fall to zero. While this scenario seems extreme, it underscores the inherent volatility of the cryptocurrency market.

At the time of writing, XRP was trading at $0.5004, down 1.4% and 4.2% in the daily and weekly timeframes, data from Coingecko shows.

Meanwhile, in the XRP community, the $589 narrative used to be the main focus. The community’s excitement to see XRP at $589 is evident in the tweet below:

Signs Of Optimism: Fueling The Ascent?

Despite the skepticism surrounding the $589 target, there are positive signs for XRP. The coin has displayed resilience, consistently hovering above the psychologically important $0.50 level.

Additionally, a trend of investors moving XRP off exchanges has emerged. This could indicate a more long-term bullish outlook and potentially reduce selling pressure.

Technically, Cryptobilbuwoo finds support for their prediction in XRP’s historical price charts. They point to a descending triangle pattern on the XRP/BTC chart, a formation that preceded XRP’s breakout in 2017. Could this be a sign of history repeating itself?

The Verdict: A Measured Climb Or A Fall From Grace?

The future for XRP likely lies somewhere between the extremes. The $589 target might be overly optimistic, but a measured upswing based on technical indicators and reduced selling pressure remains a possibility.

Featured image from Reddit, chart from TradingView

Pepe Power! Meme Coin Surges On Back Of GameStop Nostalgia

The internet’s resident amphibian is back in the spotlight, but this time Pepe the Frog isn’t gracing troll forums – he’s maneuvering his way to the top of the cryptocurrency charts. PEPE, the meme coin named after the internet legend, is experiencing a historic surge, fueled by a potent mix of nostalgia and retail investor fervor.

From Backwater To Bullfrog: PEPE’s Rise

PEPE’s recent ascent is nothing short of meteoric. Trading volume has skyrocketed by an impressive 300% in the past 24 hours, with the price reaching an all-time high. This dramatic rise coincides with a resurgence in Gamestop (GME) stock, leading many to believe that the retail investor army of 2021 is back for round two, armed with meme coins as their weapon of choice.

The return of Keith Gill, better known online as “Roaring Kitty,” has acted as a rallying cry for these digital warriors. Gill’s surprise post on his dormant Reddit account sent shockwaves through the market, reigniting the nostalgic flames of the original Gamestop saga. Analysts suggest this nostalgia has spilled over into the crypto market, sparking a full-blown meme coin craze.

PEPE, already experiencing a steady climb since mid-April, has emerged as the unlikely champion of this digital meme menagerie.

Whales Take A Dip In The Pepe Pond

It’s not just the small-time investors driving the PEPE surge. Big money, or “whales” in crypto speak, are also diving headfirst into the frenzy. On-chain data reveals a whale recently splashing out a cool 1.86 million USDC for a whopping 195 billion PEPE tokens. Another whale scooped up a hefty 406 million PEPE, further propelling the price upwards.

But Is It All Golden Memes And Rainbows?

While PEPE’s current trajectory is a dream come true for early adopters, a cautionary tale lurks beneath the frothy surface. Meme coins are notorious for their wild volatility. Their value is often built on hype and fleeting internet trends, not robust financial fundamentals. This means a sudden shift in sentiment could trigger a dramatic price crash, leaving investors holding the Pepe bag.

Related Reading: Bullish On Ethereum: Analyst Predicts Crypto’s Imminent Takeoff

Furthermore, PEPE is a relatively new player in the crypto game, with an uncertain future. Unlike established cryptocurrencies, PEPE lacks a proven track record. Its long-term viability remains a question mark.

Featured image from @GameStopPepe/X, chart from TradingView

XRP Set For Major Upswing: Top Analyst Reveals Timing For $10-$20 Price Milestone

XRP, the cryptocurrency associated with Ripple, has been locked in a lengthy period of consolidation, trading between $0.300 and $0.600 for the past seven years. 

Despite a brief surge during the 2021 bull run that saw XRP reach a three-year high of $1.9 in April, the token has since returned to its range, lacking the bullish momentum to overcome upper resistance levels. 

However, some crypto analysts are now predicting a major uptrend for XRP in the coming months, potentially propelling it to new heights.

Analysts Anticipate XRP Breakout

A technical analyst using the pseudonym “U-COPY” on the social media site X (formerly Twitter) suggests that XRP could experience significant movement between May 15 and August. 

U-COPY points out that XRP has been slowly moving up from its previous low at $0.46 and is nearing the end of a long triangle formation, which has been in accumulation since 2018. 

The analyst believes that XRP’s real potential will be revealed in the fully formed bull cycle, with the token possibly experiencing substantial growth by the end of the year.

Supporting this bullish outlook, another analyst, Armando Pantoja, proposes that the crypto bull run could begin in September or October 2025, with XRP potentially reaching a price of $0.75. 

Pantoja further suggests that if former US President Trump wins the election and the Securities and Exchange Commission (SEC) eases its stance on cryptocurrencies, XRP could be propelled to higher levels. 

This change in regulatory dynamics, combined with the ongoing legal battle between Ripple and the SEC, may increase the likelihood of XRP gaining approval for an exchange-traded fund (ETF) similar to Bitcoin. 

Pantoja outlines a price range of $1-2 for an XRP ETF announcement in early 2025. If interest rates are cut multiple times during the same period, XRP could potentially reach $5-10. Ultimately, Pantoja predicts the possibility of XRP hitting $10-$20 by the fourth quarter of 2025 or the first quarter of 2026.

‘Buy the Dip’ Opportunity? 

According to market intelligence platform Santiment, The XRP Ledger (XRPL) has recently witnessed a notable increase in the movement of dormant tokens, signaling a potential shift in market dynamics for the token. 

Coinciding with the opening of May, the company’s Token Age Consumed metric reveals a spike in the transfer of old coins, reminiscent of a similar occurrence in April, just before a significant downturn in the market. During that period, XRP experienced a sharp decline in value, dropping by 16%.

However, in contrast to the previous event, Santiment suggests that there is a “compelling argument” that this current surge in old coin movement might be attributed to the interest of key stakeholders looking to “buy the dip.” 

Furthermore, it is worth noting the growing open interest in exchanges, which has recently reached a three-week high. This uptick in open interest indicates increased active positions in XRP, potentially reflecting growing market participation and heightened trading activity.

Considering these factors together—the surge in dormant token activity, the potential buy-the-dip interest from key stakeholders, and the rising open interest on exchanges—there appears to be a shift in sentiment surrounding XRP. 

XRP

At press time, the seventh-largest cryptocurrency trades at $0.5020, down over 7% in the past week alone and 1% in the past 24 hours. 

Featured image from Shutterstock, chart from TradingView.com 

Bitcoin, Ethereum, And Solana: Galaxy Digital CEO Predicts Next Market Movements

Mike Novogratz, the CEO and founder of Galaxy Digital, shared his insights on the current state of the cryptocurrency market. According to Bloomberg, Novogratz predicts that Bitcoin (BTC) will likely remain within a relatively narrow trading range for the current quarter as the adoption of cryptocurrencies in traditional finance continues to evolve.

Stagnant Crypto Market

Per the report, Novogratz described the current phase in the crypto market as a consolidation period. He emphasized that Bitcoin, Ethereum (ETH), and other cryptocurrencies, including Solana (SOL), are expected to consolidate. 

This consolidation phase suggests that the Bitcoin price will likely trade within a range of approximately $55,000 to $75,000 until significant market events drive prices higher.

The crypto market has experienced a period of stagnation following the historic bull run witnessed in the past two quarters. This surge was fueled by the launch of spot US Bitcoin exchange-traded funds (ETFs) and the Bitcoin Halving, which reduced the supply of new BTC. 

However, Bitcoin’s price trend reversed due to diminishing optimism surrounding interest rate cuts by the Federal Reserve (Fed), amid consistently strong economic indicators.

According to Novogratz’s analysis, if his predictions hold, Solana could continue to consolidate within its current trading range of $120 to $150. This consolidation has been observed over the past month, indicating a period of stability for the cryptocurrency.

Similarly, Ethereum’s price has closely mirrored Bitcoin’s movements and has traded between the $2,870 and $3,200 levels. 

Ethereum recently failed to consolidate above the significant $4,000 mark reached in mid-March. As a result, Ethereum has experienced a period of price consolidation within the range above.

Bitcoin Volatility Persists

Novogratz acknowledged the tailwinds that propelled the market during the fourth quarter of 2023 and the first quarter of 2024. 

Galaxy’s CEO believes that these tailwinds will likely persist throughout the current quarter and possibly the next unless there are significant developments, such as the Fed initiating rate cuts due to an economic slowdown or until the regulatory landscape becomes clearer after the upcoming election.

Moreover, Novogratz noted a significant shift in counterparties’ willingness to lend crypto for extended periods without collateral, a trend that was not prevalent just six months ago. He emphasized that engagement in the crypto space has reached a new level, with growing interest from individuals and institutions alike.

On Tuesday, Bitcoin experienced a 2.7% decline, trading at $61,400. Since achieving a record high of $73,700 on March 14, the largest cryptocurrency in the market has undergone a 16% decline. Despite this, Galaxy Digital reported notable first-quarter results, with net income more than tripling to $421.7 million. 

Bitcoin

Featured image from Shutterstock, chart from TradingView.com 

Shiba Inu Volume Flips Dogecoin, Will SHIB Price Flip DOGE If This Analyst’s Prediction Comes True?

Shiba Inu is up by 7% in the past 24 hours amidst an uptick in the meme coin market, coming ahead of Dogecoin at this time. The meme coin niche has witnessed a strong resurgence in the past day, with the entire niche up by 7.82%. Shiba Inu has particularly done well and witnessed a strong volume of interest amidst this uptick. Interestingly, this uptick in volume for SHIB has surpassed DOGE, with on-chain data suggesting SHIB could do better in the short term. At the same time, crypto analyst Ali Martinez has revealed a phenomenon that could lead to a 20% upswing for SHIB.

Shiba Inu Volume Flips Dogecoin

Data from Coinmarketcap shows that Shiba Inu has witnessed a trading volume increase of 320% in the past 24 hours. The metric, on Dogecoin’s side, was an increase of 160%. The crypto, which has been trading inside a descending channel for a while, is now appearing to make a push above. 

Related Reading: Analyst Who Predicted Solana’s 1,100% Move Reveals Where The Altcoin Is Headed Next

Although current data from analytics platform IntoTheBlock (ITB) suggests DOGE is still holding on for a longer-term overperformance over SHIB, SHIB is starting to position itself to outperform DOGE in the short term on a cost basis. According to ITB’s holding by time metric, DOGE has seen a 1.86% increase in the number of holders in the past 30 days, compared to a 0.43% increase for SHIB. ITB terms holders as passive investors that have held the asset for more than one year. 

However, the number of cruisers (investors holding between 1 to 12 months) flips the short-term interest in the favor of SHIB. As of this writing, SHIB’s cruisers have increased by +5.69% in a 30-day timeframe. The metric, on DOGE’s side, shows a 2.44% decrease.

Shiba inu

SHIB To Breakout Of Parallel Channel

The recent increase in volume and short-term activity suggests that SHIB is ready to break out of a descending parallel channel of lower highs. As pointed out on social media by crypto analyst Ali Martinez, SHIB has been trading in a descending parallel channel since the last week of April. Current price action shows SHIB is now at the upper end of the descending and is at a critical junction for a breakout or reversal. 

Related Reading: Analyst Points Out Level To Beat If Bitcoin Is To Reach $76,000

According to the analyst, a breakout from this channel at $0.00002444 could lead to another 20% upswing to $0.00002954. The price target serves as the highest point of the descending channel under consideration. A further surge could see SHIB returning back to the $0.00003 price territory. 

At the time of writing, SHIB is trading at $0.0000236. Failure to break above $0.00002444 could send the cryptocurrency back down as far as $0.0000211.

Shiba Inu price chart from Tradingview.com (Dogecoin)

Is Ethereum Set For A Major Rally? Options Traders Bet Big On $3,600+ Targets For June

Ethereum (ETH) options for June show a marked interest in higher strike prices, focusing on levels exceeding $3,600.

Data from Deribit reveals a concentrated bet among traders on calls surpassing this price, indicating a bullish sentiment toward Ethereum’s near-term trajectory. The most favored strike price among these optimistic bets is an ambitious $6,500.

Options Market Bullish On Ethereum 

Notably, options are contracts that give traders the right, but not the obligation, to buy (in the case of calls) or sell (in the case of puts) the underlying asset at a specified strike price by the expiry date.

A call option is typically purchased by traders who believe the asset will increase in price, allowing them to buy at a lower rate and potentially sell at a higher market price. Conversely, put options are favored by those anticipating a decline in the asset’s price, aiming to sell at the current rate and repurchase at a lower value.

Currently, the Ethereum options market is tilting heavily towards calls, with the aggregate open interest—representing the total number of outstanding contract options—showing a preference for higher strike prices.

This concentration of calls, primarily above the $3,600 mark, suggests that a significant market segment is positioning for Ethereum to ascend to higher levels by the end of June.

Ethereum Open Interest By Expiration.

According to Deribit data, roughly 622,636 Ethereum call contracts are set to expire by June’s end, encapsulating a notional value above $1.8 billion. Such substantial positioning underscores the market’s confidence in Ethereum’s potential uplift.

Data further shows that the most substantial open interest is clustered around the $6,500 strike price, with a notional value of $193 million.

Ethereum Open Interest By Strike Price.

This concentration reflects trader optimism and supports Ethereum’s market price, especially if these options are exercised as the asset price approaches or surpasses these strike levels.

Despite the optimism embedded in these options, Ethereum is currently navigating a slight downturn. It has dropped 5.4% over the past week and 2.2% in the last 24 hours, positioning it below $2,900. This decline places even more focus on upcoming market catalysts that could significantly sway ETH’s price.

Ethereum (ETH) price is moving sideways on the 4-hour chart. Source: ETH/USDT on TradingView.com

Regulatory Decisions And Technical Indicators: A Dual Influence on ETH’s Path

One significant upcoming event is the US Securities and Exchange Commission’s (SEC) decision on several applications for Ethereum-based Exchange-Traded Funds (ETFs), which is due by May 25th.

This decision is pivotal as approval could usher in a wave of institutional investments into Ethereum, potentially catapulting its price. Conversely, rejection could dampen the bullish sentiment and lead to further pullbacks.

From a technical analysis standpoint, signs are pointing to a possible rebound. The “Bullish Cypher Pattern,” identified by the analyst Titan Of Crypto, suggests that Ethereum could be at a turning point. Currently, Ethereum is at the 38.2% Fibonacci retracement level, a key support zone in many bull markets.

This level has historically acted as a launchpad for upward price movements, hinting that Ethereum could be gearing up for a significant rise.

Featured image from Unsplash, Chart from TradingView

This Crypto Expert Called The Bitcoin Top in 2021, Now He’s Calling The Bottom In 2024

As the Bitcoin price continues to fluctuate wildly, the question in every investor’s mouth right now is when the digital asset will find its bottom. For some, the bottom has already been met, while for others, there are still more price crashes to come. However, one analyst’s prediction in particular stands out and this is due to his track record of accurately calling the top of the market back in the 2021 bull market.

Crypto Expert Says Bitcoin Bottom Is In

Crypto expert Dave the Wave first came into prominence back in 2021 when he had accurately predicted the Bitcoin top. Given this, Dave’s analysis holds weight in the crypto market, so it is no surprise that his most recent prediction calling the Bitcoin bottom is making the rounds.

Related Reading: Gaming The System: Pundit Reveals Why XRP Price Will Reach $33

In the analysis which was posted on X (formerly Twitter), the crypto analyst points to a number of indicators that show that the Bitcoin bottom has already been reached. One of these is the MACD which the analyst reveals is still far off from the levels from the last bull market.

In addition to the MACD still trending below this level, the crypto expert points out that the crypto market is more mature than it was. Given this maturing market, Dave the Wave stated: “It wouldn’t at all surprise me to see something different develop, pattern-wise, over the longer time frame.”

The analyst suggests that the Bitcoin low is actually in, and given that the price had fallen to $57,000 a couple of weeks ago, Dave’s analysis suggests that that is as low as the price will go. If this holds, then it is possible that the Bitcoin price will not fall below $60,000 before it resumes its bull rally.

BTC Price Expectations Still Bullish

Despite the slow momentum that has plagued the Bitcoin price, investors continue to be bullish on the cryptocurrency. This is evidenced by the Bitcoin Fear & Greed Index maintaining a firm grip on the Greed territory, showing that investors are still willing to buy into the market.

Related Reading: Theta Network Breakout Imminent: Why A 100% Rise Is Possible From Here

Furthermore, predictions from crypto analysts such as Rekt Capital have shown expectations for further price increases. Rekt Capital predicts that the BTC price will still cross $100,000 as long as the price is able to break above $63,000 and hold this level.

However, elsewhere in social media, there is a change in tide for the BTC price as social sentiment begins to fall to bearish headwinds. Santiment, an on-chain data aggregation platform, revealed that the Bitcoin social sentiment has seen a 14% drop in the last week.

Bitcoin price chart from Tradingview.com

Bullish On Ethereum: Analyst Predicts Crypto’s Imminent Takeoff

Ethereum (ETH), the world’s second-largest cryptocurrency by market capitalization, has been a rollercoaster ride for investors lately. After dipping below $2,820, it surged to over $3,200, only to retrace some of those gains. However, analysts remain optimistic, citing technical indicators and a key regulatory decision on the horizon as potential catalysts for a near-term price increase.

Ethereum Price Poised For A Breakout?

Technical analysts are pointing to bullish signals suggesting a potential bounce back for Ethereum. Analyst Titan Of Crypto believes a successful “Bullish Cypher Pattern” has played out, with all projected targets met. Currently, Ethereum sits at a pivotal support level, the 38.2% Fibonacci retracement, often seen as a springboard for upward momentum in bull markets.

This level has historically acted as a crucial support zone, says Titan. An optimistic outlook anticipates a price rebound from here.

Adding to the bullish sentiment, analyst JACKIS emphasizes the significance of Ethereum’s recent surge above $4,000 in March. This, according to JACKIS, represents a significant shift in the market structure towards a long-term uptrend.

The SEC Decision: A Potential Game Changer

The price of Ethereum could receive a significant boost from an upcoming decision by the U.S. Securities and Exchange Commission (SEC). By May 25th, the SEC is expected to rule on three applications for Ethereum-based Exchange-Traded Funds (ETFs).

A green light from the SEC for these ETFs would open the door for institutional investment into Ethereum, potentially leading to a surge in demand and price. Conversely, a rejection could dampen investor sentiment and trigger a pullback.

Related Reading: On A Tear: Toncoin Outshines Bitcoin With Price Surge And Social Buzz

Local Market Structure Hints At Underlying Bullishness

A closer look at Ethereum’s weekly chart reveals a bullish undercurrent despite the recent price dip. The presence of higher lows and higher Highs throughout the past few weeks indicates a healthy uptrend, with the current pullback seen as a natural consolidation phase.

Featured image from defense.gov, chart from TradingView

On A Tear: Toncoin Outshines Bitcoin With Price Surge And Social Buzz

The native token of the Telegram-connected Open Network, Toncoin (TON), has outperformed Bitcoin (BTC) despite the recent market turbulence. Bitcoin fell by 3% over the last week, while TON increased by nearly 20%. Within the cryptocurrency world, this unexpected outperformance has set off a wild speculating frenzy. Will TON’s rapid ascent continue, or is this merely a passing blip?

Social Buzz Fuels The Toncoin Engine

One key factor behind TON’s recent success appears to be a surge in social media activity. Social volume, a metric that tracks discussions and mentions on platforms like Twitter and Telegram, has skyrocketed by over 20% compared to the previous week. This suggests a growing interest in TON, potentially attracting new investors and driving up the price.

Investor Sentiment: A Mixed Bag For TON

However, a closer look reveals a potential wrinkle in this optimistic outlook. While the overall sentiment surrounding TON has been positive, it has recently dipped into negative territory. This could be a sign of growing investor apprehension, as some may be worried about the sustainability of the current price rally.


Accumulation Signals: Are Investors Betting Big On Toncoin?

On the other hand, some metrics point towards potential long-term bullishness. The mean dollar invested age, an indicator of how long tokens have been held, has been gradually increasing. This suggests that investors are holding onto their TON, potentially with an eye on future gains.

Additionally, the dormant circulation, representing tokens that haven’t been moved in a while, has remained low. While a previous spike coincided with a price peak, the current stability could indicate a more strategic accumulation by investors.


Technical Analysis: Eyes On The Prize For Toncoin

Technical analysts, who study price charts and historical data to predict future movements, are also cautiously optimistic about TON. Fibonacci retracement levels, a popular technical tool, suggest the recent downtrend may be nearing its end. This could pave the way for TON to climb towards targets near $10, with potential profit-taking opportunities for investors.

A Marathon, Not A Sprint

While the recent surge in price and social media buzz paints a promising picture for TON, it’s crucial to remember that the cryptocurrency market remains highly volatile.

The current uptrend for TON could be the beginning of a long-term ascent, fueled by growing adoption and a thriving ecosystem within the Telegram network. However, it’s also possible that this is just a short-lived rally, followed by a correction.

Featured image from Medjan, chart from TradingView

Is The Crypto Winter Thawing? US Bitcoin ETFs Record First Inflows In Weeks – Coinshares

After experiencing outflows for four consecutive weeks, US spot Bitcoin exchange-traded funds (ETFs) have marked a notable shift in momentum, witnessing net inflows once again.

According to recent data from CoinShares, digital asset investment products have seen inflows totaling $130 million for the first time in five weeks.

This change suggests renewed investor interest in crypto-focused investment products, particularly in the United States, where most of these inflows, totaling over $130 million, occurred.

A Mixed Bag Of Global Investment Flows

Grayscale, a major player in the digital asset space, reported a significant decrease in weekly outflows, recording its lowest since January at $171 million. This trend indicates a potential stabilization in the market after a period of volatility and declining interest.

Meanwhile, interaction between US regulators and spot ETF issuers has remained minimal, particularly for spot Ethereum ETF applications.

This lack of engagement has fuelled speculation that approval for these ETFs might not be approaching, as reflected by the amount of outflows from Ethereum-based products. James Butterfill, Head of Research at Coinshares, particularly noted:

Low interaction by the US regulators with ETF issuer applications for a spot Ethereum ETF have increased speculation that the ETF approval is not imminent, this has been reflected in outflows which totalled US$14m last week.

On a global scale, the investment landscape showed mixed signals. After a week of record inflows likely driven by “seed capital” post-Bitcoin ETF launches, as highlighted by Butterfill, Hong Kong saw a significant drop to $19 million in inflows.

Conversely, Switzerland experienced inflows amounting to $14 million. Canada and Germany continued to see outflows, with their year-to-date figures reaching a combined $660 million, indicating sustained bearish sentiment in these markets.

Bitcoin has rebounded with $144 million in inflows, counteracting a generally “weak month.” In contrast, short-Bitcoin exchange-traded products (ETPs) recorded outflows totaling $5.1 million, up to $18 million over the last eight weeks.

These figures highlight the volatile dynamics within the crypto market, with Bitcoin currently showing stronger performance than Ethereum.

Bitcoin And Ethereum Market Performance

Over the past 24 hours, Bitcoin surged nearly 3%, while Ethereum increased by only 1.2%. Despite these gains, both assets are down by 2.3% and 6% over the past week.

Bitcoin (BTC) price chart on TradingView

Amidst these market movements, crypto analyst Ali provided insights into Bitcoin’s potential paths. According to Ali, Bitcoin could climb to $76,000 if it reclaims $64,290 as a support level.

Failing to achieve this could see the flagship crypto drop to support at $51,970, based on Market Value To Realized Value (MVRV) extreme deviation pricing bands, identifying this figure as the all-time mean.

Featured image from Unsplash, Chart from TradingView

Gaming The System: Pundit Reveals Why XRP Price Will Reach $33

A crypto analyst has predicted a substantial bullish surge for the the XRP price in the future. According to the analyst, XRP is gearing up for a substantial increase to $33.5 from an initial price of $0.50. He expects the price of the cryptocurrency to explode by 6600% in this current market cycle.

Analyst Forecasts Exponential Rise In XRP Price

In a recent X (formerly Twitter) post, a crypto analyst identified as ‘Egrag Crypto,’ revealed a series of bullish price targets for XRP in the near future. The analyst focused his predictions on a technical analysis called “the Line of Hestia.” 

Related Reading: US Mega Banks JP Morgan And Wells Fargo Unveil Bitcoin Exposure As BTC Drops To $60,000

Egrag Crypto’s latest findings suggest that XRP could rise to $33.5 if it touches the Line of Hestia, a technical indicator featuring an ascending trend line which signals a potential upsurge for the price of a cryptocurrency. According to the analyst, “Historical data indicates that every time the XRP price touches the “Line of Hestia,” it experiences significant price pumps.” 

This implies that there may be a correlation between XRP’s bullish price movements and the ascending trend line. Egrag Crypto also revealed that following this historical pattern, XRP has witnessed pumps ranging from 6600%,1444%, 100%, 80%, and 171%. 

Given the established trend, Egrag Crypto predicts XRP’s ascent to new all-time highs. He calculated the average percentage increase of XRP’s price each time it touched the Line of Hestia, dividing the sum by the total number of occurrences, which is five. 

Using this data, the crypto analyst estimates that if XRP were to experience a 6600% increase, its future price would be $33.50. Similarly, he calculated new prices for XRP based on the previous percentages.

It’s important to note that the price of XRP, at the time of writing, is trading at $0.5. The cryptocurrency has been recording considerable declines over the past year, consolidating around the $0.5 price mark for months. According to CoinMarketCap, XRP has also recorded a 7.35% decrease over the past seven days and a 0.08% decline in the last 24 hours. 

Although Egrag Crypto has remained optimistic about XRP’s future price, other crypto community members have expressed skepticism over the analyst’s ambitious forecast. A few community members have denied the prediction, emphasizing that the cryptocurrency’s surge to $33.5 during this cycle was highly unlikely. 

Possible Price Correction Ahead Of Projected Surge

In one of his most recent X posts, Egrag Crypto disclosed that XRP could witness a major price correction before experiencing a significant rally. The analyst has urged crypto investors to remain cautious of the cryptocurrency unless the XRP/BTC ratio closes above the $0.00010 threshold. 

Related Reading: Is The Bitcoin Bottom In? Buy The Dip Sentiment Erodes Amid Drop Toward $60,000

Egrag Crypto anticipates a potential 45% decline for XRP/BTC, emphasizing that this substantial price drop could indicate a bottom between $0.0000055 and $0.0000077. However, he also disclosed that overcoming resistance at $0.00001 would be crucial for a rebound in XRP.  

XRP price chart from Tradingview.com

Aptos Posts Triple-Digit Gains In Key Metrics, Yet APT Price Struggles At $8.40

According to a report by Messari, Layer 1 (L1) blockchain Aptos experienced substantial gains in key metrics during the first quarter (Q1) of the year. The growth was driven by the surge in Bitcoin prices to new record highs and increased capital inflow in the market. 

However, Aptos’ native token, APT, has struggled with price performance, recording modest gains compared to other top cryptocurrencies.

Aptos Network Activity Surges

The report highlighted that Aptos’ circulating market cap increased 127% quarter-on-quarter (QoQ) to $6.6 billion.

This growth outpaced other projects with similar market caps, improving market cap rank from 33 to 22. Despite this growth, APT’s price experienced a more modest increase of 76% QoQ. 

Aptos

Aptos revenue, which encompasses all fees collected by the protocol, grew by 37% to $475,000. However, when denominated in APT, the revenue decreased by 10%. All revenue generated by Aptos is burned, but these burned tokens have not significantly reduced inflation. 

APT inflation started at a 7% annualized rate and is set to decrease by 1.5% each year until it reaches 3.5%. By mid-October, the inflation rate had reduced to just under 6.9%. Additionally, there was inflationary pressure from the genesis supply unlocks, with almost 31% of the genesis supply distributed by the end of Q1.

Looking at network activity, Aptos witnessed a significant increase in transactions and active addresses in Q1. Average daily transactions and addresses saw 66% and 97% QoQ growth rates, respectively. 

Despite the increased transaction activity, the average transaction fee decreased by 45% QoQ to 0.0006 APT ($0.007). Furthermore, average daily new addresses grew by 91% QoQ to 44,000, and the weighted average one-month retention rate increased by 82% QoQ to 14%.

APT Staked Tokens Decrease 5%

Regarding staking, APT staked decreased by 5% to 861 million tokens. However, when denominated in USD, the staked market cap grew by 68% QoQ, surpassing $14 billion. 

Aptos

As seen in the chart above, Aptos also experienced growth in its decentralized finance (DeFi) total value locked (TVL), which increased by 376% QoQ to $573 million.

According to Messari, this increase was not solely due to APT price appreciation; TVL also grew by 170% QoQ in APT terms. Additionally, Aptos’s stablecoin market cap nearly doubled QoQ, reaching $97 million.

APT Struggles To Break $8.80 Resistance

Despite these positive developments, APT’s price performance has faced challenges. The native token has declined over 16% in the past month, resulting in a modest 2.7% surge year-to-date. This contrasts with the double or triple-digit gains seen by other top cryptocurrencies.

Aptos

Currently trading at $8.46, APT has struggled to surpass its nearest resistance wall at $8.80, leading to a consolidation phase between $8.20 and $8.70 over the past month. 

Featured image from Shutterstock, chart from TradingView.com