Vertex AI Price Forecast: Bitcoin Has 60% Chance Of Hitting $100,000, Key Predictions Unveiled

On-chain analytics firm Spot On Chain’s team of analysts, using Google Cloud’s Vertex artificial intelligence (AI), has conducted an in-depth analysis to forecast the future price of Bitcoin (BTC). 

Their latest report provides valuable insights into the leading cryptocurrency’s short-, medium-, and long-term outlook.

Bitcoin Price Forecasts

According to Spot On Chain’s report, Bitcoin prices are expected to fluctuate between $56,000 and $70,000 during May, June, and July 2024. 

This projected range indicates the potential for market volatility, with a 48% probability assigned to the scenario where BTC prices may dip below $60,000. Moreover, the report advises a cautious approach, acknowledging the possibility of short-term fluctuations or corrections in the price.

Spot On Chain’s analysis reveals a significant movement in the latter half of 2024, with a compelling 63% probability of Bitcoin reaching $100,000. 

This mid-term projection reflects a prevailing bullish sentiment in the market, further fueled by anticipated rate cuts after the Federal Open Market Committee’s (FOMC) December 2023 meeting. 

These rate cuts aim to bring the federal funds rate down to 4.6% and are expected to boost demand for risk-on assets such as stocks and Bitcoin.

Looking ahead to the first half of 2025, Spot On Chain’s modeling indicates a strong probability that Bitcoin will cross the $150,000 threshold. Specifically, a 42% probability is assigned to this scenario, indicating a bullish outlook for Bitcoin’s price trajectory.

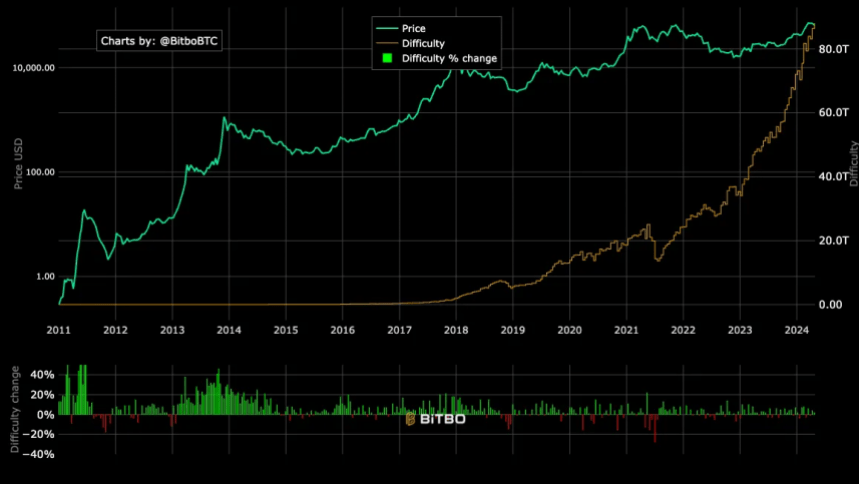
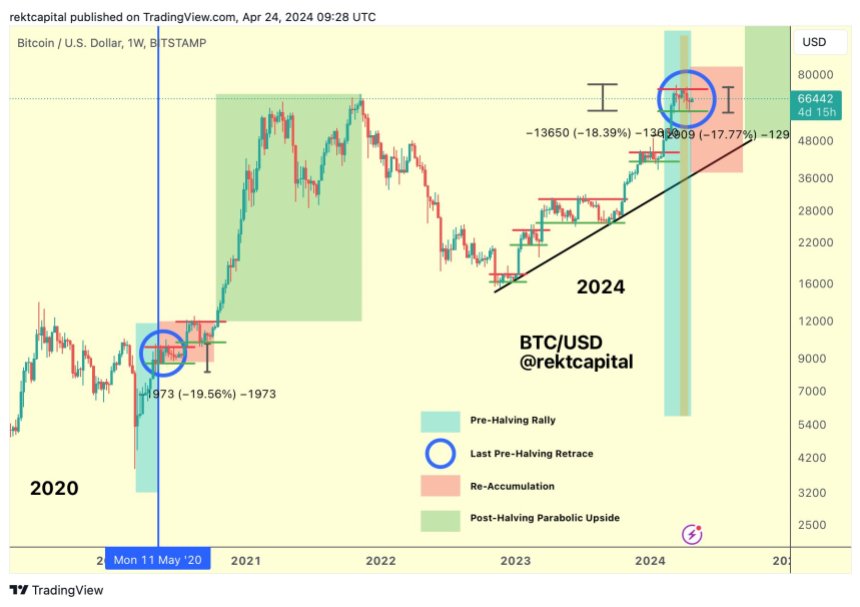
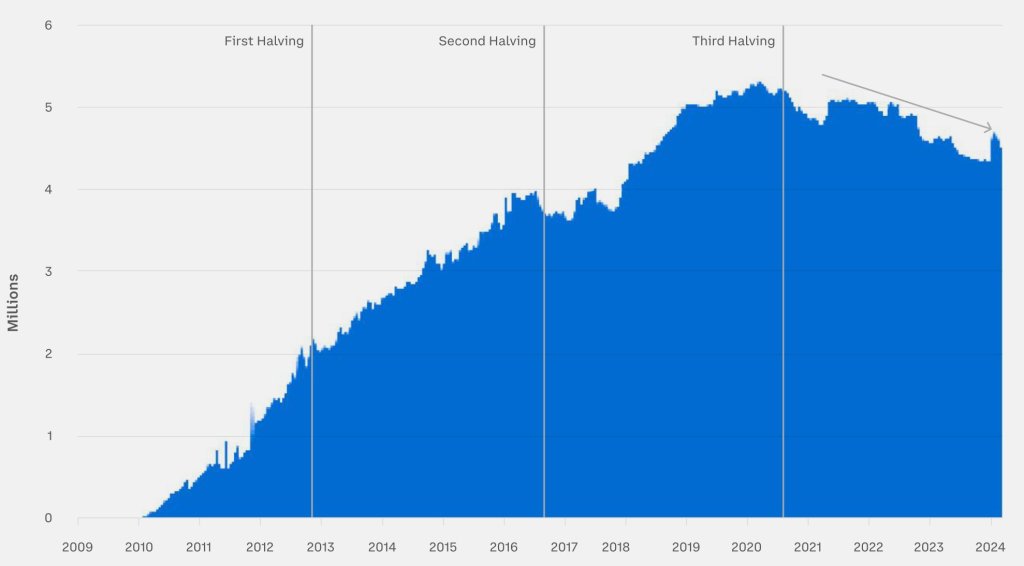
What’s more, looking at the entire year of 2025, the probability of Bitcoin exceeding $150,000 rises to an eye-popping 70%. Based on historical data and patterns in previous cycles, Bitcoin reached a new all-time high approximately 6 to 12 months after the Halving event

Price Consolidation On The Horizon?

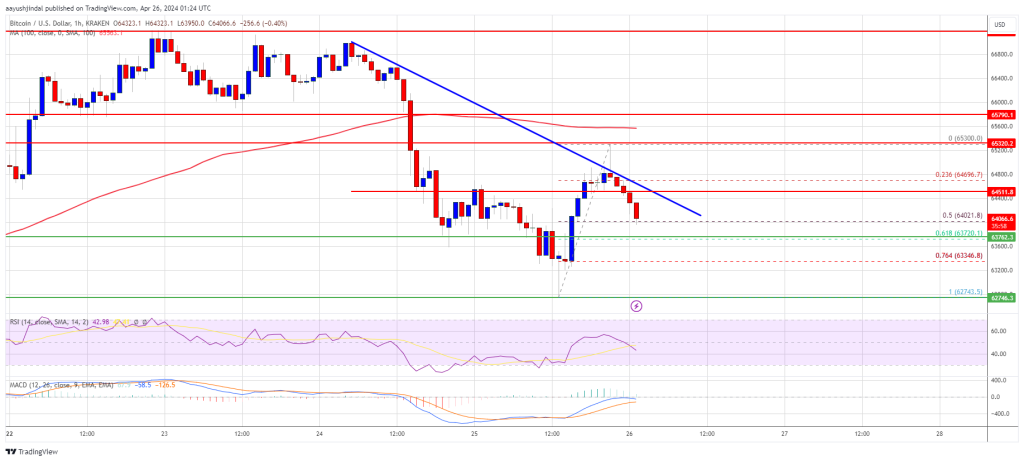
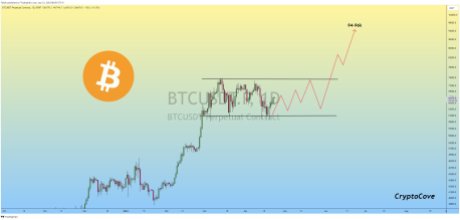
Crypto analyst Retk Capital has also provided insights into the current Bitcoin price action, shedding light on key resistance levels and the potential for a consolidation phase before an anticipated parabolic upside.

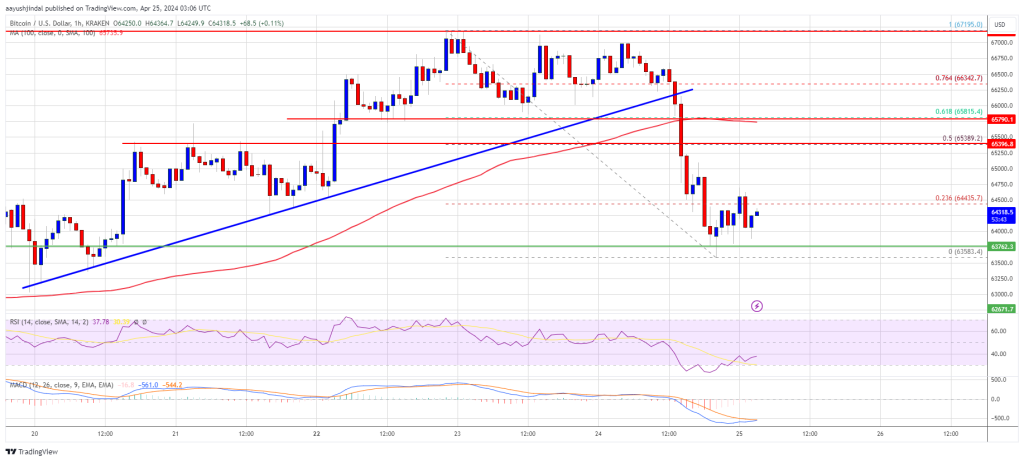
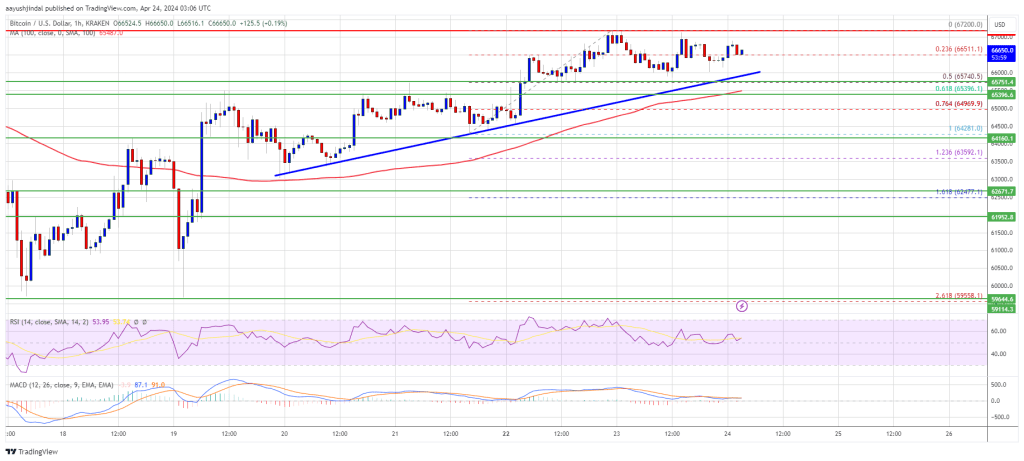
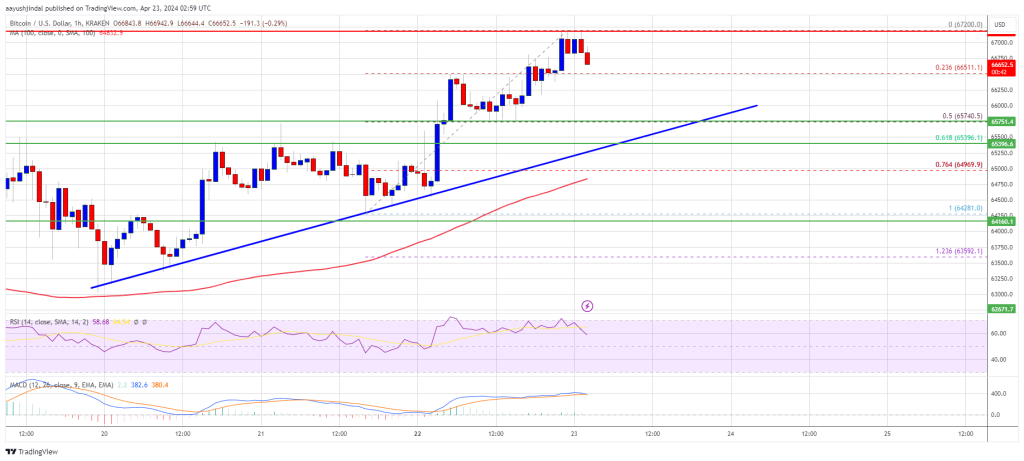
According to Retk Capital’s analysis, Bitcoin has consistently been rejected from the $65,600 resistance level, failing to regain it as a support level. 

This resistance zone has significantly impeded Bitcoin’s upward movement in recent days, as seen on the cryptocurrency’s daily BTC/USD chart below. 

Bitcoin

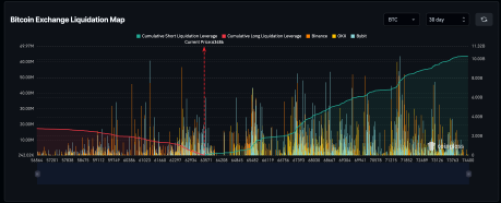
Retk Capital further highlights that Bitcoin has been witnessing downside wicks into a pool of liquidity at approximately $60,600. This occurrence has been observed over multiple weeks, indicating the presence of buyers in that price range. 

If Bitcoin experiences further downward movement, the analyst believes that there is a possibility that it may approach this area once again. The analyst further notes:

Price dropping without context can be emotionally challenging. However, understanding that this downside is part of the consolation within a technical range-bound structure that will precede Parabolic Upside makes this experience much more comforting.

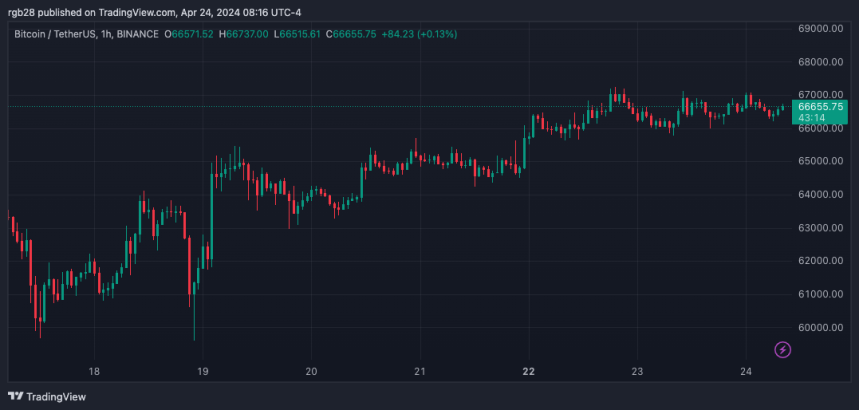
As of this writing, BTC is trading at $63,900, down nearly 8% over the past two weeks and the same percentage over the past 30 days.

Featured image from Shutterstock, chart from TradingView.com

Bitcoin Price Turns Red And At Risk of More Downsides Below $63K

Bitcoin price failed to recover above the $65,500 resistance. BTC is again moving lower and there is a risk of more downsides below $63,000.

  • Bitcoin started another decline after it failed to surpass the $65,500 resistance zone.
  • The price is trading below $64,500 and the 100 hourly Simple moving average.
  • There is a connecting bearish trend line forming with resistance at $64,500 on the hourly chart of the BTC/USD pair (data feed from Kraken).
  • The pair could accelerate lower if there is a daily close below the $63,000 support zone.

Bitcoin Price Faces Hurdles

Bitcoin price started a recovery wave from the $62,750 support zone. BTC was able to climb above the $64,000 and $64,500 resistance levels. However, the price failed to clear the $65,500 resistance zone.

A high was formed at $65,300 and the price started another decline. There was a move below the $64,500 level. The price tested the 50% Fib retracement level of the recovery wave from the $62,743 swing low to the $65,300 high.

Bitcoin is now trading below $64,500 and the 100 hourly Simple moving average. There is also a connecting bearish trend line forming with resistance at $64,500 on the hourly chart of the BTC/USD pair.

Immediate resistance is near the $64,500 level or the trend line. The first major resistance could be $65,350 or $65,500. A clear move above the $65,500 resistance might send the price higher. The next resistance now sits at $66,200.

Bitcoin Price

Source: BTCUSD on TradingView.com

If there is a clear move above the $66,200 resistance zone, the price could continue to move up. In the stated case, the price could rise toward $67,000. The next major resistance is near the $67,400 zone. Any more gains might send Bitcoin toward the $68,800 resistance zone in the near term.

More Losses In BTC?

If Bitcoin fails to rise above the $64,500 resistance zone, it could continue to move down. Immediate support on the downside is near the $64,000 level.

The first major support is $63,750 or the 61.8% Fib retracement level of the recovery wave from the $62,743 swing low to the $65,300 high. If there is a close below $63,750, the price could start to drop toward $62,750. Any more losses might send the price toward the $61,200 support zone in the near term.

Technical indicators:

Hourly MACD – The MACD is now gaining pace in the bearish zone.

Hourly RSI (Relative Strength Index) – The RSI for BTC/USD is now below the 50 level.

Major Support Levels – $64,000, followed by $63,750.

Major Resistance Levels – $64,500, $65,350, and $66,200.

Bitcoin Bears Risk Losing $7.2 Billion If BTC Price Reaches This Level

The Bitcoin price continues to fluctuate wildly after crashing from its all-time high price above $73,000. This has triggered a wave of bearish sentiment in the market, causing a large number of crypto traders to go short on the pioneer cryptocurrency. As a result, these bears lose, risking a large amount if the Bitcoin price resumes its bullish rally.

Bears Will Lose $7.2 Billion If Bitcoin Reclaims All-Time High

In a post shared on X (formerly Twitter), crypto analyst Ash Crypto revealed an interesting trend concerning Bitcoin that has been developing. The screenshot shared shows that a large number of short trades have been placed on BTC, with the expectation that the price could continue to fall.

Now, so far, these bulls look to be right as Bitcoin has failed to successfully clear $67,000. However, they stand to lose a lot of money if BTC is able to clear this resistance and resume upward. According to Ash Crypto, there is over $7.2 billion worth of BTC shorts which risk liquidation if Bitcoin were to reach a new all-time high price above $74,000.

At the time, the Bitcoin price had recovered above $66,000, spurring a flurry of bearish activity in the market. However, these bears seem to have succeeded, as the BTC price has fallen below $64,000 at the time of writing.

As a result, bears have been emboldened, with the expectation that the Bitcoin price will still from here. So far, the liquidation trends risks have continued to rise as the BTC price falls. Data from Coinglass shows that if Bitcoin were to recover above $44,000 and reach a new all-time high, bears stand to lose over $10 billion.

Bitcoin

BTC Bulls Are Not Giving Up

Even though Bitcoin bears seem to be making bank with the price of Bitcoin falling, the bulls are far from done. Rather, they have been using this price decline as an opportunity to fill up their bags. This accumulation has been even more prominent among Bitcoin whales, who have picked up 1.4% of the total supply in the last month.

On-chain data tracker Santiment reported that in the last four weeks, Bitcoin whales have added 266,000 BTC to their balance. The cohort responsible for this are those holding between 1,000 and 10,000 BTC, making them the mega whales. In total, they spent $17.8 billion on buying BTC in just one month.

As a result of this accumulation, these 1,000-10,000 BTC whales now hold 25.16% of all BTC in existence. Their numbers are also on the rise, with Santiment identifying this as the “Highest crowd bullish bias since all-time high week in early March.”

For now, Bitcoin continues to struggle with the bears to hold the $63,000 support. Its price is down 4.05% in the last day to trade at $63,600, at the time of writing.

Bitcoin price chart from Tradingview.com

Renowned Economist Reveals What Will Happen If Bitcoin Can’t Hold $60,000

Chief economist and Bitcoin critic, Peter Schiff has issued a somber prediction regarding the world’s largest cryptocurrency, Bitcoin. The financial expert has cautioned investors of the potential repercussions should BTC drop below critical resistance levels.

Economist Predicts Bitcoin Price Decline

In a recent X (formerly Twitter) post, Schiff shared a price chart of Bitcoin against the United States Dollar (USD), pinpointing Bitcoin’s price at the time of the post at $63,814, alongside key support levels around $60,000. The economist has argued that Bitcoin’s current price position was not conducive for HODLers

Emphasizing the importance of BTC maintaining a stronghold above $60,000, Schiff urged investors to proceed with caution and hope that the cryptocurrency successfully sustains support levels. He also predicted that if Bitcoin failed to hold critical support levels, a substantial price decline would be inevitable. 

While Schiff’s predictions may appear to align with his usual skepticism towards Bitcoin, the timing of his warnings coincides with a period of heightened uncertainty and volatility surrounding Bitcoin’s price. 

The cryptocurrency is currently trading at $63,909, marking a notable decrease from its previous all-time high of over $73,000 before the halving event. Data from CoinMarketCap has revealed a series of declines, with Bitcoin experiencing a 3.75% drop in the last 24 hours and a 4.38% decrease over the past month. 

This underscores the uncertain price condition of the pioneer cryptocurrency, hinting at the possibility of further declines unless the cryptocurrency makes a quick price correction. 

Schiff has stated that while experienced Bitcoin holders are accustomed to large price drops and periods of volatility, new investors who have recently entered the Spot Bitcoin Exchange Traded Fund (ETF) market should be prepared for a “rude awakening.”

Crypto Analyst Says Potential Upsurge In Store For BTC

On Monday, April 22, prominent crypto analyst, Ali Martinez shared insights on Bitcoin’s future price trajectory in an X post. Martinez noted that the price of Bitcoin was steadily rising, aiming to secure new highs around $66,000. 

The crypto analyst predicts that if Bitcoin can successfully break past key support levels at $66,000, the cryptocurrency’s next critical resistance level would be between $69,900 and $71,200. Despite this optimistic forecast, Martinez has also warned investors about a potential pullback, emphasizing the importance of exercising caution and closely monitoring Bitcoin’s price if it falls below $65,500.

With Bitcoin currently priced at $63,909, it has fallen notably below the key support level highlighted by Martinez. This continuous price decrease could be attributed to recent trends indicating that Bitcoin’s accumulation score has dropped to zero. This suggests that whales may be moving away from the pioneer cryptocurrency or refraining from accumulating Bitcoin at its present price level. 

Is Bitcoin’s Rally Over? Leverage Drops As Halving Highs Fade: Report

Recent trends in the crypto market have indicated a notable shift in trader behavior, particularly among those investing in Bitcoin.

Using data from CryptoQuant, Bloomberg has revealed that the Bitcoin funding rate—the cost for traders to open long positions in Bitcoin’s perpetual futures—has turned negative for the first time since October 2023.

Bitcoin Funding Rates

This change suggests a “cooling interest” in leveraging bullish bets on Bitcoin, coinciding with the fading impact of major market drivers.

Bitcoin Market Dynamics Post-Halving

The decline in Bitcoin’s funding rate correlates with a reduction in net inflows to US spot Bitcoin Exchange-Traded Funds (ETFs), which previously pushed the cryptocurrency to record highs.

Despite the anticipation surrounding the Bitcoin Halving—an event reducing the reward for mining new blocks and theoretically lessening the supply of new coins—the price impact has been surprisingly muted.

According to Bloomberg, this subdued response has compounded the effects of broader economic factors, such as geopolitical tensions and changes in monetary policy expectations, leading to increased risk aversion among investors.

Following the latest Bitcoin halving, the market has not seen the bullish surge many expected. Instead, Bitcoin has only seen a correction of over 10%, from its all-time high (ATH) in March with prices stabilizing in the $63,000 region, at the time of writing.

Bitcoin (BTC) price chart on TradingView

As CryptoQuant’s Head of Research Julio Moreno pointed out, the recent downturn in Bitcoin’s funding rates to below zero underscores a “decreased eagerness” among traders to take long positions.

According to Bloomberg, this trend is supported by a significant drop in daily inflows to US spot Bitcoin ETFs and a reduction in open interest in Bitcoin futures at the Chicago Mercantile Exchange (CME), which indicates a broader cooling of enthusiasm for crypto investments.

In a Bloomberg report, K33 Research analyst Vetle Lunde noted that the “current streak of neutral-to-below-neutral funding rates is unusual,” suggesting that the market might be entering a price-consolidation phase.

Notably, this period of reduced leverage activity could potentially lead to further price stabilization, but it also raises questions about the near-term prospects for Bitcoin’s recovery.

Adjustments In Mining Difficulty And Market Implications

Interestingly, alongside these market adjustments, Bitcoin’s mining difficulty has increased for the first time immediately following the fourth halving.

The difficulty adjustment, which occurs every 2016 block, increased by 2%, reaching a new high of 88.1 trillion, according to Bitbo data.

Bitcoin Mining Difficulty History Chart.

This adjustment contradicts past trends where the difficulty typically decreased post-halving due to reduced profitability pushing less efficient miners out of the market.

This anomaly in mining difficulty suggests that despite lower rewards post-Halving, miners remain active, possibly buoyed by more efficient mining technologies or strategic shifts within mining operations.

This resilience in mining activity could help sustain the network’s security and processing power. Still, it reflects the complexities of predicting Bitcoin’s market dynamics solely based on historical halving outcomes.

Featured image from Unsplash, Chart from TradingView

Bitcoin Price Trims Gains Amid War Escalation, Can Bulls Save The Day?

Bitcoin price failed to clear the $67,000 resistance. BTC trimmed gains and is now struggling to stay above the $63,650 support zone.

  • Bitcoin started another decline after it failed to surpass the $67,200 resistance zone.
  • The price is trading below $65,000 and the 100 hourly Simple moving average.
  • There was a break below a key bullish trend line with support at $66,200 on the hourly chart of the BTC/USD pair (data feed from Kraken).
  • The pair could correct higher, but the bears might remain active near the $65,500 zone.

Bitcoin Price Dips Again

Bitcoin price struggled to clear the $67,000 and $67,200 resistance levels. BTC formed a short-term topping pattern and started a fresh decline below the $66,000 level.

There was a move below the $65,500 support. Besides, there was a break below a key bullish trend line with support at $66,200 on the hourly chart of the BTC/USD pair. The pair even spiked below $63,650. A low was formed at $63,583 and the price is now consolidating losses.

Bitcoin price is now trading below $65,500 and the 100 hourly Simple moving average. Immediate resistance is near the $64,500 level or the 23.6% Fib retracement level of the downward move from the $67,195 swing high to the $63,583 low.

The first major resistance could be $65,350 or the 50% Fib retracement level of the downward move from the $67,195 swing high to the $63,583 low. A clear move above the $65,350 resistance might send the price higher. The next resistance now sits at $65,850. If there is a clear move above the $65,850 resistance zone, the price could continue to move up. In the stated case, the price could rise toward $67,000.

Bitcoin Price

Source: BTCUSD on TradingView.com

The next major resistance is near the $67,200 zone. Any more gains might send Bitcoin toward the $68,800 resistance zone in the near term.

More Losses In BTC?

If Bitcoin fails to rise above the $65,350 resistance zone, it could continue to move down. Immediate support on the downside is near the $63,500 level.

The first major support is $62,600. If there is a close below $62,600, the price could start to drop toward $61,200. Any more losses might send the price toward the $60,000 support zone in the near term.

Technical indicators:

Hourly MACD – The MACD is now losing pace in the bearish zone.

Hourly RSI (Relative Strength Index) – The RSI for BTC/USD is now below the 50 level.

Major Support Levels – $63,500, followed by $62,600.

Major Resistance Levels – $65,350, $65,850, and $67,000.

Old Bitcoin Whales Moving Coins: Will This Help Push BTC Above $74,000?

While Bitcoin struggles to extend gains, on-chain data shared by Ki Young Ju, the founder of CryptoQuant, on X shows increased movement of old coins. As the Bitcoin Average Dormancy chart shows, this trend recently hit a 13-year high. 

More Old Whales Moving Coins

The Bitcoin Average Dormancy shows the average number of days each BTC has been dormant. On-chain data indicates that coins held for 3 to 5 years have changed hands and moved to new owners. 

BTC dormancy chart | Source: CryptoQuant

While there was movement, interestingly, data shows that they were not transferred to exchanges. Instead, it is highly likely that they were traded over the counter (OTC).

Usually, any transfer to centralized exchanges like Binance or Coinbase could suggest the intention of selling. The more coins hit these exchanges, especially from whales, the higher the chance of price dumping. However, if trades are made via OTC, the impact on spot rates is negligible, which is a positive for bulls.

Further analysis of these transfers using the Spent Output Profit Ratio (SOPR) indicator suggests that whales moving them made decent profits. Historically, whenever whales dump and register profits, prices tend to dip.

Will Bitcoin Prices Retest All-Time Highs

However, in a post on X, one analyst says prices will likely increase because of the impact of spot Bitcoin exchange-traded funds (ETFs). These derivatives are like a buffer against price drops, considering the pace of inflows in the past weeks.

Spot ETFs allow institutions to gain regulated exposure to BTC. Coupled with decreasing outflows from GBTC, the odds of prices rising remain elevated. 

According to Lookonchain data, GBTC unloaded 750 BTC on April 23. However, Fidelity and other eight spot ETF issuers bought 1,513 BTC on behalf of their clients. Spot Bitcoin ETF issuers sell shares representing BTC holdings. These coins can be purchased from secondary markets like Binance, via OTC platforms, or directly from miners. 

Spot Bitcoin ETF flow data | Source: Lookonchain

BTC prices remain muted and capped below $68,000, representing April 13 highs.

To define the uptrend, there must be a high volume expansion above this liquidation line, reversing recent losses. 

Bitcoin price trending downward on the daily chart | Source: BTCUSDT on Binance, TradingView

Even so, looking at the BTCUSDT candlestick arrangement in the daily chart, bulls must break above all-time highs for a clear trend continuation. Ideally, the uptick above $73,800 and the current range should be with expanding volumes, confirming the presence of buyers.

Bitwise CIO Unveils 5 Major Forecasts For Bitcoin 2028 Halving, Anticipates A 280% Price Surge

Bitwise Chief Information Officer (CIO) Matt Hougan recently shared five interesting predictions for the next Halving of the Bitcoin (BTC) network, scheduled for 2028. In a comprehensive report, Hougan sheds light on the potential transformations for the world’s leading cryptocurrency.

New Investors And ETFs As Catalysts

One of Hougan’s key predictions is that Bitcoin’s volatility will significantly decline by 50%. He argues that the entry of new investors through the spot Bitcoin exchange-traded fund (ETF) market will drive this decline. 

Hougan said that as financial advisors, family offices, and institutions enter the Bitcoin market, their different investment behaviors – such as portfolio rebalancing and steady drip investments – could introduce counter-cyclical flows, ultimately dampening Bitcoin’s volatility.

Hougan’s second prediction revolves around the allocation of Bitcoin in portfolios. He believes that 5% allocations to Bitcoin will become commonplace in target-date portfolios. As BTC’s volatility decreases and becomes more attractive to institutional investors, Hougan expects a rise in typical portfolio allocations. 

The Bitwise CIO predicts that Bitcoin ETFs will attract over $200 billion in inflows. He highlights their impressive growth and cites their status as the fastest-growing new ETF category of all time. 

Hougan suggests that the ETF market is still in its early stages, with national wirehouses and institutions just beginning their due diligence. Drawing parallels with the rise of gold ETFs, which experienced year-after-year growth in net flows, he anticipates a similar trend for Bitcoin ETFs.

Bitcoin Price Path Toward $250,000

In an intriguing projection, Hougan suggests that central banks will allocate funds to Bitcoin before the next Halving event. He notes that central banks have historically been significant investors in gold, accumulating substantial amounts of the metal. 

However, with Bitcoin’s characteristics as non-debt money and its functional advantages over gold regarding payments and settlement, Hougan believes central banks will be increasingly drawn to Bitcoin. Hougan further noted on this matter:

There is also an element of game theory here. A major central bank adopting Bitcoin as a reserve asset would be a game-changer for Bitcoin and, I believe, would contribute to a dramatic increase in prices. Will one central bank try to front-run the others? 

Hougan’s final prediction revolves around Bitcoin’s price. He forecasts that Bitcoin will trade above $250,000 by 2028, an increase of nearly 280% from current levels. 

The Bitwise CIO attributes Bitcoin’s previous exponential growth to its transition from a speculative asset to one with real-world utility. 

Factors such as declining volatility, improved custody options, low correlations to traditional stocks, enhanced accessibility through ETFs, and growing institutional adoption all contribute to Hougan’s optimism regarding Bitcoin’s future progress. Hougan concluded by stating:

With the ETFs launched and gathering assets—and major Wall Street firms lining up behind bitcoin—I suspect the asset will continue to move further into the mainstream. At $250,000, bitcoin would be a $5 trillion asset. Could it go higher? Of course. But $250,000 would represent solid progress between halvings, and I think we’ll see at least that.

Bitcoin

Currently trading at $64,500, BTC is down nearly 3% in the past 24 hours after retesting the $67,000 mark on Tuesday and failing to consolidate above that level.  

Featured image from Shutterstock, chart from TradingView.com

Is Bitcoin Getting Ready For An Explosive Breakout? These Analysts Believe So

The fluctuations in Bitcoin’s price have marked the tempo of the crypto market and the community’s sentiment. While some feel pessimistic about the rally slowdown, some analysts believe the flagship cryptocurrency is just getting ready to reach higher notes.

Next Stop: Bitcoin’s “Parabolic Upside”

Crypto analyst and trader Rekt Capital considers Bitcoin (BTC) is currently awaiting a period of consolidation. In an X post, the trader highlighted that, during the previous “Halvings,” BTC saw “Re-Accumulation Ranges.”

The analyst shared his chart for Bitcoin phases during the “Halving,” which he has previously used to explain BTC was at the “Last Pre-Halving Retrace” before April 19.

At the time, the analyst pointed out that the re-accumulation phase was next. Bitcoin went through one during the previous “Halving,” as seen in the chart.

The re-accumulation consisted of two consolidation periods followed by the “Post-Halving Parabolic Upside,” which saw BTC reach last cycle’s all-time high (ATH) of $69,000.

Bitcoin, BTC

Rekt Capital highlighted that, during this cycle, the flagship cryptocurrency has already experienced five re-accumulation ranges. Similarly to the last cycle, the latest re-accumulation phase seems to have started during the “Pre-Halving Rally” phase. Per the analyst, this will be followed by the “Parabolic Upside” if history repeats itself.

Analyst Mikybull seems to share a similar view to Rekt Capital’s, as he highlights that Bitcoin’s “parabolic rally is loading.” The re-accumulation breakout is set to be “explosive,” and “not many are prepared for this,” he added.

The analyst explained that “the RSI on a macro scale is at the same level as it was in 2017, which was followed by a huge rally to cycle top.” Based on this, he believes the current consolidation comes from institutions preparing “for a huge rally to cycle top.”

Analyst Sets Crucial Level For Bitcoin’s Breakout

A day before Bitcoin’s “Halving,” the cryptocurrency faced a correction that shredded 7% of its price in a few hours. BTC went from hovering between the $64,000-$63,000 price range to trading below the $60,000 support zone.

Since then, the largest cryptocurrency by market capitalization appears to have steadily recovered from the drop. Over the weekend, Bitcoin regained the $65,000 support level before testing the $66,000 one, which it reclaimed on Monday.

Over the last few days, BTC has hovered between $66,000 and $67,000. However, it has not been able to successfully test the resistance level set at the $67,000 price range.

According to the crypto analyst Bluntz, Bitcoin’s most recent performance suggests that the price will continue to move sideways between the $66,000 and the $67,000 range.

However, he also considers that BTC is “gagging for a breakout soon,” as the chart displays a bullish pennant pattern forming. Per the analyst, “once we clear 67k,” the whole market will fly above the latest ATH.

As of this writing, Bitcoin is trading at $66,665, a 7.5% increase from a week ago and a 66.22% in the last three months.

BTC, BTCUSDT, Bitcoin

Analysts Identify Key Scenario For Bitcoin Hitting $100,000

Prior to the Bitcoin Halving event, BTC’s price saw considerable instability, but it has since rebounded, reaching the $66,000 level, triggering bullish predictions from top crypto analysts regarding the coin’s future path.

Captain Faibik, a crytocurrency analyst and trader, has emerged with an intriguing prediction, underscoring a narrative that could potentially propel the price of Bitcoin to the coveted $100,000 mark in the upcoming months.

Bitcoin Poised For A Notable Rally To $100,000 

According to Captain Faibik, Bitcoin has managed to hold the $60,000 support level in the wake of bullish investors in the market. As a result, the largest crypto asset by market cap is currently making a strong comeback.

These bullish investors, according to Faibik must reclaim the crucial $72,000 resistance level in order to see a major rally to the $100,000 price level. This scenario acts as a ray of hope for the cryptocurrency community, igniting speculations and influencing projections about Bitcoin’s potential for future growth. Given the anticipated impact of the Bitcoin Halving and bulls, the $72,000 level could be realized in the short term.

Bitcoin

The expert previously highlighted that the Bitcoin weekly candle closed above the Exponential Moving Average (EMA) 10, demonstrating that the bulls are still very much in charge of the market. Following the Descending Channel break out in October last year, BTC Bulls has firmly secured the weekly EMA10, prompting the crypto analyst to put his next price target for the digital asset at $100,000.

Faibik also noted that the daily Relative Strength Index (RSI) for Bitcoin has emerged from a falling wedge pattern. This breakout suggests that a 15% to 20% bullish rally in Bitcoin’s value is on the horizon.

Meanwhile, in the daily timeframe, a bullish flag formation is underway, and in the event of an upward breakout from the bullish flag, Faibik anticipates a new all-time high for Bitcoin by May.

Is A $1.5 million Price Level Possible For BTC?

One of the most bullish predictions for Bitcoin this year came from Ark Invest Chief Executive Officer (CEO) Cathie Wood. The CEO foresees the digital asset to rise by over 2,000% reaching a whopping $1.5 million by 2030.

During an interview in Hong Kong, Wood reiterated her projections for BTC, which were supported by a thorough investigation that included institution surveys and evaluations of market volatility.

She stated:

I have been asked this question from different angles, and our analysis from multiple perspectives indicates that by 2030, Bitcoin could rise to $1.5 million. This price prediction is based on a survey of institutions, using a discount rate and volatility analysis.

Initially, Wood’s forecast for Bitcoin was estimated at $600,000 in the next six years. However, considering the effect of the Bitcoin Spot Exchange-Traded Funds (ETFs), she now believes the coin has the potential to hit $1.5 million.

Bitcoin

Bitcoin Price Eyes Next Breakout As The Bulls Aim For $70K

Bitcoin price climbed above the $66,000 resistance zone and started consolidation. BTC is now eyeing the next move above the $67,200 resistance zone.

  • Bitcoin is eyeing a decent increase above the $67,200 resistance zone.
  • The price is trading above $65,500 and the 100 hourly Simple moving average.
  • There is a connecting bullish trend line forming with support at $65,900 on the hourly chart of the BTC/USD pair (data feed from Kraken).
  • The pair could gain bullish momentum if it clears the $67,200 resistance zone.

Bitcoin Price Eyes More Upsides

Bitcoin price started a fresh increase above the $65,500 and $66,000 resistance levels. BTC even climbed above the $67,000 level. It traded as high as $67,200 and is currently consolidating gains.

There was a minor decline below the $66,500 level, but the price remained stable above the 23.6% Fib retracement level of the upward move from the $64,280 swing low to the $67,200 low. Bitcoin price is still trading above $65,500 and the 100 hourly Simple moving average.

There is also a connecting bullish trend line forming with support at $65,900 on the hourly chart of the BTC/USD pair. The trend line is near the 50% Fib retracement level of the upward move from the $64,280 swing low to the $67,200 low.

Immediate resistance is near the $67,000 level. The first major resistance could be $67,200. A clear move above the $67,200 resistance might send the price higher. The next resistance now sits at $68,500. If there is a clear move above the $68,500 resistance zone, the price could continue to move up. In the stated case, the price could rise toward $70,000.

Bitcoin Price

Source: BTCUSD on TradingView.com

The next major resistance is near the $70,500 zone. Any more gains might send Bitcoin toward the $72,000 resistance zone in the near term.

Are Dips Limited In BTC?

If Bitcoin fails to rise above the $67,000 resistance zone, it could start a downside correction. Immediate support on the downside is near the $66,200 level.

The first major support is $66,000 or the trend line. If there is a close below $66,000, the price could start to drop toward $65,400. Any more losses might send the price toward the $64,200 support zone in the near term.

Technical indicators:

Hourly MACD – The MACD is now losing pace in the bullish zone.

Hourly RSI (Relative Strength Index) – The RSI for BTC/USD is now above the 50 level.

Major Support Levels – $66,200, followed by $66,000.

Major Resistance Levels – $67,000, $67,200, and $68,500.

Is A $72K Bitcoin Surge On The Horizon? Glassnode’s Latest Analysis Points To An Answer

Recent insights from Glassnode’s cofounders, shared under their X (formerly Twitter) account ‘Negentrophic’ have sparked interest in Bitcoin market dynamics, leading to a promising stabilization and possible price surge.

Market Sentiments And EMA Trends

With Bitcoin’s value recently wavering below the $70,000 mark, a detailed analysis from the cofounders suggests that a strong support level around the $62,000 50-day Exponential Moving Average (EMA) could set the stage for a significant rebound.

This crucial support level indicates a strong buying sentiment, indicating the market’s confidence in the cryptocurrency’s value and a potential resistance against further declines.

Using the strategic placement of the 50-day EMA as a support point, the analysis suggests that investors might see the current price levels as a solid base, preventing significant downward movements.

This perspective is reinforced by recent price movements, where despite a pre-halving general dip, Bitcoin has experienced a 7.1% increase in value over the past week, and the same uptick continued in the last 24 hours.

Bitcoin (BTC) price chart on TradingView

Further analysis by the Glassnode cofounders delves into the behavior of EMAs over different durations. Short-term EMAs indicate a growing inclination among investors to buy, while longer-term EMAs lean towards selling.

This contrasting behavior between short and long-term EMAs sheds light on the current phase of the market, which seems to be in a period of consolidation after the notable 92% increase in Bitcoin’s price over six weeks earlier in the year.

Such insights are vital as they offer a deeper understanding of the underlying market forces and investor behavior during volatile periods.

Meanwhile, Glassnode’s team’s analytical approach extends beyond simple price movements. Yesterday, they compared the current market conditions to the early 2021 “strong correction,” which they term “wave 4” of the ongoing market cycle.

This historical perspective provides a lens through which current trends can be evaluated, suggesting a cyclic return to bullish conditions reminiscent of past market behaviors.

Bitcoin Bullish Projections And Market Dynamics

Bitfinex analysts have highlighted significant activities around Bitcoin withdrawals, supporting the optimistic outlook on Bitcoin. The current levels, echo those of January 2023, suggest that investors are increasingly moving their Bitcoin to cold storage—a sign that many anticipate further price increases.

Veering back to Glassnode’s projections yesterday based on their indexes and Fibonacci levels, the cofounders were boldly optimistic, anticipating a potential 350% increase from current market levels.

Notably, this forecast highlights the expected financial trajectory and underscores a growing confidence among experts and market analysts in Bitcoin’s market performance and its foundational economic principles.

Featured image from Unsplash, Chart from TradingView

Samson Mow On Bitcoin Halving: Brace For Supply Shock, Omega Candle In Sight

Samson Mow, the chief executive at Jan3, recently spoke to Forbes about the latest Bitcoin halving and its potential to catalyze what he refers to as the “Omega candles” – significant price movements that could elevate Bitcoin to the $1 million mark.

According to Mow, halvings ensure a controlled distribution of Bitcoin, maintaining scarcity and value.

The Mechanics Of Halving And Its Market Implications

Samson Mow detailed in the interview with Forbes the mechanics behind Bitcoin halvings—a critical process built into Bitcoin’s framework by its creator, Satoshi Nakamoto.

This mechanism is designed to halve the block rewards given to miners every 210,000 blocks, or approximately every four years, reducing the reward by 50%.

So far, the most recent halving has reduced the reward for mining from 6.25 BTC to 3.125 BTC per mined block. However, initially, miners received 50 BTC per block.

Still, due to the halvings, this amount has decreased over time to manage inflation and extend the mining lifecycle of Bitcoin’s capped supply of 21 million coins. If not for these halvings, the total supply of Bitcoin would have already been mined.

In the same discussion, Mow highlighted the significant impact of newly approved spot-based Bitcoin ETFs, which received SEC approval earlier this year. He believes these ETFs, combined with the reduced block rewards from the halving, could precipitate a “supply shock” in the BTC market.

Mow further speculated on the occurrence of what he calls “Omega candles”—large price movement events in the Bitcoin market.

He noted that even before the recent halving, the daily demand for Bitcoin was significantly outstripping supply, predicting these Omega candles as almost certain events due to their high volatility and substantial price changes.

Mow views these developments as marking the beginning of a new era for Bitcoin, coinciding with its next, or fifth, halving in the coming four years.

Bitcoin Bright Future And Market Performance

Regarding positive sentiment on Bitcoin, Geoff Kendrick of Standard Chartered also supports this bullish outlook, projecting substantial inflows into BTC akin to those experienced by gold with the advent of gold ETFs.

Kendrick suggests that the maturation of the spot ETF market could channel between $50 and $100 billion into BTC.

However, despite the post-halving price not reaching the anticipated heights, BTC has demonstrated resilience and potential for considerable growth. Meanwhile, analysts remain confident, predicting significant long-term value increases.

For instance, Michael Sullivan’s analysis suggests a possible reach of $245,000 by 2029 if BTC maintains a 30% compound annual growth rate, underlining the optimistic projections shared by several market experts.

This optimism is further supported by recent trends, including a 7.1% increase in Bitcoin’s price over the last week, which indicates a possible recovery on the horizon.

Bitcoin (BTC) price chart on TradingView

Featured image from Unsplash, Chart from TradingView

This Metric Printed In 2017 Before Bitcoin Exploded: Is A Mega Run Incoming?

In a post on X, one analyst has picked out a key on-chain metric that could signal the beginning of a strong leg up, similar to the explosive gains 2017. Currently, Bitcoin prices remain steady and edging higher. However, the coin failed to register sharp upswings, as most traders had predicted before the Halving event on April 20.

Flow Indicator Dips: A Bull Run In The Making?

Taking to X, the analyst said there has been a sharp drop in the 7-day average Flow indicator at leading crypto exchanges like Coinbase and Binance. When this was highlighted, the Flow indicator pointed to a decline from 161,000 to 76,000 BTC, a nearly 50% drop. 

BTC daily exchange flow | Source: Analyst on X

Interestingly, a similar pattern emerged in 2017 before Bitcoin embarked on a historic bull run.

The analyst said the Flow indicator dropped to 64,500 BTC across exchanges days and weeks later before prices exploded to around $20,000 in December 2017. 

Bitcoin price trending upward on the daily chart | Source: BTCUSDT on Binance, TradingView

For now, only time will tell if Bitcoin is preparing for a strong leg up. The coin remains within a bear formation, looking at the candlestick arrangement in the daily chart. Even though prices rose after Halving Day on April 20, sellers are in charge. As it is, the April 13 bearish engulfing pattern continues to define price action. Technically, a close above $68,000 might be the foundation for a rally towards $74,000 in the days ahead.

Bitcoin Supply Rapidly Shrinking

While the Flow indicator points to declining BTC across exchanges, another analyst has discovered an interesting development. Taking to X, another analyst noted that the available Bitcoin supply dipped below 4.6 million for the first time before April 20, when the network halved miner rewards. 

BTC supply falling | Source: Analyst on X

Since Halving reduces daily emissions by half, even if the current demand is sustained, the analyst says a supply squeeze will drive prices higher. Even so, as mentioned earlier, whether BTC will rally depends on the pace at which immediate resistance levels are cleared.

Historically, prices tend to rally a few months after Halving Day. However, in the past few months, there have been notable deviations. For instance, prices soared to all-time highs before Halving Day. This is the first time this has happened.

Beyond technical formations, the United States Securities and Exchange Commission (SEC) approved the first spot Bitcoin ETFs in January 2024. Through this product, institutions are free to gain exposure through shares. These shifting dynamics will shape price action in the current epoch, possibly leading to new deviations from historical performances. 

Bitcoin Market Dynamics Still Positive Post-Halving – Bitfinex Analysis

In the midst of the dramatic changes that have occurred in the cryptocurrency space after the Bitcoin halving event, Bitfinex provides a perceptive analysis that reassures investors that the market dynamics of BTC have remained positive in the post-halving period. Bitfinex examines the on-chain data and finds encouraging signs for Bitcoin in spite of the United States economy’s current state of uncertainty in its most recent Alpha report, which was released on April 22.

Bitcoin Market Dynamics Remains Bullish

According to the Hong Kong-based crypto platform, exchange withdrawals of Bitcoin are currently at levels not seen since January 2023. This simply indicates that a lot of investors are putting their assets in cold storage in expectation of price rises.

Also, the exchange noted that long-term investors’ aggressive selling has not yet caused the usual pre-halving price decline, which suggests that new market participants are absorbing the selling pressure quite well, highlighting the tenacity of the present market structure of Bitcoin.

The Bitfinex Alpha report revealed that the average daily net inflow from spot Bitcoin Exchange-Traded Funds (ETFs) is $150 million. Given the ETFs’ inflows far exceeding the $30 and $40 million daily issuance rate of BTC following the halving, this significant supply and demand imbalance could encourage further price appreciation.

Bitfinex further claims the massive purchases of spot Bitcoin ETFs, which have dominated the entire year’s market narrative, may decline. However, recent ETF outflows have shown that ETF demand may be starting to stabilize.

It is important to note that the recently concluded Halving cut down miners’ reward from 6.25 BTC to 3.125 BTC. As a result, miners are now modifying their operating tactics in order to sustain their activities against the decline in reward following the Halving.

Thus, the amount of Bitcoin that miners are sending to exchanges has significantly decreased, which may indicate that they are selling ahead of time or collateralizing their holdings to upgrade infrastructure. Consequently, this could possibly lead to a gradual increase in selling pressure rather than a sudden drop in value at the Halving.

New BTC Whales Surpassed Old Whales

Since the conclusion of the fourth Halving, on-chain data shows a significant rise in new Bitcoin whales. CryptoQuant Chief Executive Officer (CEO) Ki Young Ju, reported the development, noting that the initial investment made by the new whales in Bitcoin is nearly twice that of the old whales combined.

According to the data, the total holding by these new whales, which are short-term holders, is valued at $110.6 billion. Meanwhile, the old whales, which are long-term holders, own a whopping $67 billion worth of BTC. This change in whale demographics may impact Bitcoin’s future course and the dynamics of the cryptocurrency landscape as a whole.

Bitcoin

Conservative Projection Places Bitcoin At $245,000 In 5 Years

A recent analysis paints a rosy picture of Bitcoin’s future, even with a conservative growth projection. Taking to X, Michael Sullivan predicts that the world’s most valuable coin could reach a staggering $245,000 within just five years if it maintains a mere 30% compound annual growth rate (CAGR). 

Bitcoin Projections: From Conservative To Exponential Growth

The analysis explores various growth possibilities for Bitcoin. Assuming the coin’s growth rate significantly contracts in the coming years, growing at just 30% CAGR, Sullivan projects the coin to reach $245,000 by 2029. 

BTC price at a CAGR of 30% | Source: Analyst

A decade later, it will be at $909,000; by 2039, each coin in circulation will be trading at a whopping $3.37 million. If, however, the CAGR rises to 40%, Bitcoin would be worth $10.3 million in 15 years and $1.9 million in 10 years.

Still, even at these mega valuations, Bitcoin has been soaring at unprecedented rates, outperforming all traditional finance assets since launching. To demonstrate, Bitcoin registered a CAGR of 73.7% over the past four years. 

Therefore, if this trend continues, Sullivan says BTC will smash above the $1 million level a year after halving in 2028. However, half a decade later, each coin will change hands at over $16.5 million. 

BTC at a CAGR of 73.7% | Source: Analyst on X

A look back at Bitcoin’s history makes it clear that the coin has been on a tear. Following this historical trend and making projections for the future, BTC could be far more valuable in the next five or ten years.

There Are No Guarantees, Crypto Is Dynamic

While these projections are undoubtedly exciting for Bitcoin holders, it’s crucial to remember that they are just projections. The crypto market, just like any other tradable asset, doesn’t move in straight lines. 

As an illustration, after peaking at nearly $70,000 in 2021, prices crashed to as low as $15,600 the following year. In 2017, BTC rose to around $20,000 before tanking to below $4,000 a year later in 2018. This volatility and the dynamic market, influenced by new circumstances, don’t guarantee these lofty projections.

Bitcoin price trending upward on the daily chart | Source: BTCUSDT on Binance, TradingView

Nonetheless, analysts remain optimistic of what lies ahead, especially after the historic Halving event on April 20. As traditional finance players join in, finding exposure in BTC through spot exchange-traded funds (ETFs), prices might rise, even breaking above the all-time highs of around $74,000.

Bitcoin Price Extends Increase, Why Dips Turned Attractive In Short-Term

Bitcoin price extended its increase and climbed above the $66,000 resistance zone. BTC is now showing positive signs and might find bids near $65,500.

  • Bitcoin gained pace for a move above the $65,500 resistance zone.
  • The price is trading above $65,500 and the 100 hourly Simple moving average.
  • There is a key bullish trend line forming with support at $65,700 on the hourly chart of the BTC/USD pair (data feed from Kraken).
  • The pair could correct lower, but the bulls might remain active near the $65,500 support.

Bitcoin Price Gains Strength

Bitcoin price started a fresh increase above the $64,500 and $65,000 resistance levels. BTC bulls even pushed the price above the $66,000 resistance. It traded to a new weekly high at $67,200 and is currently consolidating gains.

The price is slowly moving lower toward the 23.6% Fib retracement level of the upward move from the $64,281 swing low to the $67,200 low. Bitcoin price is still trading above $65,500 and the 100 hourly Simple moving average.

There is also a key bullish trend line forming with support at $65,700 on the hourly chart of the BTC/USD pair. The trend line is near the 50% Fib retracement level of the upward move from the $64,281 swing low to the $67,200 low.

Immediate resistance is near the $67,000 level. The first major resistance could be $67,200. The next resistance now sits at $68,500. If there is a clear move above the $68,500 resistance zone, the price could continue to move up. In the stated case, the price could rise toward $70,000.

Bitcoin Price

Source: BTCUSD on TradingView.com

The next major resistance is near the $70,500 zone. Any more gains might send Bitcoin toward the $72,000 resistance zone in the near term.

Downside Correction In BTC?

If Bitcoin fails to rise above the $67,000 resistance zone, it could start a downside correction. Immediate support on the downside is near the $66,500 level.

The first major support is $65,700 or the trend line. If there is a close below $65,500, the price could start to drop toward $65,000. Any more losses might send the price toward the $64,200 support zone in the near term.

Technical indicators:

Hourly MACD – The MACD is now losing pace in the bullish zone.

Hourly RSI (Relative Strength Index) – The RSI for BTC/USD is now above the 50 level.

Major Support Levels – $66,500, followed by $65,500.

Major Resistance Levels – $67,000, $67,200, and $68,500.

‘More Upside Is Coming’: Crypto Market Set For 350% Growth, Predicts Glassnode Cofounders

Negentropic, the official X (formerly Twitter) account of Glassnode’s cofounders, has offered its own bullish sentiment for the crypto market.

Glassnode Cofounders: There Would Be A Massive Growth Beyond Recent Corrections

According to their analysis, the market, excluding the top 10 cryptocurrencies, known as “OTHERS,” is showing signs of a strong uptrend with the potential for “more upside” growth.

This observation amidst increased volatility and uncertainty following the recent Bitcoin Halving event on April 20 reduced miners’ block subsidy rewards from 6.25 BTC to 3.125 BTC.

The cofounders pointed out an intriguing pattern in the market’s behavior, comparing the current conditions to the “strong correction” seen in early 2021, which they identified as “wave 4” in the market cycle.

Using their index and Fibonacci levels, Glassnode’s cofounders anticipate approximately a 350% increase from the current market levels, noting:

More upside is coming. This index and our Fibonacci levels gives us, that we may see ~350% upside from current levels.

Notably, this bullish projection underscores their confidence in the potential for further market expansion despite recent downturns.

Crypto Market Recovery Amid Bitcoin Criticism And Post-Halving Predictions

While the Glassnode Co-founders have predicted significant growth for the crypto market, it’s important to note that the overall market sentiment remains bullish. After a notable decline last week, the global crypto market is showing signs of recovery, with nearly a 3% increase in the past 24 hours.

This upward movement can be attributed to major cryptocurrencies like Bitcoin and Ethereum, which have seen gains of 2.7% and 1.7% over the same period.

BTC price chart on TradingView amid crypto news

Bitcoin, the flagship cryptocurrency, has recently faced criticism from prominent figures like Peter Schiff, who criticized its high transaction fees and longer processing times.

Due to these challenges, Schiff labeled Bitcoin as a “failure” in terms of digital currency. However, it’s worth noting that Bitcoin’s average transaction fee has significantly decreased to $34.86 on April 21, following a record high of $128.45 the day before.

Bitcoin Average Transaction Fee

Meanwhile, analyst and founder of the Capriole Investment fund Charles Edwards has shared three possible scenarios for Bitcoin after the Halving.

Edwards highlighted the increase in Bitcoin’s electrical cost to $77,400 per new BTC coin produced, while the overall miner price, including block rewards and fees, surged to $244,000.

He predicts that Bitcoin’s price may skyrocket, approximately 15% of miners may shut down their operations, or transaction fees will remain elevated. Edwards expects a combination of these scenarios to unfold, ultimately leading to Bitcoin’s price surpassing $100,000.

Featured image from Unsplash, Chart from TradingView

Market Expert Predicts New Paradigm For Bitcoin: ‘Days Under $100,000 Numbered’

As the Bitcoin (BTC) Halving event concluded for the fourth time, the cryptocurrency market witnessed notable changes in key metrics. 

These developments have led Charles Edwards, a market expert and founder of Capriole Invest, to issue bold predictions that hint at a paradigm shift in the BTC market. 

Bitcoin Trading At ‘Deep Discount’

One of the key metrics highlighted by Edwards is the staggering electrical cost associated with mining a single Bitcoin. Edwards reveals that this cost has now reached an astonishing $77,4000. This figure represents the raw electricity expenses required to power the Bitcoin network for every newly mined BTC.

Another significant metric that Edwards draws attention to is the Bitcoin Miner Price, which soared to $244,000 on Saturday. This metric encompasses the block reward and fees miners receive for every Bitcoin they successfully mine. 

Notably, this surge in miner price coincided with transaction fees skyrocketing to $230, marking a four-fold increase compared to the previous all-time high of $68 set in 2021.

Bitcoin

Considering the metrics above, Edwards suggests that BTC currently trades at a “deep discount.”  This is because BTC’s price is lower than the electrical costs of mining it.

Typically, this situation only lasts for a few days every four years, suggesting that the price will only take a short time to catch up and surpass this price level, which is slightly below BTC’s all-time high (ATH) of $73,7000, reached on March 14th. 

Edwards outlines three possible outcomes in the wake of these developments. First, he anticipates a scenario in which the price of Bitcoin experiences a significant surge. 

Secondly, there is a likelihood that approximately 15% of miners may be forced to shut down due to unfavorable economics. Finally, Edwards suggests that average transaction fees are expected to remain substantially higher.

Based on the analysis of these metrics and the potential scenarios, Edwards boldly predicts that Bitcoin’s days under the $100,000 mark are “numbered.” While it remains to be seen which of the three outcomes will prevail, Edwards expects a combination of all three factors to contribute to Bitcoin’s price appreciation.

Optimal Buying Opportunity? 

Bitcoin has demonstrated significant price consolidation above the $60,000 mark since Friday, following temporary drops below this threshold amid mounting anticipation for the Halving event. 

Crypto analyst Ali Martinez recently analyzed Bitcoin’s current price state, suggesting that a potential bottom may have formed above these levels, increasing the likelihood of surpassing upper resistance levels shortly.

According to Ali Martinez’s analysis, Bitcoin strives to establish the $66,000 price level as a crucial support zone. Data reveals that approximately 1.54 million addresses collectively purchased 747,000 BTC at this level. If Bitcoin successfully secures this support, it may pave the way for further upward movement.

Martinez identifies Bitcoin’s next critical resistance levels, between $69,900 and $71,200. These levels represent significant price barriers for BTC bulls, and Bitcoin may encounter selling pressure at these levels. 

In addition, the analyst points out that the Bitcoin MVRV ratio, a metric that compares the market value of Bitcoin to its realized value, has shown a promising pattern, as seen in the chart below. 

Bitcoin

Martinez highlights that whenever the MVRV ratio falls below its 90-day average since November 2022, it historically indicates an optimal buying opportunity for Bitcoin. Interestingly, such buying opportunities have resulted in average gains of approximately 67%.

According to Martinez, based on current market conditions and an analysis of the MVRV ratio, now may be an opportune time to consider buying Bitcoin. The historical data and the potential for significant price appreciation support this view. 

Bitcoin

BTC is trading at $66,100, up 1.6% in the past 24 hours. 

Featured image from Shutterstock, chart from TradingView.com

Brazil Wants BTC: 7,400 Bitcoin Futures Contracts Created On First Day Of Trading

After announcing in March its plans to include Bitcoin futures in its offerings, B3, a Brazilian stock exchange, has officially opened up trades, achieving a significant milestone on its very first day of trading Bitcoin futures. 

B3 Bitcoin Futures Sees Surge In Demand

Following its launch of Bitcoin futures on April 17, B3 experienced a massive wave of demand and interest from cryptocurrency enthusiasts eager to trade the newly listed Bitcoin futures. The stock exchange reported that on the debut trading day, more than 7,400 Bitcoin futures contracts were actively traded. 

This unprecedented trading volume underscores investors’ strong interest in cryptocurrency derivatives as well as the increasing demand for BTC exposure among Brazilian cryptocurrency traders and enthusiasts. 

Notably, B3 disclosed that the demand for Bitcoin futures on its exchange was so profound that it had hit 111,000 buy or sell orders on the trading screen. The market had displayed intense participation in the newly launched contracts, with the Director of Listed Products at B3, Marcos Skistymas, affirming that the heightened demand resulted from B3’s introduction of its first-ever derivative linked to a cryptocurrency. 

The introduction of Bitcoin futures marks a significant step forward for the stock exchange, aligning with its vision to expand its offerings to cater to users’ needs. Skistymas has also indicated that the market’s response to the recently listed Bitcoin futures was overwhelmingly positive, reflecting a significant potential for these contracts within the Brazilian market. 

BTC Futures To Act As A Hedge Against Market Volatility

According to Skistymas, Bitcoin futures were a “suitable instrument” that could become a hedge against Bitcoin, potentially providing Brazilian investors a means to manage the flurry of risks associated with Bitcoin’s price fluctuations.

For more clarity, a Bitcoin future is a contract between investors who wager on the future price of the pioneer cryptocurrency, providing exposure to Bitcoin without the need to purchase it. Given btc’s high volatility and price fluctuations during certain market conditions, accurately predicting the price of the cryptocurrency can be challenging. Additionally, only a handful of crypto analysts and investors have managed to forecast Bitcoin’s price actions with precision. 

At the beginning of the year, the price of BTC surged from below $50,000 to an all-time high of more than $75,000 in March 2024. As of writing, the cryptocurrency is trading at $66,129 after witnessing a major price correction and plummeting by 0.09% over the past month, according to CoinMarketCap. 

Irrespective of BTC’s unpredictability and price variations, the launch of Bitcoin futures on B3 has the potential to bring in a new era of adoption among Brazilian investors, providing them with fresh opportunities to diversify their portfolios with these regulated financial instruments.

Bitcoin price chart from Tradingview.com