As May 1st started, Bitcoin (BTC) faced a new correction that made the price stumble under the $60,000 support level. The flagship cryptocurrency has seen several retraces during this bull cycle, with BTC swiftly recovering the crucial support zones each time.
However, in the past 24 hours, the largest cryptocurrency by market capitalization has struggled to regain its momentum. Some analysts believe Bitcoin’s bottom this cycle might be in as this correction officially became its deepest retrace.
Is The Bitcoin Bottom Here?
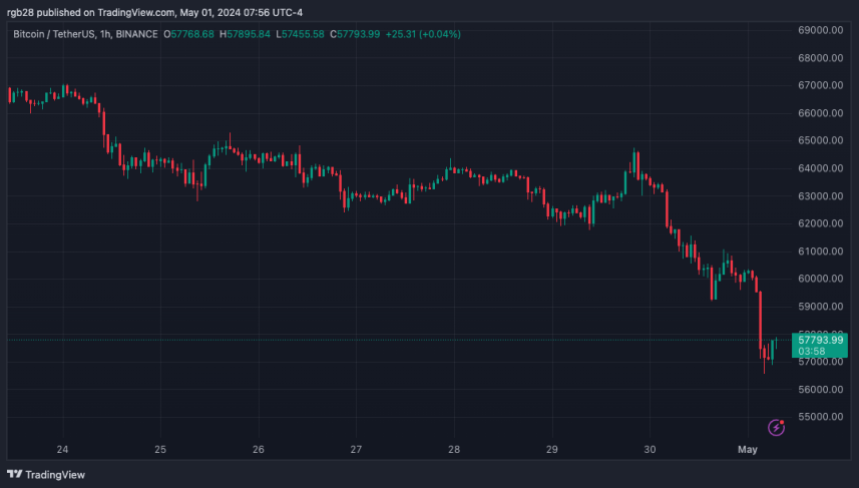
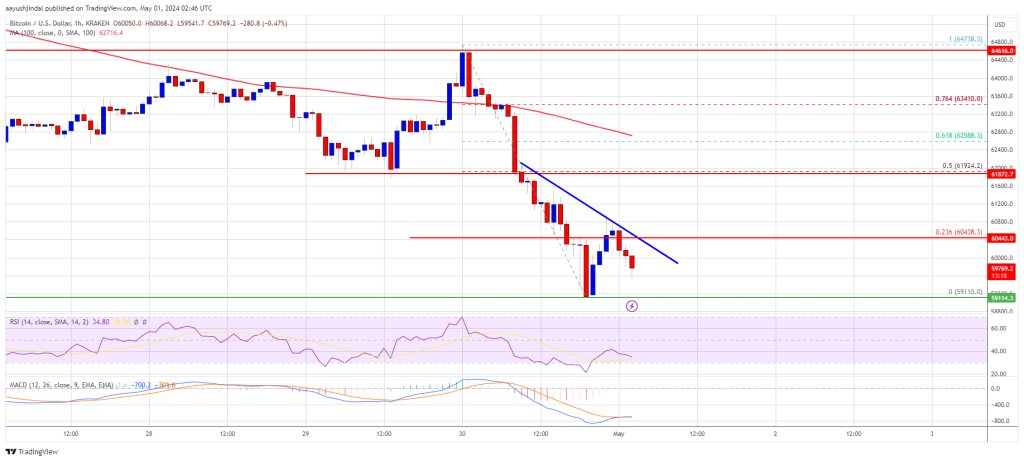
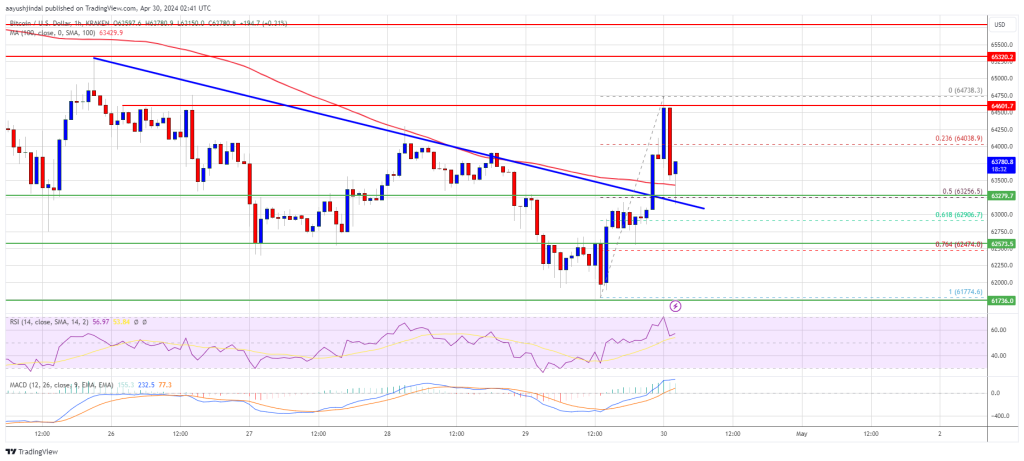
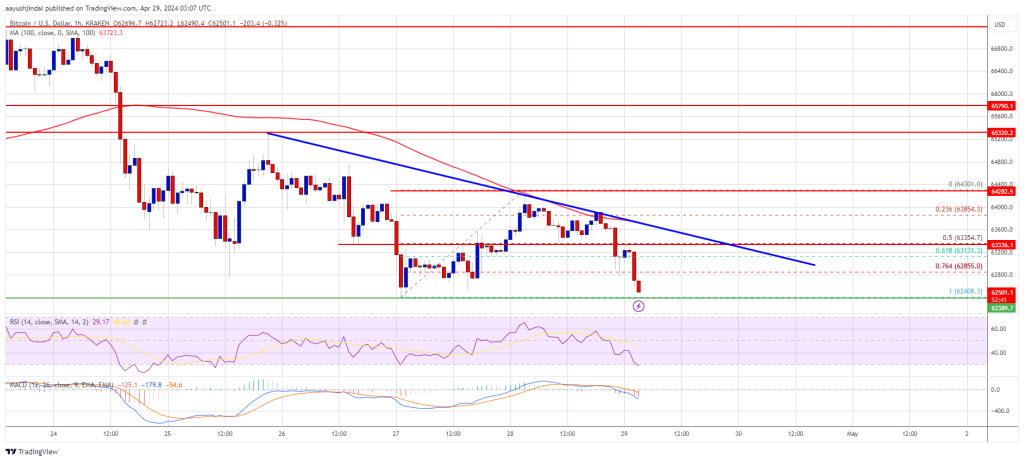
In the early hours of Tuesday, Bitcoin started to plunge from the $64,000 price range. As the day continued, BTC prolonged its fall to briefly trading around $59,958 – $59,191 before recovering.
This time, the recovery didn’t last long as Bitcoin’s price resumed its downward trajectory to $57,000. In an X thread, crypto trader Milkybull examined some data suggesting the bottom might finally be in.
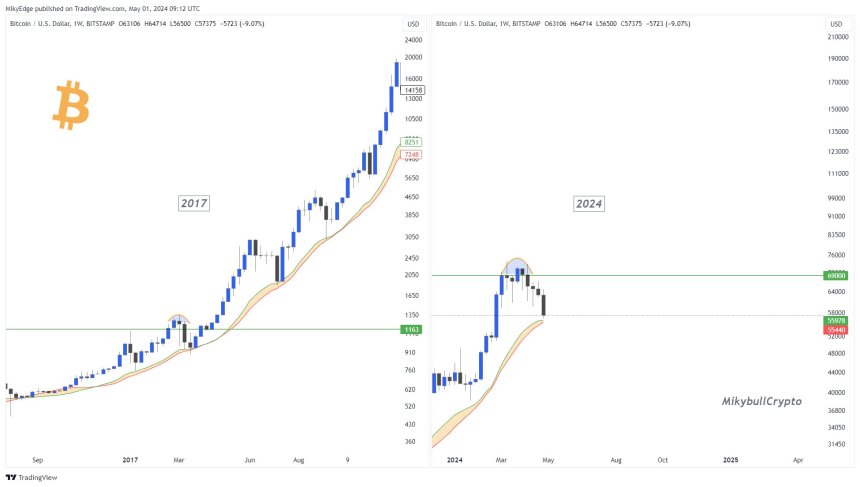
According to the analyst, BTC is “following the 2017 PA.” This would suggest that “either the bottom is in or close.” Moreover, he urged investors to remember that while good news “usually signals the top,” bad news signals a bull market’s bottom.
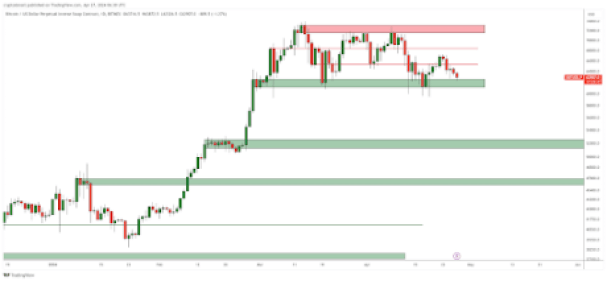
In the thread, the trader pointed out that the Bitcoin Bull Market Support Band indicator historically serves strong support during BTC’s bull cycles. As a result, he considers that the flagship cryptocurrency might “wick through the support and bounce back.”
According to the analyst, Bitcoin and global liquidity are also strongly correlated, with BTC currently at a level it has previously bounced back from. These bouncebacks initiated “huge rallies across the crypto market” in October 2022 and October 2023.
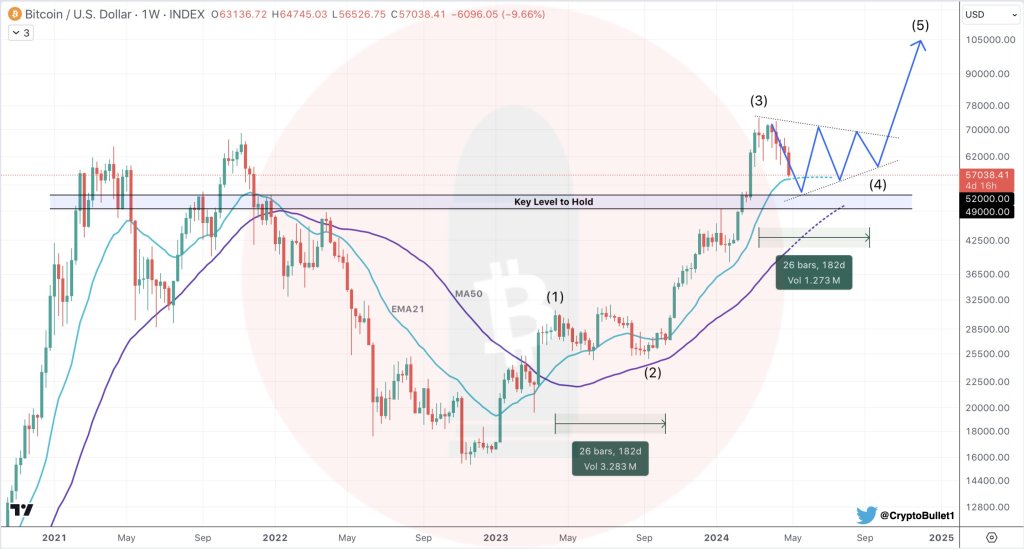
Lastly, the thread highlighted that Bitcoin “is at a critical decision point for the local bottom.” The trader considers that while some call for a $48,000 bottom, the $51,000 support level might be where BTC bounces back to resume its cycle to this cycle’s top.
Bitcoin’s Deepest Retrace This Cycle
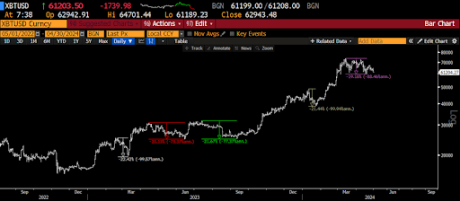
According to crypto analyst and trader Rekt Capital, this correction has officially been the deepest BTC retrace this cycle. Per the post, today’s -23.64% retrace surpasses the -22.91% retrace seen in February 2023.
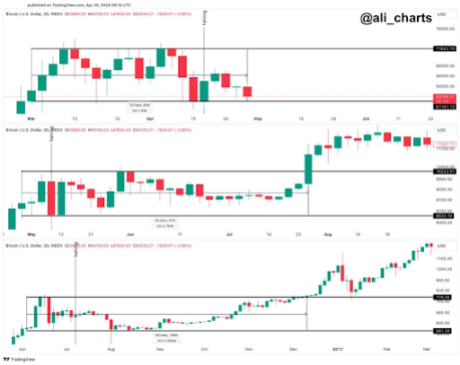
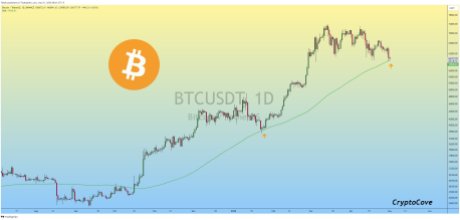
The analyst also compared this cycle’s “Post-Halving” pullback to 2016’s. Moreover, the trader considers that this bullish cycle might be more similar to the 2016 one than investors think.
We are here (orange circle)
And we've seen Post-Halving pullbacks like this in the past (e.g. 2016)$BTC #Bitcoin #BitcoinHalving pic.twitter.com/OvOcmJTzFk
— Rekt Capital (@rektcapital) May 1, 2024
Previously, Rekt Capital listed three reasons these two cycles might be similar. Per the trader, the resemblances include the “Pre-Halving Re-Accumulation Range Breakout,” the “Pre-Halving Retrace Beginning,” and the “Similar Initial Reaction after the beginning of the Pre-Halving Retrace.”
After today’s retrace, the analyst added the “Continued downside in the three weeks after the Halving” as a fourth similarity between the 2016 and 2024 cycles. Like eight years ago, Bitcoin faces an “additional downside below the Range Low of its Re-Accumulation Range” in the three-week window after Bitcoin’s “Halving.”
Moreover, the analyst suggests that the current price development comes “as no surprise,” as it mirrors 2016’s “post-Halving Danger Zone.”
As of this writing, the flagship cryptocurrency is trading at $57,794.89. This correction represents a 6.2% drop in the past 24 hours. Similarly, BTC is registering 13.4% and 17.7% price decreases in the weekly and monthly timeframes.
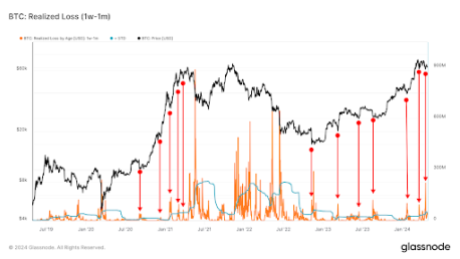
 According to our model, the mid-term gains and losses by average wallets indicate heavy realized losses across most
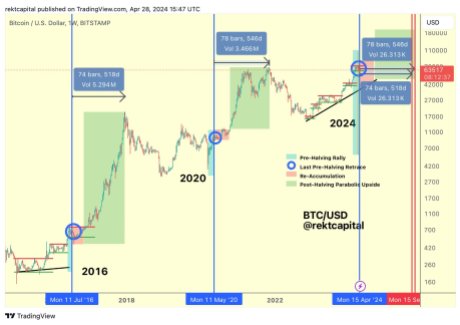
 The total amount of non-empty


