Grayscale Investments, the issuer of one of the recently approved spot Bitcoin exchange-traded funds (ETFs) in the US, saw flat revenues in the first quarter of the year due to its decision to maintain fees on its flagship Grayscale Bitcoin Trust ETF (GBTC).
Grayscale Exceeds Expectations Despite Outflows
According to a shareholder letter from its parent company, Digital Currency Group (DCG), the operator of the Grayscale Bitcoin Trust recorded $156 million in revenue, showing little change from the previous quarter.
Since the GBTC trust’s conversion to an ETF in January, Grayscale has seen outflows of about $17.4 billion as investors appear to have shifted their assets to new, lower-cost funds offered by BlackRock and Fidelity, the leaders in the US ETF race in terms of inflows recorded since January.
While GBTC charges a 1.5% management fee, many of its competitors charge less than 0.3%, leading to outflows. In response, Grayscale announced plans in March to seek approval from the Securities and Exchange Commission (SEC) to spin off some of Grayscale’s assets into a new, lower-fee “Bitcoin Mini Trust.”
Despite the outflows, the Q1 revenue attributable to GBTC exceeded Grayscale’s expectations. The firm had previously anticipated outflows due to increased competition under the ETF wrapper. Grayscale previously charged a 2% sponsorship fee before the trust was converted.
The flat revenue was also attributed to higher average Bitcoin and Ethereum prices and a decrease in assets under management (AUM).
In contrast to Grayscale’s performance, all US spot Bitcoin ETFs have witnessed a total net inflow of over $11 billion thus far. However, demand for these ETFs has recently declined amidst tightening financial conditions in the US, where the Federal Reserve (Fed) faces the challenge of addressing persistent inflation.
DCG Reports 11% Q1 Revenue Increase
Digital Currency Group, founded by Barry Silbert and the parent company of Grayscale, reported an 11% quarter-over-quarter increase in Q1 revenue to $229 million, primarily due to higher asset prices.
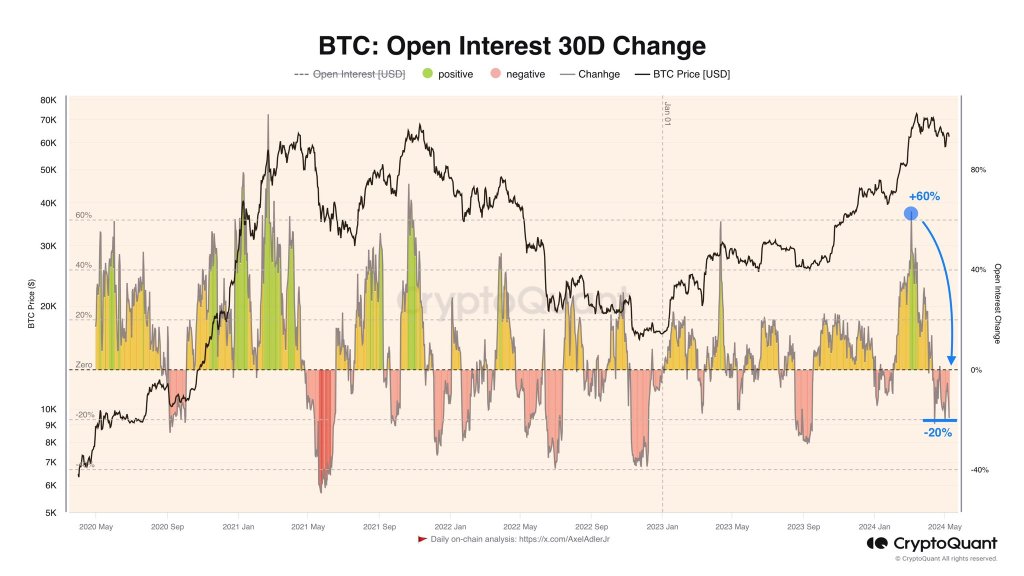
However, revenue growth lagged behind Bitcoin’s price appreciation, which rose more than 60% during the same period. In its letter, DCG attributed this disparity to lower GBTC sponsor fees, redemptions, and steady mining revenues at its Foundry subsidiary.
Foundry, DCG’s mining subsidiary, experienced a sequential revenue increase of 35%, propelled by staking and equipment sales revenue. Meanwhile, Luno, the company’s crypto exchange subsidiary, witnessed a 46% quarter-over-quarter sales boost, driven by a significant surge in trading volume.
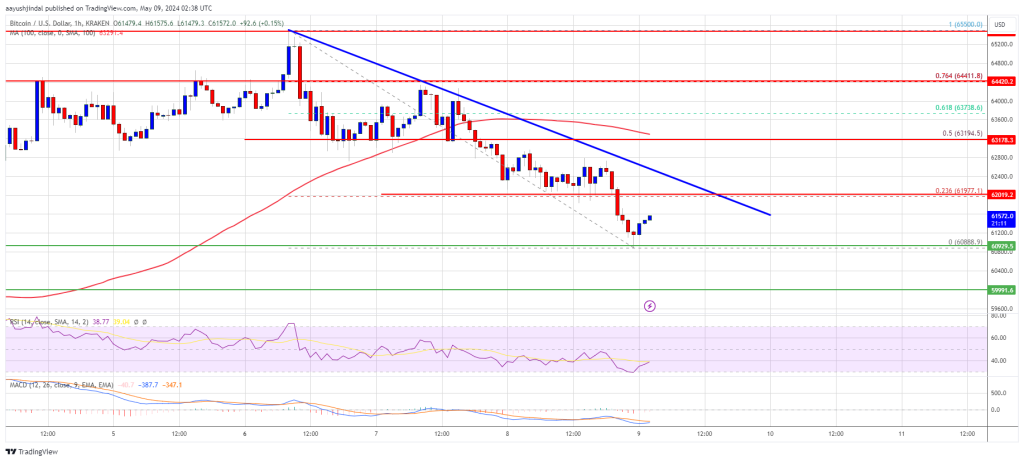
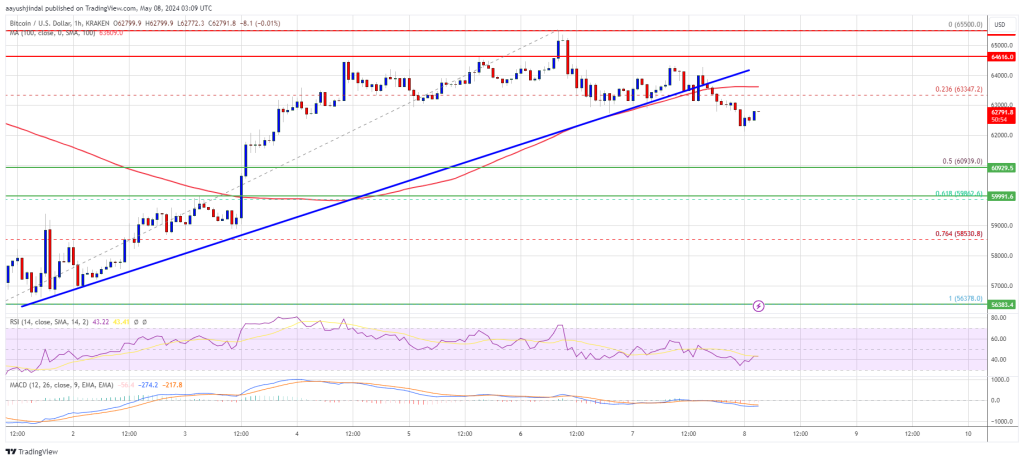
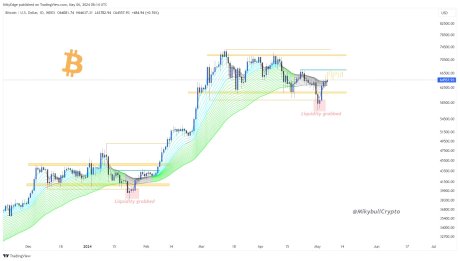
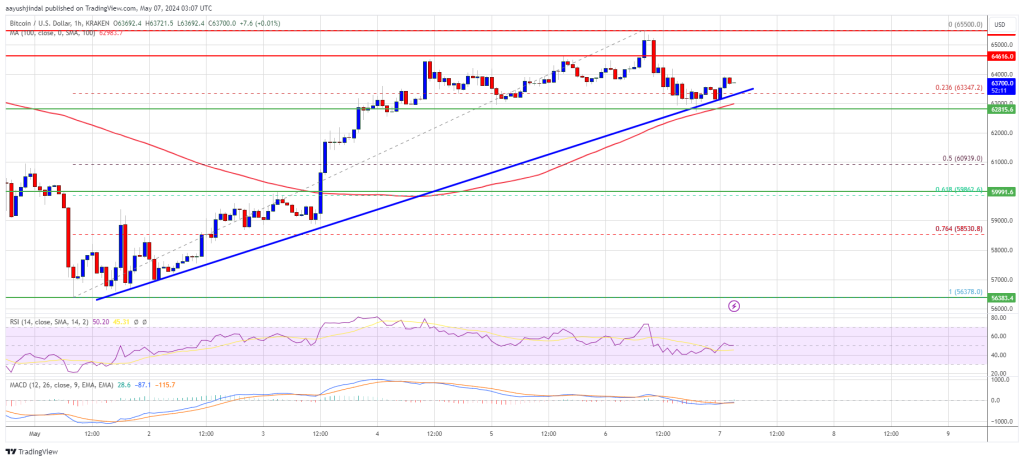
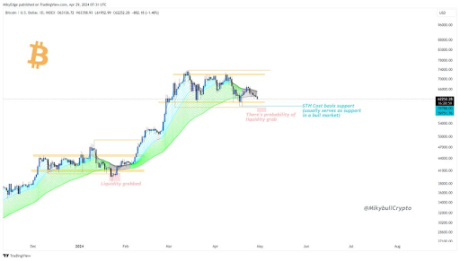
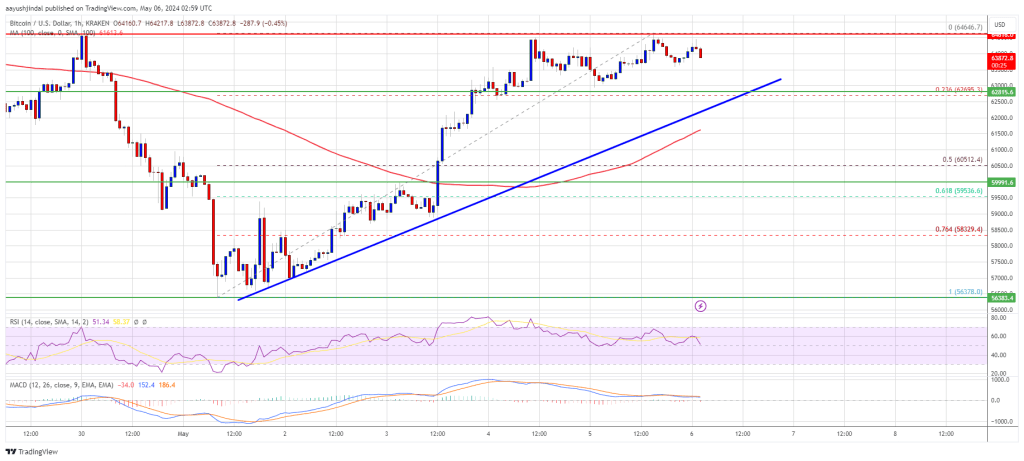
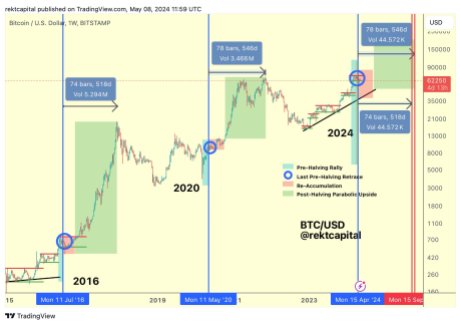
At press time, Bitcoin is trading at $62,100 and has recently encountered significant price volatility. These price swings have failed to establish a stable position above crucial price thresholds.
Featured image from Shutterstock, chart from TradingView.com

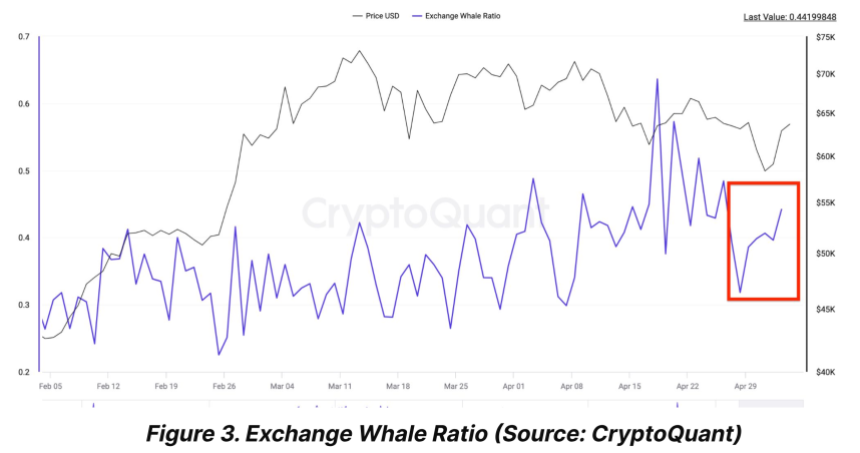
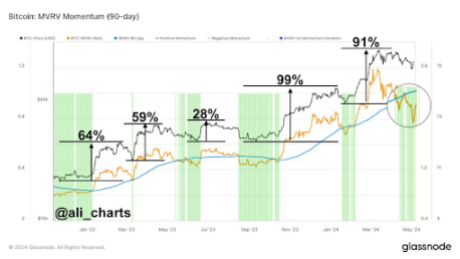
 Addresses holding over 1000 BTC have accumulated strongly in recent months, especially during dips.
 Prices have increased shortly following every accumulation.