Overvaluation Risks Haunt BitTorrent As Price Explodes 164% QTD

BitTorrent turned alarmingly overvalued on Monday as its price popped higher by as much as 164 percent quarter-to-date.

The BTT/USD exchange rate surged to $0.013, its highest level on record, after rallying seven days in a row. Every sell-off attempt met with an equally aggressive accumulation, prompting more and more traders to buy the Justin Sun-backed asset at intraday highs. The volumes soared likewise.

BitTorrent rally looks overblown. Source: BTTUSD on TradingView.com

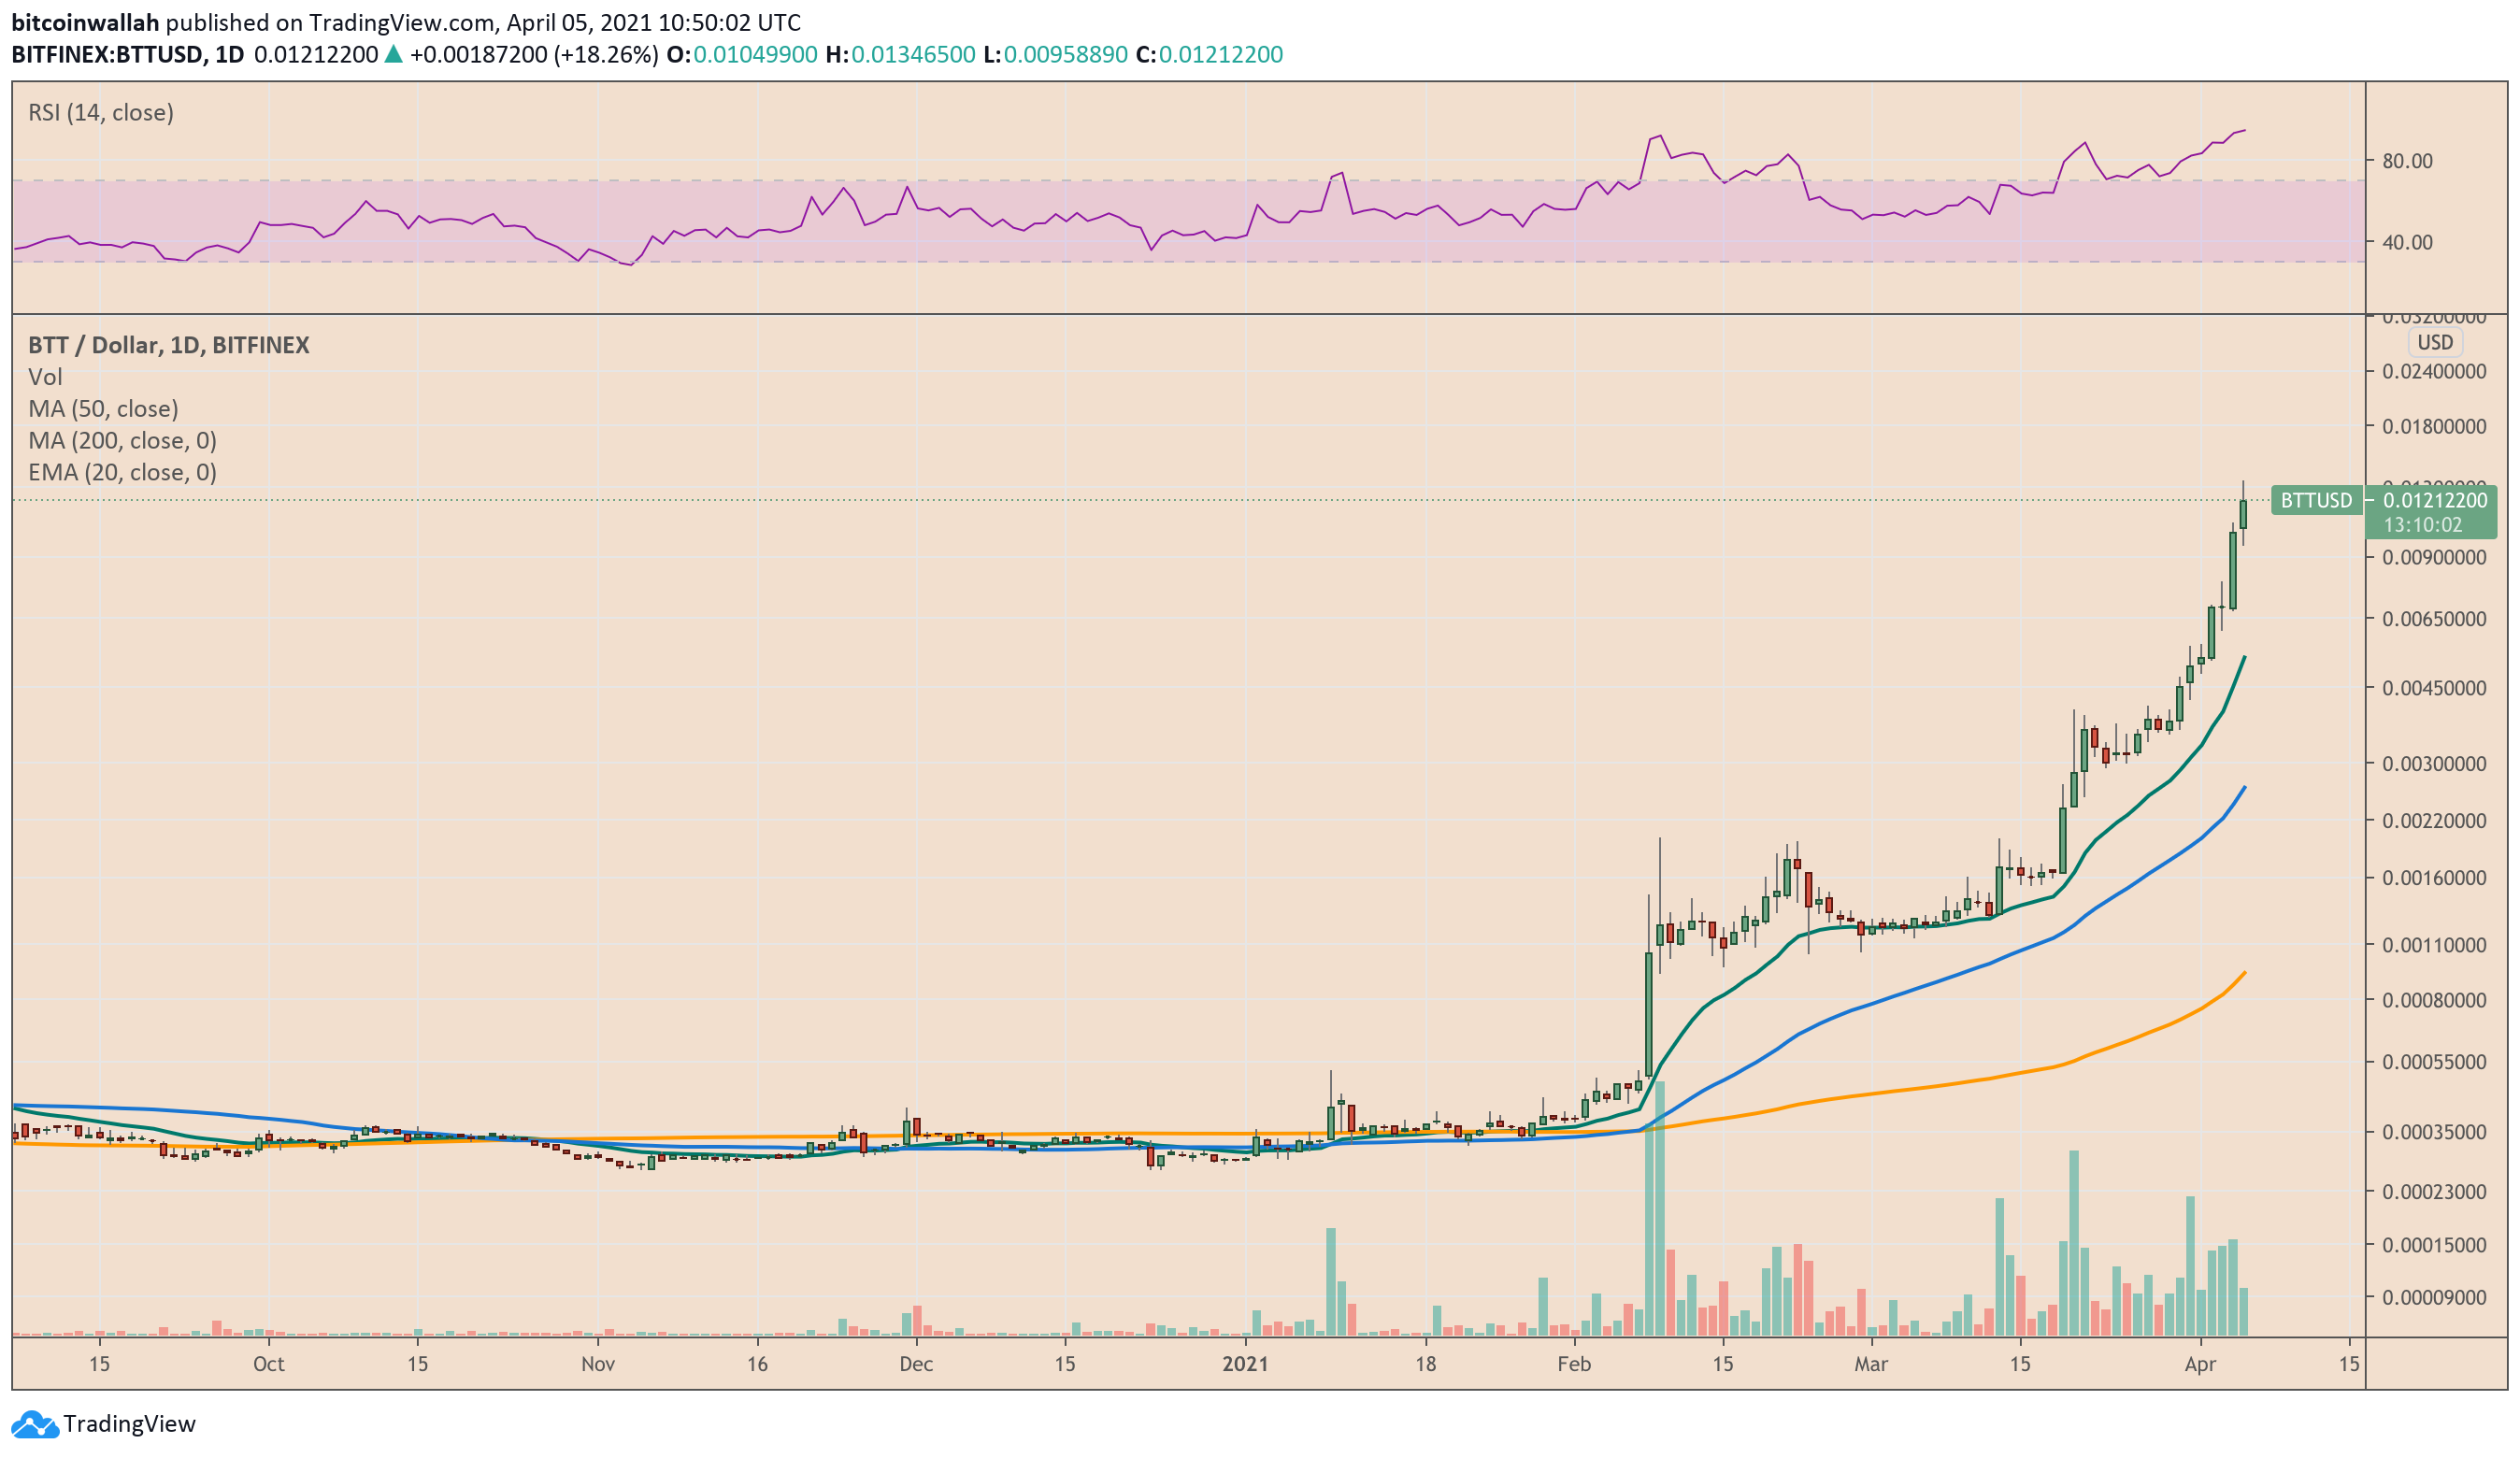
The strong upside move pushed BitTorrent’s Relative Strength Indicator to 94.95, a reading that pointed to an extremely overbought asset. Typically, a higher RSI reading prompts investors/traders to unwind their holdings. As they secure their profits, the asset tops out and falls lower to find its next local support. In a worst-case scenario, it just crashes.

Fundamentals

It isn’t easy to estimate what could happen to BTT/USD. Many analysts agree that the BitTorrent token’s rally has surfaced without any concrete catalyst.

But Joseph Young, an independent cryptocurrency analyst, pointed that Justin Sun’s acquisition of Poloniex crypto exchange alongside other partners, followed by the introduction of BTT staking on the platform, might have boosted the BTT prices. Mr. Sun backs BitTorrent via his key business, the Tron Foundation. The Tron blockchain supports BTT.

Staking takes active token supplies out of circulation. If the demand for the concerned cryptocurrency increases alongside, it tends to increase its bids across spot markets. Earlier, Ethereum’s native token Ether also surged twofold against a similar catalyst.

But BitTorrent is not Ethereum, the project that supports more than 80 percent of the alternative cryptocurrency space atop its blockchain, including decentralized exchange UniSwap and Tether’s stablecoin USDT. That leaves traders in conflict about BTT’s next direction.

Mr. Young also asserted that the BitTorrent price boom has “no clear fundamental catalyst.”

BitTorrent Price Outlook

The maximum risk for BitTorrent moving forward appears to the downside.

BitTorrent eyes correction towards its 20-4H moving average. Source: BTTUSD on TradingView.com

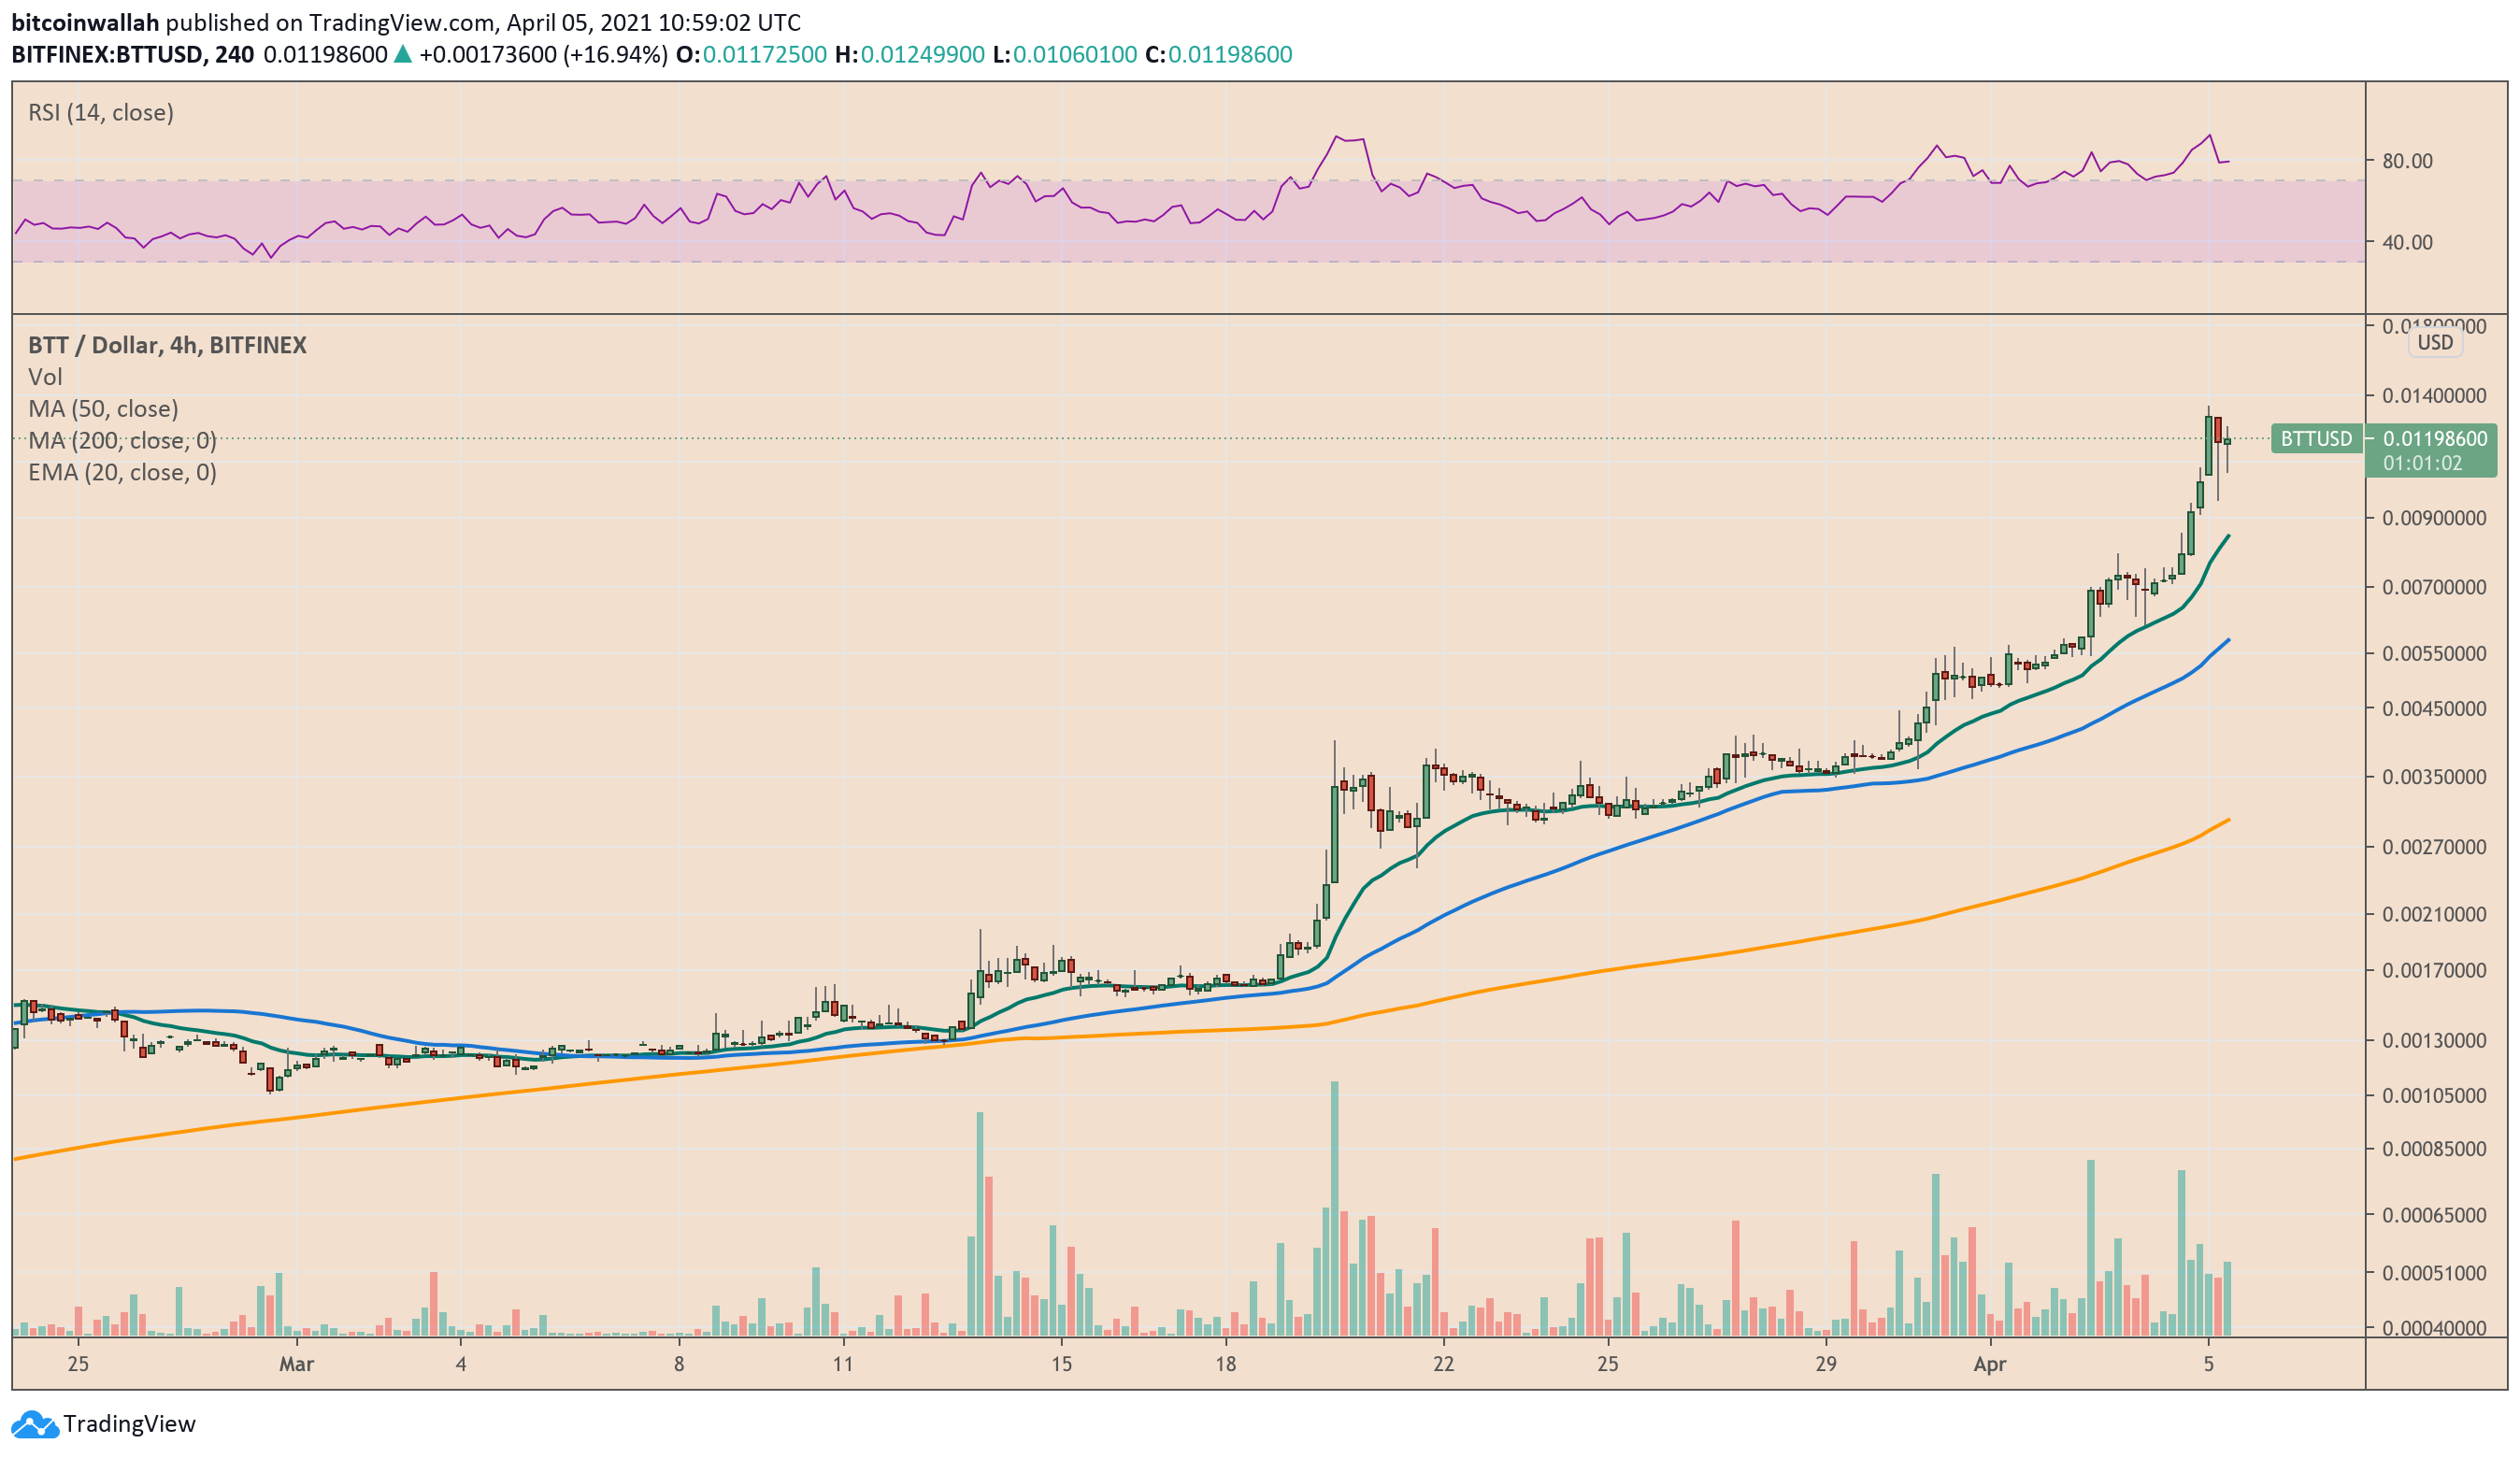
Traders might unload a portion of their BTT holdings to secure maximum profits. That could push the token towards its next downside target that lurks near its 20-4H exponential moving average (the green wave). If profit-taking intensifies, BTT will fall towards the blue wave target — the 50-4H simple moving average. That would wipe out almost most of the BTT’s 2021 profits.

Meanwhile, a continued pumping phase could risk turning BTT into a bubble that could hurt the latest buyers the most. For now, the token needs a vast correction downhill to neutralized its overbought sentiments.

Photo by Felipe Souza on Unsplash.

Litecoin Signal Shines, Suggests Downtrend Against Bitcoin Is Over

Litecoin is trading at around $200… still. The altcoin has failed to set a new all-time high like Bitcoin, Ethereum, and others in the top ten have, yet it has clung onto the ranks for its entire lifetime.

A signal has appeared – across several of the highest timeframes – that could suggest that the long downtrend against Bitcoin is about to come to an explosive ending.

Litecoin Loses Luster During Bear Market, Can’t Catch A Spark

Few coins have had as difficult of a time recovering since the last bull market as Litecoin has. The only other coin in the top ten to struggle so severely is XRP, and the coin’s parent company Ripple is locked in a legal battle with the SEC.

Litecoin has no such issue to keep its prices down, yet the coin has yet to do much better than its 2019 peak, and is not even halfway recovered to its previous all-time high around $418 per LTC.

Related Reading | Now Or Never: Litecoin Plummets To Bottom Of Top Ten Crypto Assets

Meanwhile, Ethereum just smashed above $2,000 and Bitcoin is trading at around $60,000 per coin – more than three times its former high.

The rise in Bitcoin but subsequent stagnancy in Litecoin, has caused the altcoin to absolutely nosedive in terms of the LTCBTC trading pair. But with a handful of potential reversal signals forming on the ratio, things soon could turn around for an extended phase.

ltcbtc

A TD 13 signal has triggered on the LTCBTC monthly | Source: LTCBTC on TradingView.com

LTCBTC Reversal: The Sign That Things Could Finally Turn Around For The Altcoin

After Litecoin peaked, it spend nine full months in a downtrend against Bitcoin until a TD 9 signal appeared. The altcoin then saw a short-term boost with its halving in 2019, but after it peaked then, its been all about Bitcoin in the crypto industry ever since.

Following a bear market bounce, the altcoin fell for another consecutive 25 months, ignoring another TD 9 and instead reaching a TD 13 countdown on monthly timeframes. Coinciding with a narrowing pattern on the Relative Strength Index, an explosive breakout is imminent.


The same powerful 13 countdown is evident on quarterly timeframes also | Source: LTCBTC on TradingView.com

The TD 13 has also appeared on even more powerful timeframes, such as the LTCBTC quarterly represented in the chart above.

Related Reading | Five Signs Litecoin Has Bottomed, Next In Line For New ATH

Zoomed in even further for the chart below, there’s even a TD 9 within the past week on daily timeframes.

A less powerful TD 9 on daily timeframes may have kicked off the turning point | Source: LTCBTC on TradingView.com

Both a TD 9 and TD 13 signal suggest a trend is reaching a point of exhaustion, and due to turn around. And it already has since the daily TD 9 triggered.

The LTCBTC pair is now higher, and there’s green forming in a sea of red finally. If the tides finally turn, and Bitcoin maintains relatively high prices, the cost per Litecoin could explode as it finally plays catch up with the likes of its digital gold counterpart, Ethereum, and the rest of the altcoin space.

Featured image from Deposit Photos, Charts from TradingView.com

How One Ethereum Could Soon Be Worth Half A Bitcoin

Ethereum just cleanly broke above $2,000 for the first time ever, and the altcoin has been soaring since. The milestone has revived talk about an altcoin season and even a “flippening” of Bitcoin itself.

And while that’s unlikely to happen, technical analysis of the ETHBTC pair could suggest that one full Ethereum will soon be worth nearly half a full Bitcoin. Here’s a closer look at the bottoming pattern on the trading pair that could spark the first true altcoin season since 2018.

Face That Facts: Ethereum Riding DeFi High, More Bullish Than Bitcoin

The cryptocurrency market has matured over the last several years. Bitcoin is now being widely adopted by institutions as a hedge against inflation. Ethereum, once the playground for ICOs and fly by night altcoins, has now become a hotbed for value, generated from various DeFi projects, NFTs, stablecoins, and more.

As well as Bitcoin is doing, it is Ethereum that is blossoming into an enormous ecosystem, and things are only going to be better when scalability is finally addressed properly.

Related Reading | Ethereum Bullish Retest Offers “Once-In-A-Lifetime Opportunity”

Rising fees have been a costly side effect of the DeFi explosion, but is also a sign that Ethereum is the place on the blockchain that everyone wants to be. To get in, you’ve got to pay the price of popularity.

The demand for ETH gas required for each and every transaction has helped the altcoin outperform even Bitcoin. But according to technicals, one full ETH could be worth around half a BTC, and then some.

ethereum bitcoin ethbtc adam and eve

Breaking above resistance could cause fireworks on the altcoin/BTC ratio | Source: ETHBTC on TradingView.com

How Adam And Eve Could Birth An Altcoin Season

The chart above of the ETHBTC trading pair shows a massive Adam and Eve double bottom structure. Based on the measure rule, the target of the sizable pattern would result in a move to the 0.7 range on the ratio.

That means, that each Ether token would be worth roughy 70% of a full BTC. At current Bitcoin pricing, that would send Ethereum to $42,000 per ETH.

Related Reading | Before And After: The Ethereum Fractal You Have Got To See

A more likely scenario, is that due to how crowded Bitcoin is for a trade right now, the top cryptocurrency sees a strong correction, while Ether prices continue to dominate for the time being.

ethereum bitcoin ethbtc head and shouldersThe same applied measure rule would take ETH to the neckline of the "Eve" | Source: ETHBTC on TradingView.com

For those skeptical about the validity of such a claim, the above chart displaying the measure rule target of a head and shoulders pattern almost perfectly lines up with current all-time high resistance on the ratio.

The pattern confirming, would take Ethereum to the neckline of the larger Adam and Eve structure on the Bitcoin pair. A further breakout there, could result in enough upside momentum for Ethereum to achieve halfway status to Bitcoin at the very least.

A breakout of the neckline should also solidify the chances of a greater crypto market altcoin season.

Featured image from Deposit Photos, Charts from TradingView.com

Filecoin (FIL) Sells Off After Delivering Grayscale-Driven Bumper Rally

Filecoin dropped ahead of hitting its previous record high, near $273.57, prompted by profit-taking among traders.

FIL Market Outlook

The FIL/USD exchange rate slipped closed Thursday down 2.82 percent despite logging its second-best historic level of $239.94 in the same session. Traders started securing their profits at the local top amid falling bids, leading to a 22.65 percent decline ahead of the session’s end.

Filecoin stabilizes near $180 after its recent rally. Source: FILUSD on TradingView.com

Friday was slightly better as Filecoin attempted a brief rebound. The coin managed to float above its newfound support area near $180 while pursuing a retest of its recent high of $239.94. Its revival following the overnight sell-off appeared as a part of a broader uptrend across the altcoin market.

Read further: TA: Ethereum Revisits $2K, Why The Bulls Are Not Done Yet.

The price action showed investors’ continued trust in the Filecoin ecosystem. In general, it is a platform that allows users to sell their excess digital space on an open platform. Storage providers and users conduct traders over its blockchain using FIL token.

Meanwhile, FIL has a limited supply cap of 2 billion tokens. About 600 million of those FILs stay with Filecoin’s parent company Protocol Labs (with 6-year linear vesting) and its team and investors (again, with a 6-month to 6-year linear vesting). Meanwhile, Filecoin has allocated about 2.5 percent of the total 600 million FIL to fund its fundraising or ecosystem development.

The rest of the FIL supply powers the supply storage trades atop the Filecoin protocol, thereby ensuring that the token has a concrete utility and long-term value.

Institutional Accumulation Brings Retailers

New York investment firm Grayscale Investments introduced a Filecoin trust in March to its range of similar crypto-enabled services. In retrospect, the firm enabled institutional investors to gain exposure in the FIL markets without purchasing or managing the token. That prompted Grayscale to increase its FIL reserves, reflecting that institutions showed interest in the Filecoin project.

Grayscale Filecoin Trust increases FIL holdings. Source: ByBt.com

Two weeks after its introduction, Grayscale Filecoin Trust added 45,550 FIL to its reserves. The firm continued to hold it, showing no concrete selling pressure from institutions. That shows that the latest FIL plunge surfaced from the retail market.

Wu Blockchain, a fintech journalist, based in China, said the demand for FIL tokens is coming from the mainland.

“China is crazy for Filecoin, with a 24h increase of more than 30%, reaching a maximum of $236. The 24h trading volume of FIL in Huobi, China’s largest exchange, reached $24.2b, nearly three times the volume of the second ETH $8.8b, Bitcoin was $7.8b. FILDOWN, a short-selling leveraged token in Binance FIL, plummeted by 53%, with a turnover of US$3.4 billion, indicating a large number of short FIL liquidation in Binance.”

Photo by kaleb tapp on Unsplash 

Mathematical Mystery: Why Did The Bitcoin Rally Stop At The Golden Ratio?

Bitcoin is one of the most interesting and powerful pieces of mathematical code out there, launched as an open source project by the mysterious Satoshi Nakamoto.

In yet another one of the many ways math and mystery come together in relation to the cryptocurrency, its origins, and the underlying technology, the current peak in recent price action also just so happens to taken place perfectly at the golden ratio. But why?

Math, Mystery, And So Much More: Crunching The Cryptocurrency Numbers

Math is one of those love it or hate it subjects in school, but no one can discount just how powerful it is when used effectively. It is by definition “the study of quantity, structure, space, and change.”

When it comes to Bitcoin, math is everywhere around it. The hard-capped “quantity” of BTC will always remain at 21 million, while the “structure” of its code maintains that maximum cap.

Related Reading | Third Time’s The Harm: Trader Warns Of Bitcoin Reversal Pattern

“Space” in this case, isn’t in reference to moonshots, but in the geometric shapes and patterns that appear on Bitcoin price charts, which “change” with each buy or sell order.

Math is integral to quantifying data in fundamental analysis, and measurements go into plotting the lines and averages of technical indicators.

However, there’s no easy way to explain why the cryptocurrency’s recent bull rally, has topped out at a key mathematical area.

bitcoin golden ratio

Why did Bitcoin stop at the golden ratio? | Source: BTCUSD on TradingView.com

Bitcoin Bull Rally Takes Pause At Golden Ratio, But Why?

Strangely, the current high in Bitcoin price is $61,800. At first glance, nothing appears to out of the ordinary about the number. But there very well could be some serious significance that could explain why momentum is beginning to turn around.

The number, now more than three times its 2017 record, just so happens to be 61.8% to the price point most investors are HODLing for, which is $100,000 per coin.

The golden ratio itself is 1.618, with the inverse as 0.618. The number is used in technical analysis as one of the Fibonacci retracement levels with the most significance.

Fib retracement and extensions are measured from lows to highs or vice versa, while in the case of the current rally, price action stopped instead at 61.8% of the way to the speculate target of $100,000.

Related Reading | Heads Up: Bearish Bitcoin Technical Pattern Shouldn’t Be Shrugged Off

It is a theory that cannot be proven, nor is it fully understood why the golden ratio is found so commonly throughout nature and within the price charts of assets like cryptocurencies.

Renowned twentieth-century artists such as Salvador Dalí have included the golden ratio within their works, “believing this to be aesthetically pleasing,” according to Wikipedia.

It also appears in various places within nature, such as within the pattern of leaves, or the spiral of the Nautilus shell. But could it also be the ideal zone for the speculators to begin taking profit before the bull market keeps going?

Featured image from Deposit Photos, Charts from TradingView.com

Bitcoin Closes Best Quarter In History, But A Bearish Signal Lingers

Bitcoin price closed the historically red month of March not only in the green, but with the largest dollar for dollar gain on in the cryptocurrency’s short history.

Unfortunately, despite how strong the ongoing bull trend has been during the first quarter of the year so far, the quarterly candle which ended alongside March, also closed with a massively bearish signal.

Bitcoin Closes Quarterly With Record Gain, But Bearish Signal Couldn’t Be Avoided

Due the fact that both of Bitcoin’s largest bull markets topped as the fourth quarter of each year the concluded, Q1 is one of the worst quarters for the leading cryptocurrency by market cap.

Even in 2020, the quarter ended with a bearish bang, taking Bitcoin back under $4,000 before it was all said and done. This year, March came, but bulls sustained the month in the green, closing out what is now the largest monthly candle in terms of total dollars moved.

Related Reading | Heads Up: Bearish BTCUSD Technical Pattern Shouldn’t Be Shrugged Off

The quarterly candle climbed double during the month, adding more than $28,000 per coin to the trending cryptocurrency’s price tag. Despite the enormous move, Bitcoin would have had to pump more than $20,000 to $30,000 more to avoid the first ever bearish divergence on the quarterly RSI.

Bitcoin btcusd quarterly bearish divergence

The quarterly Bitcoin candle closed with the largest gain ever, but left a bearish divergence behind | Source: BTCUSD on TradingView.com

Relative Strength Index Forewarns of Bearish Second Quarter of 2021, Before Bull Trend Resumes

According to the Relative Strength Index, a trend strength measuring gauge, the current trend is less strong than the buying momentum that took Bitcoin to $20,000 the first time – even though it is currently trading at three times that.

A bearish divergence appears when price action and technical indicators move in the opposite manner, revealing weakness in price action.

The current bull market peak is set at $61,800, and if the bearish divergence confirms, things could turn down for some time. The raging bull cryptocurrency, however, has shaken off nearly every bearish signal since Q4 of last year when the initial breakout took place.

Related Reading | Third Time’s The Harm: Trader Warns Of Bitcoin Reversal Pattern

A correction at current levels would likely be healthy for Bitcoin, bringing more interest and demand to the market with more supply to be bought overall.

Bitcoin has never closed more than five consecutive quarterly candles green, however, and the most recent close was its fourth. If the current quarterly candle closes green, chances are the top in Bitcoin could be in.

If things close red, however, the bull run might have another full year left of upward trajectory, once any short-term correction is out of the way.

Featured image from Deposit Photos, Charts from TradingView.com

Dogecoin Rallies After Elon Musk Commits “Literal Moon” to DOGE Bulls

Dogecoin rallied on Thursday after Elon Musk committed that he would send the meme cryptocurrency to the moon — literally.

The billionaire entrepreneur tweeted that SpaceX, a space technology company he owns, would take a “literal Dogecoin to the literal moon.” The cryptic message ignored to dwell into the hows and whys, but it was strong enough to send a bullish signal across the Dogecoin market. As a result, the DOGE/USD price exploded.

As of 0800 UTC, the pair was trading at $0.071, up 33.94 percent from its intraday opening rate. It looked obvious that traders played a prank of themselves by blowing Mr. Musk’s tweet out of proportion, given it arrived on April Fools’ day.

Dogecoin price rallies on April Fool's Day. Source: DOGEUSD on TradingView.com
Dogecoin price rallies on April Fool’s Day. Source: DOGEUSD on TradingView.com

Dogecoin is notorious for undergoing massive upside rallies over good-for-nothing factors. Last year, in July, a viral TikTok video urged daytraders to pump DOGE/USD bids to $1. The shenanigans were able to take the pair as far as 0.005 after pumping it by up to 155 percent in just three days of trading. It crashed by more than 50 percent after the social media-led buying frenzy.

A similar viral campaign surfaced in late January 2021. Dogecoin bulls pushed the prices by a whopping 1,299 percent in just two days of trading in a copycat rally, inspired by Redditors-led GameStop stock-buying mania.

The intraday upside rally originated from the same prankster bulls — on the day that celebrates pranks.

Dogecoin Pump or Dump Ahead?

The April Fool’s Dogecoin rally carries massive risks for traders who want to enter the cryptocurrency market at its sessional highs. A clear lack of concrete upside catalyst, coupled with a potential liquidity crisis, hints at a heavy profit-taking scenario ahead. In short, only traders with braver risk appetites could tread Dogecoin’s waters.

Dogecoin starts crashing. Source: DOGEUSD on TradingView.com

As of this press time, DOGE/USD was crashing down from its intraday high. It slipped by up to 15.52 percent ahead of the US session, breaking below a flipped support level of $0.06 to turn it back into support. The next downside target appeared at the mid-March resistance level near $0.05.

Photo by Maciej Ruminkiewicz on Unsplash 

Go Phish: How This Bitcoin Investor Lost 17 BTC To An iPhone App

Bitcoin is once again making headlines everywhere, mostly for all the right reasons this time around. However, where there’s money to be made, there’s also scammers waiting in the shadows to steal funds whenever they can.

The latest situation involves a highly sophisticated replica of a popular Apple iPhone app, a malicious application from Apple’s App Store, and a now stolen 17 BTC.

Bitcoin Investor Has Half A Million Dollars Worth Of BTC Stolen

During the height of the 2017 bull market, one of the symbols that cryptocurrencies had “made it” was when Coinbase had been topping the Apple App Store for iOS devices for days on end. Investors were flocking to the platform in droves as Bitcoin FOMO took over.

These days, there’s much more variety out there, including more ways to buy or store cryptocurrencies beyond just Coinbase alone. The platform remains the most popular out there, set to go public within the next year or so.

Related Reading | Bitcoin Searches Spike On Google After Twitter Scam Goes Viral

Investors can also store their coins in third-party wallets, or use an app interface to interact with their hardware wallets, like Ledger or Trezor.

That’s exactly what Phillipe Christodoulou meant to do, but instead lost a staggering 17.1 BTC – worth over a half a million dollars – in a phishing scam.

bitcoin phishing 17 btc

The more expensive Bitcoin gets, the more scammers it attracts | Source: BTCUSD on TradingView.com

Beware Of Phishing Scams In Apple App Store, Social Media, And Elsewhere

Christodoulou downloaded a highly rated, five-star app from Apple’s App Store, the company’s flagship and regularly quality-controlled platform. Apple maintains certain standards, and works to prevent situations like this from happening.

But then why did it? Christodoulou is furious with the company and rightfully so. He is also demanding answers and justice.

“They betrayed the trust that I had in them,” he told The Washington Post. “Apple doesn’t deserve to get away with this.”

Scammers regularly pull this tactic with Apple’s App Store, and unfortunately, this application somehow snuck through. The app was posing as a Trezor app, bearing the company’s logo and all.

Related Reading | The Most Common Bitcoin Scams And How To Avoid Them

But after loading it with his life-savings, it wasn’t until later he had realized what had unfolded. The app was a phishing app, and now his 17.1 BTC are in the hands of a scammer.

Scams like this are unfortunately common wherever users aggregate and offer a back door to crypto assets. Even real, verified apps or in other situations, social media accounts, can still get hacked and result in a loss of coins.

It’s also important to always keep legitimate apps or wallets fully up to date, to avoid any loop holes or security vulnerabilities that have since been fixed, but must be installed through user intervention.

Featured Image From Deposit Photos, Charts From TradingView.com

Third Time’s The Harm: Trader Warns Of Bitcoin Reversal Pattern

Bitcoin price is back at local highs, but still struggling to set a new record beyond $61,800. The lack of a further push by bulls even with positive news out of PayPal, has caused one iconic trader to warn of the possibility of a topping pattern forming.

The theory is based on a set of technical analysis tools the trader himself created. But what exactly is a “Three Pushes to a High” pattern and what might it suggest about the coming price action?

John Bollinger, Bollinger Band Creator, Warns Of Bitcoin Reversal

The leading cryptocurrency by market cap is only a few hundred dollars below $60,000 – an area that has resulted in repeated rejections. It has been the first major area of supply catching up with the overwhelming demand for Bitcoin ever since the pandemic first began.

But as the dollar strengthens, and gold prices fall early bull run levels, Bitcoin could see its first major correction. Various technicals are overheated, causing the once powerfully trending cryptocurrency to respond less and less positively to news that drives adoption further.

Related Reading | Career Commodities Trader Warns Bitcoin Community Over Coinbase Concerns

For example, the Tesla pump has yet to retrace, while the following rally related to the announcement that the company had enabled Bitcoin for payments was immediately wiped out.

The most recent bullish news, has PayPal finally enabling its customers to use crypto at its millions of merchants globally. However, further record highs have yet to materialize. The lack of continued enthusiasm around the asset class has prompted iconic trader John Bollinger to warn of a potential topping pattern in Bitcoin.


What Is A Three Pushes To A High Technical Chart Pattern?

Bollinger, who created the Bollinger Bands technical analysis indicator, often speculates publicly via Twitter regarding his thoughts on where Bitcoin goes next. In the past, he’s given a heads up and told the trading community when it’s “time to pay attention,” but ultimately leaves the predictions up for debate.

His latest tweet warns that Bitcoin could be forming a Three Pushes to a High pattern. He offers no further clues as to why he’s making such a warning, only calling the rare pattern by name.

In technical analysis, there’s all sorts of patterns, mostly following a naming convention mimicking the shapes they take, such as triangles or head and shoulders. But there’s a wide world of wacky patterns across Japanese candlesticks and indicators themselves that provide potentially profitable trading signals.

bitcoin bollinger bands three pushes to a high

Not all the conditions are met currently for the pattern to confirm | Source: BTCUSD on TradingView.com

Because the pattern is rare, there’s very little educational materials that exist aside from those instructed by Bollinger himself. Upon further research, Bollinger in the past has shared the conditions as part of  a “micro-lesson” in TA.

Related Reading | Heads Up: Bearish Bitcoin Technical Pattern Shouldn’t Be Shrugged Off

The living legend reveals that a Three Pushes to a High typically is accompanied by lower peaks in %B, the Bollinger Band Width turning down, and finally, confirmation when the BBTrend tool also turns down. As of right now, that’s the missing piece of the puzzle.

bitcoin bollinger bands three pushes to a high zoomed

But they sure appear similar to the last time the bullish impulse ended | Source: BTCUSD on TradingView.com

Zooming out shows that this might not be the first instance of this pattern, and could also indicate that a more extended peak is near – at least potentially for several months, until demand is reestablished and prices move higher.

Because BBTrend hasn’t turned down, there’s a chance not all conditions have been met yet for a deeper correction to yet trigger.

If Mr. Bollinger is incorrect about the theory, and he’d be the first to agree that these are simply predictions based on probabilities, then Bitcoin will blast off like never before.

Featured Image From Deposit Photos, Charts From TradingView.com

Career Commodities Trader Warns Bitcoin Community Over Coinbase Concerns

Peter Brandt is an iconic trader who in the past called the dramatic fall to the Bitcoin bear market bottom, nearly a year ahead of time. Could the commodities trader with decades of experience in all things markets – who has for sure seen a thing or two in his career – now be forewarning of an alleged collapse of the popular cryptocurrency exchange Coinbase?

His tweets appear to imply so, calling into question several mounting concerns related to the company. Here’s what’s going on regarding the bold claims made by Brandt, and what Coinbase could allegedly be hiding.

Career Trader Makes Bold Calls, Accurately Predicts Bitcoin Bottom One Year Out

Words can carry a lot of weight. They come with even more significance depending on the mouth they’ve come from, and depending on that person’s experience or clout.

When it comes to pure classical technical analysis, few would argue that Peter Brandt is among the best of the best living today. He’s got nearly 50 years trading and speculating under his belt, and he’s charted everything from corn to manure, to of course, Bitcoin.

Related Reading | Peter Brandt Calls For 80%+ Bitcoin Price Decline Over A Year Ago With Chilling Accuracy

Brandt has been a public supporter of the leading cryptocurrency by market cap, but has also been labeled a “hater” due to his sometimes painful calls that bring exuberant investors back to reality – something they tend not to like.

Brandt was labeled as such after calling for a drop to under $4,000 in January 2018, nearly a full year before the cryptocurrency reached such a bottom of the bear market.

His experience allows him to see things that others cannot, but are his latest claims over Coinbase issues accurate?

bitcoin Peter brandt coinbase crypto

Brandt's calls have had wizard level accuracy in the past due to his experience | Source: BTCUSD on TradingView.com

Peter Brandt Slams Crypto Exchange Coinbase Over Concerns, “Signs Of Trouble Ahead”

Peter Brandt went on a tirade on Twitter recently, blasting popular cryptocurrency exchange Coinbase and its CEO Brian Armstrong with a string of currently unsubstantiated claims.

Brandt warns that during his time in markets, he’s witnessed three major brokers go under, and that each presented the same clues ahead of time that Coinbase currently is.

After listing several “signs of trouble ahead” Brandt tagged the SEC and FINRA Twitter handles asking for a deeper dive into the company ahead of any IPO.

Related Reading | Massive Coinbase Outflows Suggest Bitcoin Price Is Ready To Bounce

Brandt’s lash out was eventually tempered, instead leaving behind tweets with a more “wait and see” tone. He admits he’s got no insider knowledge of such a situation existing – just a strong opinion he says gets even stronger when his experience with past brokers provides all the conviction needed.

Coinbase has only had a clear track record thus far, and while it has been subject to controversy surrounding fees or even unscheduled downtime, there’s never been any evidence of any wrongdoing. Brandt’s foresight has been accurate in the past – is he once again seeing something the rest of the market can’t?

Featured image from Deposit Photos, Charts from TradingView.com

Buying With Bitcoin? PayPal Fine Print Reveals Swap To Fiat

Today, news broke that PayPal is ready to launch cryptocurrency payments to merchants, allowing its massive userbase of millions to pay with Bitcoin and the other altcoins has offered since the middle of last year.

However, like all things related to centralized platforms getting involved in cryptocurrencies, there’s a catch.

PayPal To Allow Customers To Pay With Bitcoin, Litecoin, Ethereum and BCH

As the company promised when cryptocurrency support was first announced, PayPal has followed up with rolling out support to allow customers to pay at its 29 million merchants globally.

PayPal users can now pay for goods and services through the platform using the four assets offered, including Bitcoin, Litecoin, Ethereum, and Bitcoin Cash.

Related Reading | Internet Celebrities Lead $5M Investment In Bitcoin Reward Program Lolli

The initial announcement that the company would offer cryptocurrencies is the spark that set off the bull run, but the execution of their plan has been criticized since.

PayPal doesn’t allow users to move cryptocurrencies out of their custody to a wallet of their own choosing – defeating the purpose of the technology itself. In addition to issues with storing crypto assets, there’s also a catch when it comes to spending crypto.

bitcoin btc paypal fiat dollar news

Could the PayPal news be enough to push Bitcoin through resistance to new all-time highs? | Source: BTCUSD on TradingView.com

Paying With Crypto Involves First Swapping To Fiat

The PayPal news caused Bitcoin to once again rocket higher, and it could be the necessary momentum to push the cryptocurrency through resistance and to new all-time highs.

The initial PayPal news caused the breakout to begin with, so another leg higher could be in the cards. Regardless of the bullish price action resulting from the more recent news, once again its not all positive for cryptocurrency users.

Related Reading | Pizza Day 2.0: Buying A Tesla With Bitcoin Could Be A Mistake

In the same vein as other technology-defeating methods the company utilizes, PayPal also swaps any crypto assets out for fiat immediately before making the transaction. What’s really happening is that cryptocurrencies themselves aren’t being spent, but instead are being sold into cash and cash itself is being exchanged.

Rather relying on each cryptocurrency’s respective protocol to handle the transaction from wallet to wallet, PayPal has instead created a centralized system and wallet garden yet again. Companies like the brand have taken on a “if you can’t beat ’em, join ’em” approach with crypto over the last year or so, but have stopped short of fully embracing what the technology itself has to offer.

Who knows, though. Perhaps PayPal is doing its users a favor by encouraging them to hold rather than spend, which in the past has proven to be a mistake anyway.

Featured image from Deposit Photos, Charts from TradingView.com


Heads Up: Bearish Bitcoin Technical Pattern Shouldn’t Be Shrugged Off

Bitcoin price is struggling to get back above $60,000 currently, but bears thus far have been unable to swat price action away from local highs. The push and pull between the two opposing market forces have resulted in a bearish price pattern potentially forming, that anyone paying attention to cryptocurrency might want a heads up about.

If bulls ultimately shrug off the recent attempt to take over by bears, new highs are ahead. However, if this technical pattern confirms, the first significant correction could be coming sooner than later in crypto.

Bitcoin Price Peaks Could Be Forming Head And Shoulders Reversal Pattern

Bitcoin price action in 2021 thus far has been like a rocket ship without any atmosphere to penetrate, soaring without any formidable resistance. It is only recently after reaching above the current highs over $60,000 that the cryptocurrency has struggled to continue toward new highs with ease.

The most recent resistance level has led to weeks of consolidation, switching from bearish to bullish and back on shorter timeframes, while the underlying trend has remained “only up.”

Related Reading | How Bitcoin Price Could Shed 50 To 70% If Momentum Turns Down

The natural tug of war between buyers and sellers have left a zig-zagging pattern on the price chart that – if things turn down from here – could soon form a head and shoulders reversal pattern.

The pattern is only a little more than two-thirds of the way through, currently near what should be the inflection point of the pattern.

bitcoin daily head and shoulders

A head and shoulders could take bulls by surprise, before moving higher again | Source: BTCUSD on TradingView.com

The Ongoing Showdown Between Bullish BTC Fundamentals And Bearish Technicals

The battle between buyers and sellers of Bitcoin is currently at an impasse, and when either side eventually waves the white flag, there could be a long streak of green or red to follow.

If the pattern is invalidated with a rise to a new all-time high, the cryptocurrency’s bull run is back on full steam, and could see prices a lot closer to $100,000 per coin within the next month or two.

If price action cannot sustain and push higher, the pattern will confirm, any long positions built in the area will be forced to cover, and much larger move down could result.

Technically, based on the measure rule, a return to around $40,000 per coin would be the target of the bearish structure, but would be far from putting the greater bull trend in jeopardy.

Related Reading | Bitcoin Technicals Overheated, But Bullish Fundamentals Remain Unfazed

A correction, very well could even be healthy, even if price action goes deeper than most would expect. Technical indicators are overheated, and market sentiment could use a reality check.

Regardless of these factors, however, fundamentally, the bull run isn’t going anywhere anytime soon. Despite indicators so hot and bothered, fundamentals have barely flinched in the face of the ongoing consolidation slash correction.

What few coins are left on exchange are leaving at a rate of tens of thousands per week, and most adoption metrics haven’t reached previous signs that might indicate a peak is in.

All of these factors conclude that Bitcoin could see an overdue correction, but any dips would continue to be bought up by institutions.

Featured image from Pixabay, Charts from TradingView.com

Before And After: The Ethereum Fractal You Have Got To See

Ethereum price over the last couple of years has outperformed even Bitcoin’s, making it the most bullish cryptocurrency among the top three assets. But a fractal brewing in the altcoin could make for an incredibly bearish outcome if history repeats.

Here’s a closer look at the bearish cryptocurrency chart fractal potentially warning of a reversal, and the before and after you’ve got to see to believe.

Ethereum Fractal Says The Bull Market Is Finished For The Top Altcoin

Ethereum price has long been soaring right alongside Bitcoin, but since tapping above $2,000 per Ether token, the top ranked altcoins has been struggling with resistance since.

Related Reading | Ethereum Bullish Retest Offers “Once-In-A-Lifetime Opportunity”

Crypto analyst are torn whether the price action is bullish or bearish. One theory claims that the recent retest of the altcoin’s former all-time high presents a “once-in-a-life-time opportunity” for those who missed out on the initial rally.

Other analysts aren’t so sure. One crypto trader in particular has discovered a fractal in Ethereum price action, that closely resembles a more extended version of the 2017 bull market breakout.

Ethereum fractal

The 2019 and 2020 price action is an extended fractal of the last bull run breakout | Source: ETHUSD on TradingView.com

The price action preceding the 2021 breakout closely resembles that of the price action during 2019 and 2020 that caused the cryptocurrency to soar to current prices. It’s what comes next, however, that must be seen to be believed.

Are Fractals Something To Fear, Or Do They Fail More Than They Follow Through?

All crypto bull rallies eventually come to an end, and bears regain control. The problem is, the fractal one crypto trader found, could indicate that is exactly what is about to happen with Ethereum price action.

After slamming into powerful resistance – then at around $1,400 per ETH – the altcoin corrected and fell into an extended, painful bear market. With the preceding price action matching the current patterns so well, albeit a much more extended version, could another bear phase soon follow?

Ethereum fractal 2

What came next, however, was a multi-year bear market in cryptocurrencies | Source: ETHUSD on TradingView.com

Fractals, while frightening to see taking shape, often fail and have earned themselves more of a fable reputation among the crypto community than fact.

Things are very different this time around, most significantly, the amount of upside that happened in Ethereum before the peak was in.

Related Reading | Alt Season 2.0: Analyst Claims It’s “Showtime” For Ethereum

Back then, Bitcoin has also topped out, and few in the crypto space would worry that the currently ongoing bull market in the top cryptocurrency is anywhere near over.

Still, the similarities are there enough to take caution if you are holding the altcoin.

Featured image from Pixabay, Charts from TradingView.com

Pizza Day 2.0: Buying A Tesla With Bitcoin Could Be A Mistake

Bitcoin price has seen some serious volatility ever since Elon Musk revealed on Twitter that his company Tesla would begin accepting Bitcoin as a form of payment.

Almost immediately, the social media platform was filled with screenshots of those filling orders, but these eager buyers ready to exchange their coins could end up living with enormous regret. Here’s how two delicious pizzas fit into that puzzle, and why even something more valuable like a Tesla could still be a bad purchase in the end.

How Spending BTC On A Tesla Could Be An Enormous Mistake

This week, Tesla and SpaceX CEO and Founder Elon Musk revealed the green car auto maker had enabled the company’s website to accept Bitcoin as a form of payment for the vehicles offered.

Related Reading | Crypto Analyst Claims MicroStrategy Is “On The Ropes” Amidst Bitcoin Selloff

The internet was set abuzz with the news, and the price per coin soared initially. A rejection at resistance shook up the market for a brief stint – ahead of this week’s historic options expiration.

But as crypto bull Max Keiser points out, ten years from now, people will be shocked that someone was foolish enough to have spent a whole Bitcoin on a Tesla.

The comment isn’t meant as an insult to anyone taking the plunge and buying a Tesla with their coins, but is a reality that hindsight might end up making the purchase a regrettable one. Returning a Tesla is also a catch-22 for those paying in BTC.

The One Time Eating Pizza Was Regrettable, But Without It Bitcoin Might Not Be

On May 22, 2010, Laszlo Hanyecz announced via the BitcoinTalk forum that he had successfully purchased two pizzas in exchange for a total of 10,000 BTC.

At the time, the coins were worthless by all standards, not even yet trading for a penny each. In his mind, he was getting a great deal and making history by completing the first ever documented transaction for goods involving Bitcoin.

bitcoin lazlo pizza

Laszlo Hanyeczcspent 10,000 BTC on pizza, now worth around half a billion USD | Source: BTCUSD on TradingView.com

Today, those 10,000 BTC are worth half a billion dollars, making those two pizzas the most regrettable pizzas of all-time. Even someone who got food borne illness from a pie, would have less lasting impact than wondering what could have been.

A Tesla now costs nearly a full coin – which is a heck of a lot more valuable than two pizzas. However, given how fast cars depreciate the moment they’re driven off the lot, and how far Bitcoin could ultimately climb in years to come, could make buying a Tesla with BTC just as regrettable as Laszlo’s transaction in 2010.

Related Reading | Get BTC Back For Spending Instead With Bitcoin Reward Program Lolli

In ten years’ time, people could be appalled by the idea of spending a full coin on a car. The major difference between these people and Laszlo, is that he’s a pioneer that will forever by synonymous with the history of the cryptocurrency, potentially being a primary factor in its development into what it has become today.

Who knows, without his proof-of-concept purchase of two pizzas, the technology might have failed to gain mainstream adoption. And while buying a Tesla is cool and all, there’s nothing more recognizable than a delicious pizza pie.

Featured image from Deposit Photos, Charts from TradingView.com

Massive Coinbase Outflows Suggest Bitcoin Price Is Ready To Bounce

Bitcoin price is reeling from a strong rejection from above $60,000 that has sent the leading cryptocurrency by market cap tumbling back down by more than $10,000 per coin. However, massive ongoing outflows of BTC continue to leave popular cryptocurrency exchange Coinbase Pro at an alarming rate.

The overall lack of BTC supply that only shrinks further by the day, will once again be dominated by demand, potentially causing the previously trending cryptocurrency to bounce. Could that bounce develop into a resumption of the historic uptrend? Here’s what fundamentals are saying about further continuation or correction for Bitcoin price ahead.

Coinbase BTC Outflows Continue, What Corporations Are Potentially Buying The Dip?

Bitcoin price is down more than $10,000 from its current all-time high, yet still more than double the previous peak set back in 2017.

The leading cryptocurrency has now spent more than 100 days above the former high, and likely will never return to levels near or below it.

Related Reading | Stablecoin Supply Rising, Diminishing Bitcoin Reserves Ready To Fuel Next Leg Up

In fact, Bitcoin price action might not deviate much lower than current levels, thanks to massive Coinbase Pro outflows.

Thousands of BTC leaving the popular cryptocurrency exchange catering to institutional investors has been called the most bullish signal “ever” and that was hundreds of thousands of BTC ago.

Technical factors are overheated in the cryptocurrency after such a sizable price increase, but soon, fundamentals could take over leading to a strong bounce.

Bitcoin Price To Bounce As Supply Shock Expected To Overpower Bearish Technicals

Thus far, the presence of institutions and corporations with deep wallets and cash reserves with dwindling buying power has left very little room for corrections.

Dips are being bought up long before retracements reach to past bull market totals, but that doesn’t mean momentum can’t finally turn down for even a brief time.

bitcoin coinbase corproations

Institutions and corporations buying each dip is preventing any serious corrections | Source: BTCUSD on TradingView.com

But eventually, regardless of any technical factors, no BTC left to buy could cause a supply shock that drives prices to hundreds of thousands of dollars per coin before demand begins to wane again, and available supply returns to exchanges for investors to take profit.

Related Reading | Coinbase Bitcoin Outflows Are The Strongest Bullish Signal “Ever”

At that point, the top will be in. For now, the ongoing massive outflows suggest the top is nowhere near in sight, and that bigger players are currently buying the blood in the streets.

The line in the sand drawn between bears and bulls moving higher lies at $60,000. Another move beyond that level could be an all-clear sign that the rally is ready to continue higher.

Featured image from Deposit Photos, Charts from TradingView.com

Crypto Analyst Claims MicroStrategy Is “On The Ropes” Amidst Bitcoin Selloff

MicroStrategy and its head honcho Michael Saylor have become synonymous with Bitcoin, responsible for kicking off the corporate treasury reserve trend that’s transpired ever since.

As a result of the innovative, albeit risky move, company shares skyrocketed to revisit dot com-bubble resistance levels. The rejection, has left MicroStrategy “on the ropes” amidst the recent Bitcoin selloff, suggesting things could potentially get a lot deeper.

Michael Saylor Keeps Buying Bitcoin As Prices Plummet

Raging Bitcoin bull Michael Saylor has spent the last several months being the mouthpiece of the top cryptocurrency by market cap, essentially acting as its CEO, marketing department, corporate business development manager, and social media manager all-in-one.

He uses his platform as a way to spread the word about the cryptocurrency’s value, which he has repeatedly double, and tripled down on, and then some.

Related Reading | This Bitcoin Metric Says The Bull Market Might Soon Be Over

At the rate he’s going, the guy will have a wallet containing more BTC than Satoshi another year or so from now. Up until recently, this has been paying off dramatically for Saylor and anyone he influenced and bought BTC, as the price per coin has been rising substantially.

microstrategy Bitcoin btc saylor

MicroStrategy shares went parabolic like Bitcoin | Source: NASDAQ-MSTR on TradingView.com

In tandem, the price per share of MicroStrategy (MSTR) also went parabolic, mimicking the current Bitcoin price chart.

The recent selloff and potential peak in the leading cryptocurrency by market cap, is following a similar trajectory downward after doing the same on the way up.

MicroStrategy Shares On The Ropes, Here’s Why Investors Could Be Uneasy

MicroStrategy shares are now “on the ropes,” according to one top crypto analyst.  A potential retest could be in progress, and if the attempt fails, it could be a technical knock out for the corporation’s crypto-fueled rally.

But could this also mean that sentiment is shifting enough in Bitcoin for MicroStrategy to be affected this negatively? That same theory vice versa doesn’t make sense.

Whatever the case may be, there is a chance that Saylor’s bet on Bitcoin will be right, but was still a little too soon for the cryptocurrency.

microstrategy Bitcoin btc saylor bitcoin

Michael Saylor's company shares were hit hard post dot com era | Source: NASDAQ-MSTR on TradingView.com

Where the recent MicroStrategy rally topped out, was at resistance dating back to the dot com bubble. When that popped, Saylor was reportedly left as one of that era’s biggest losers financially, according to Fortune Magazine. Saylor had lost a total of $13.5 billion.

Related Reading | Why March Is The Bloodiest Month In Bitcoin History

Once again, Saylor could end up losing out big due to his commitment to being a pioneer in the cryptocurrency. The bold bet in Bitcoin has paid off, but his continued push has made many investors question his speculative bet – which could be behind the correction in MicroStrategy shares in the first place.

Featured image from Deposit Photos, Charts from TradingView.com