Bitcoin Hits ‘Danger Zone’: Peter Schiff Warns Of ‘Do or Die’ Scenario

Bitcoin is facing a critical juncture as it has entered a ‘danger zone,’ according to prominent gold advocate Peter Schiff. This investor, known for his skepticism toward Bitcoin, suggests that the cryptocurrency is entering a “do or die” phase, potentially marking the end of its bullish run if current trends continue.

Breaking Points And Bearish Signals

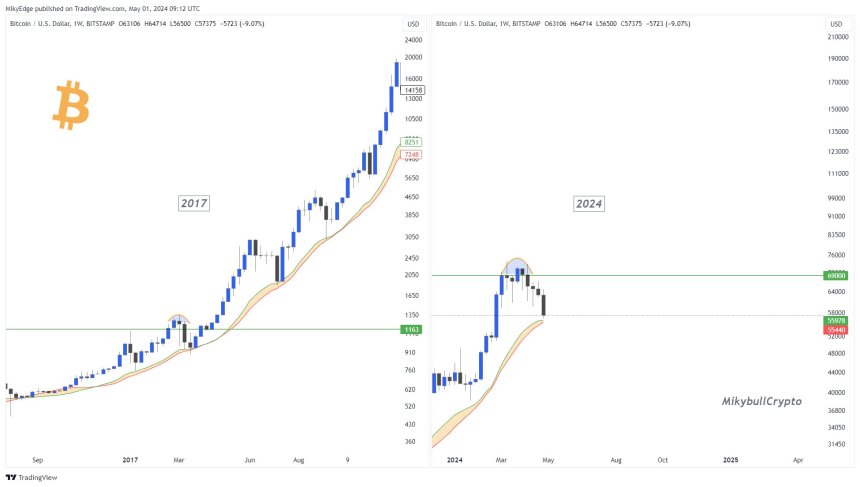
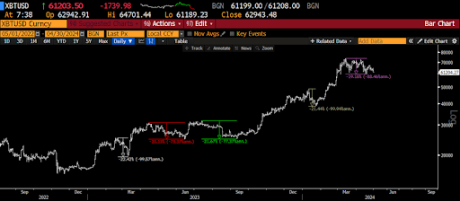
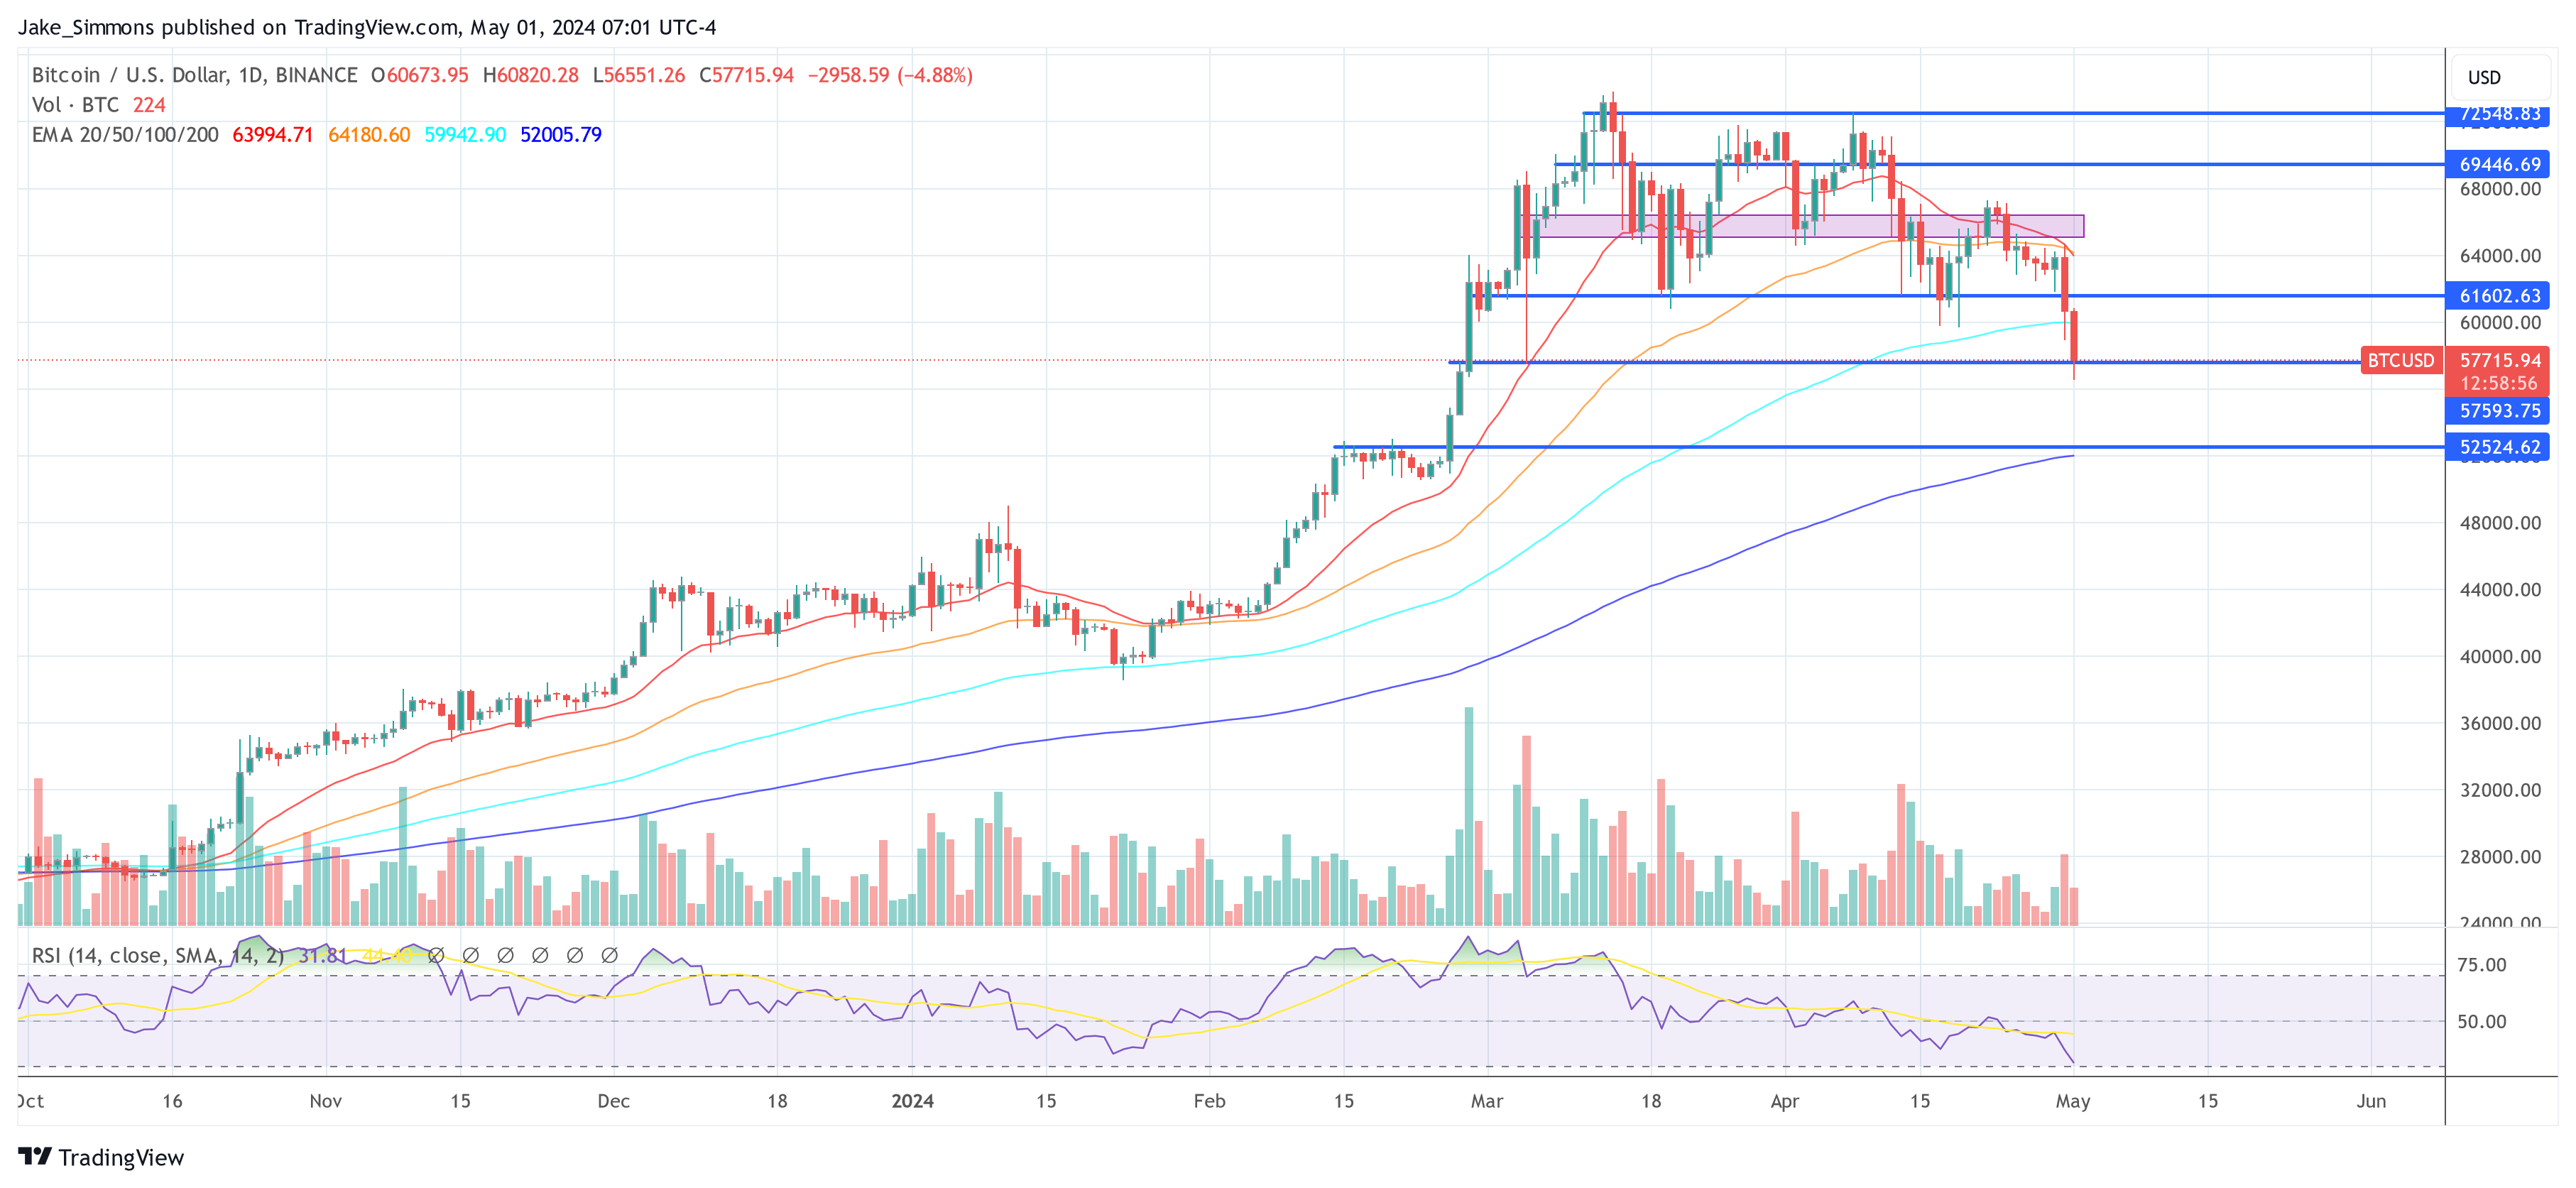
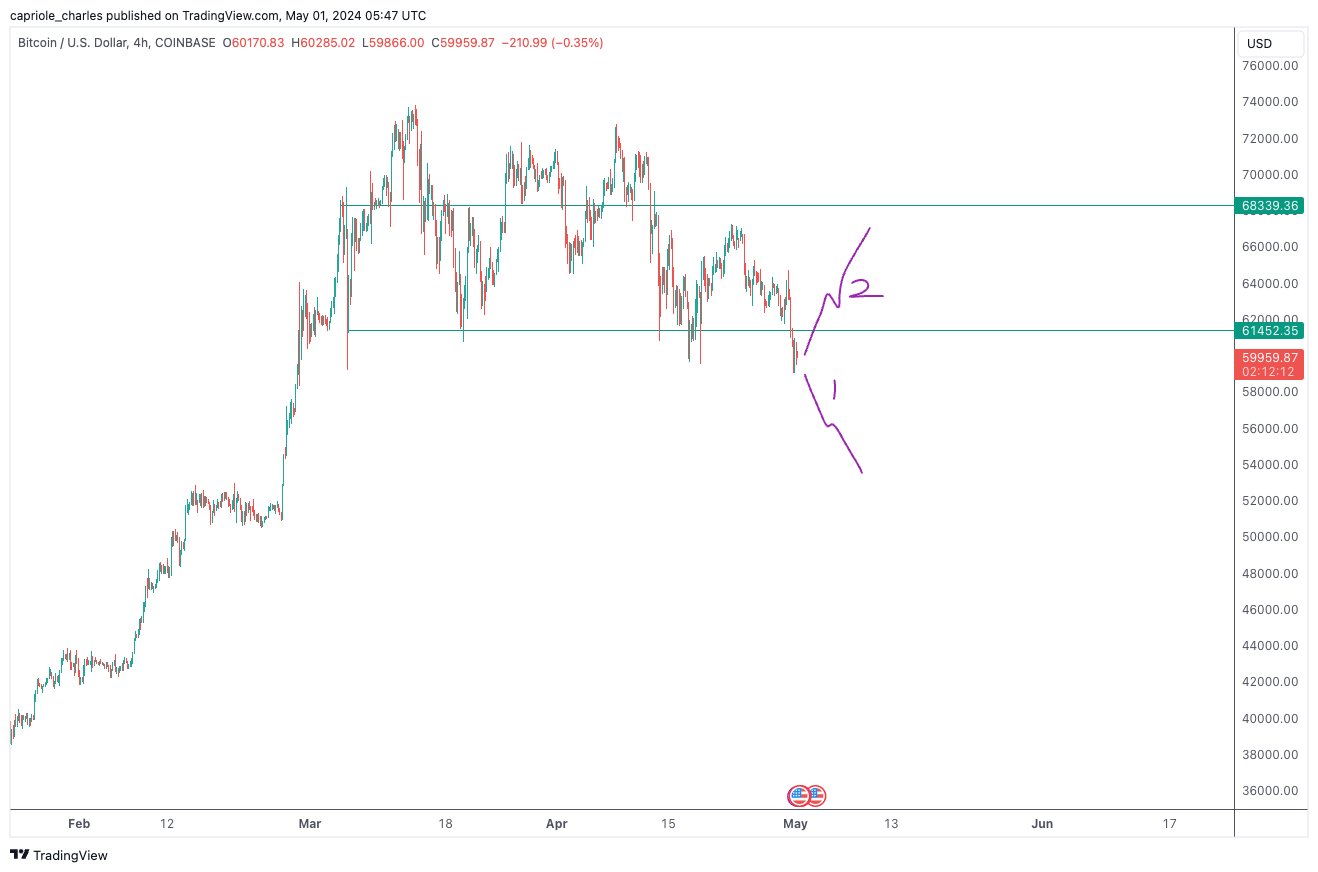
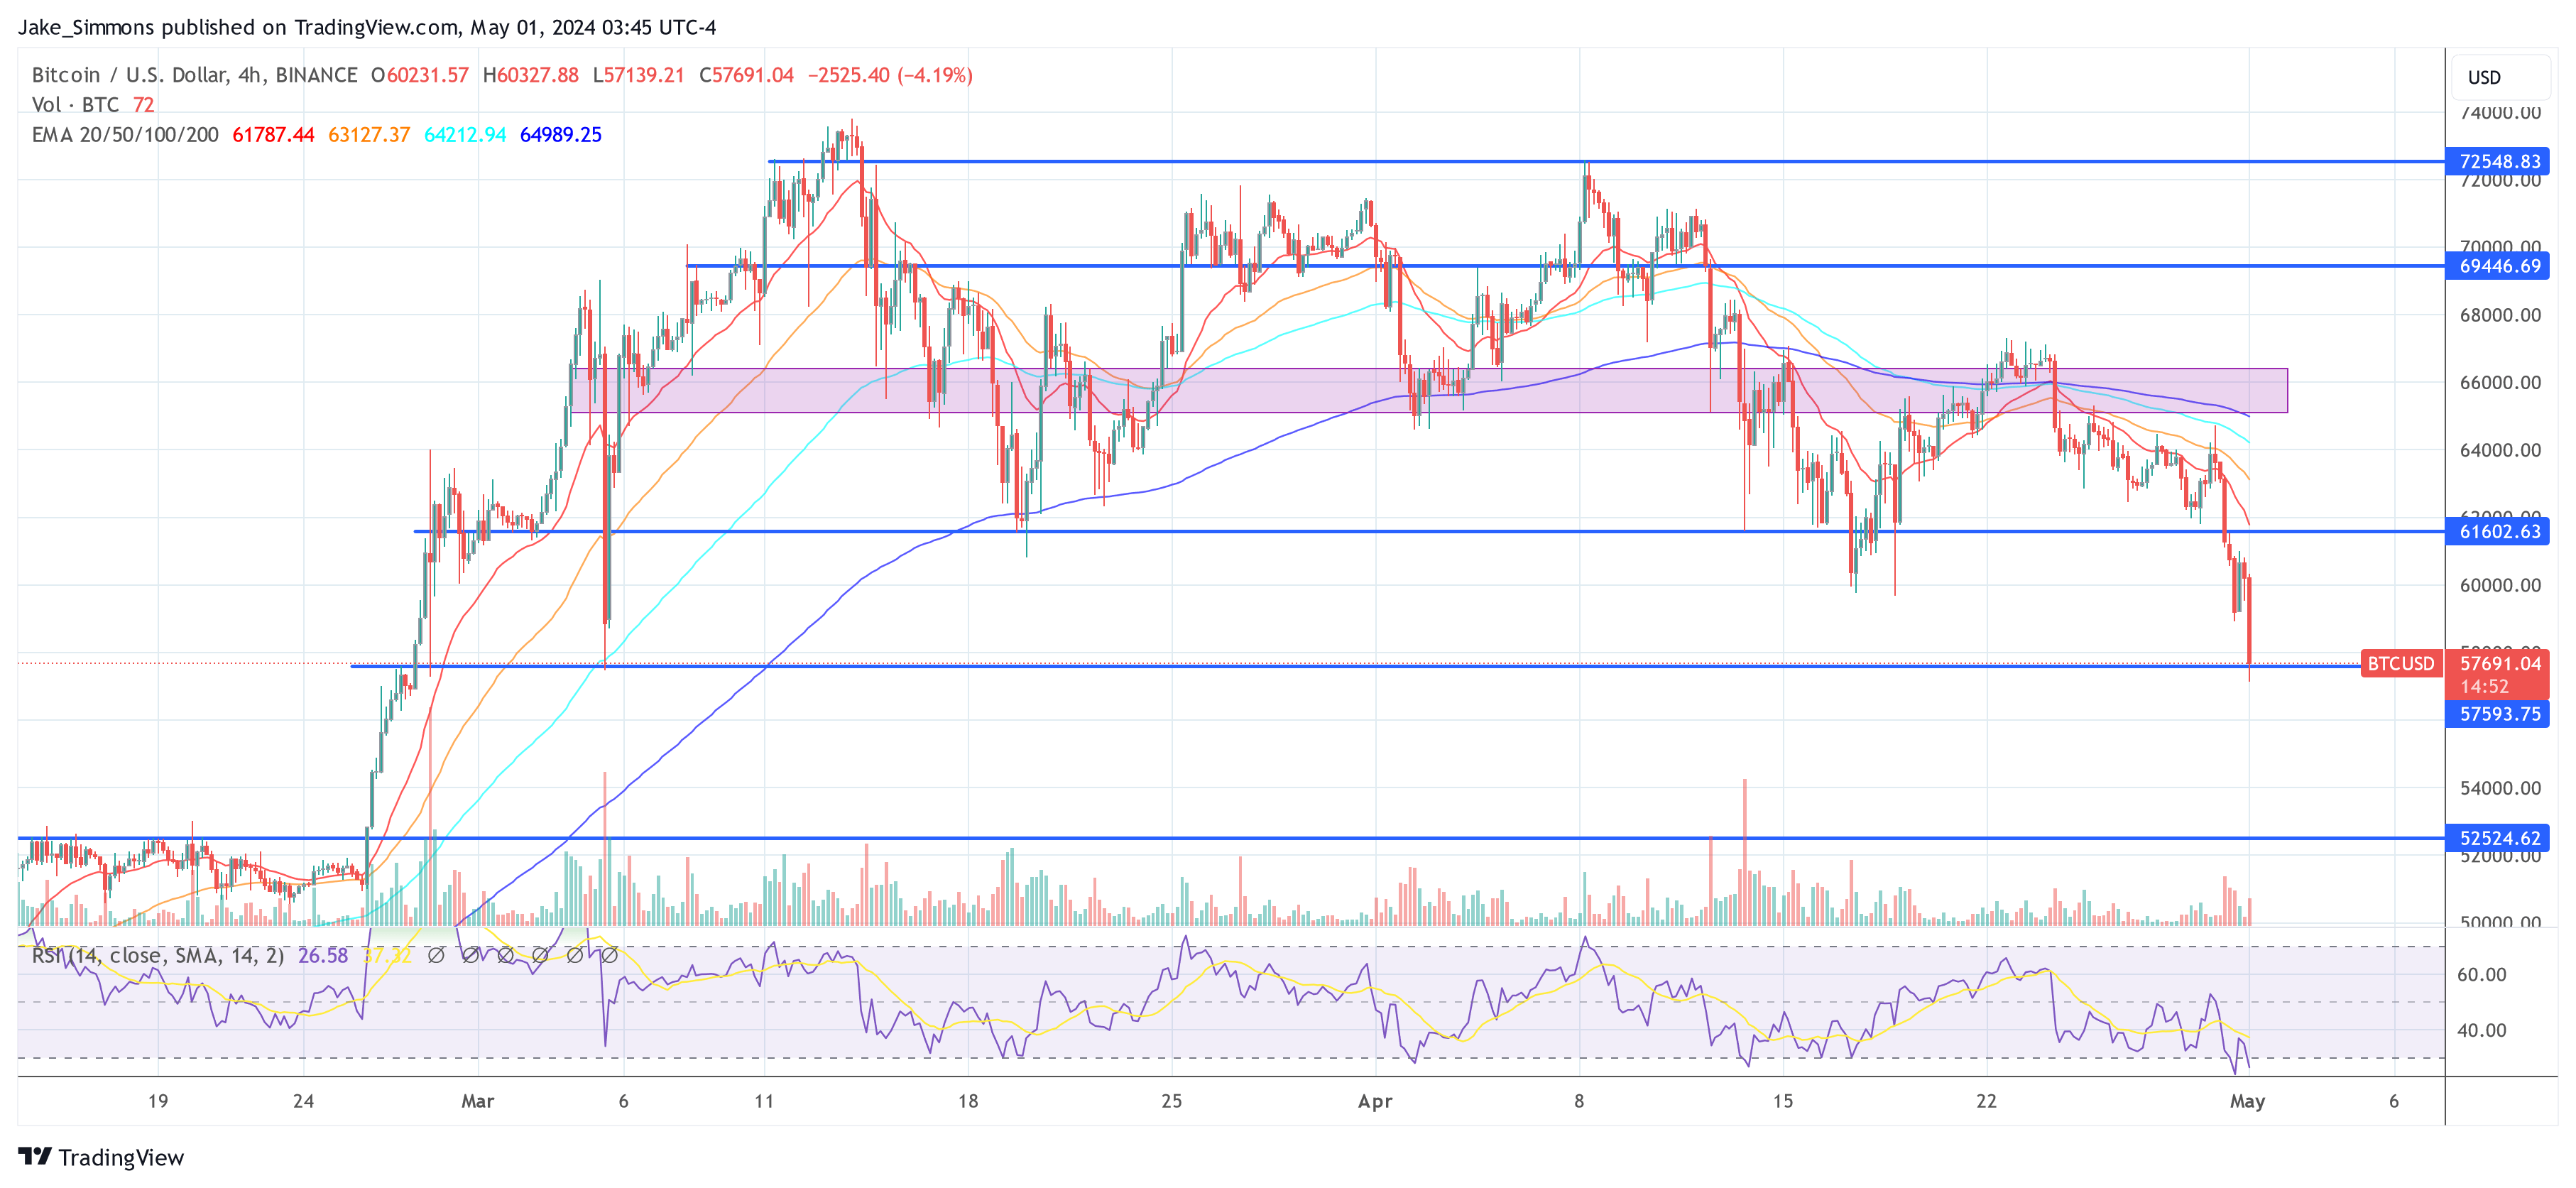
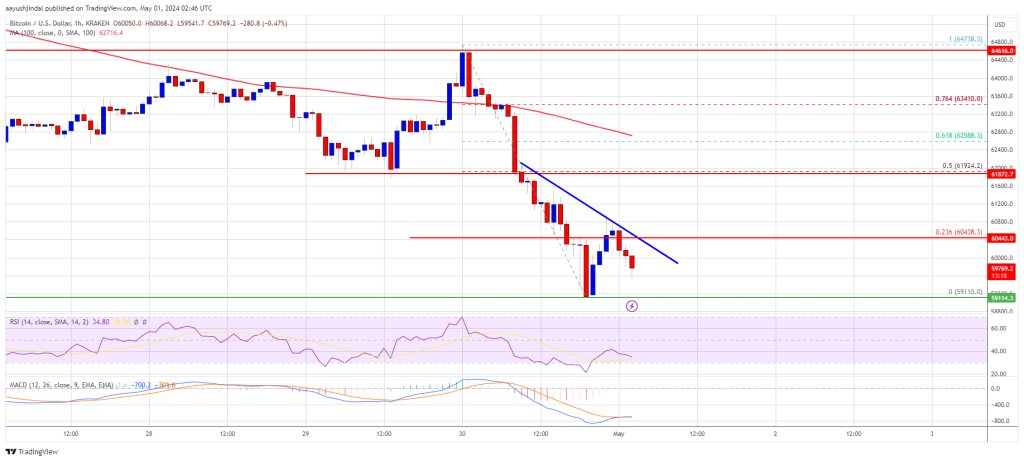
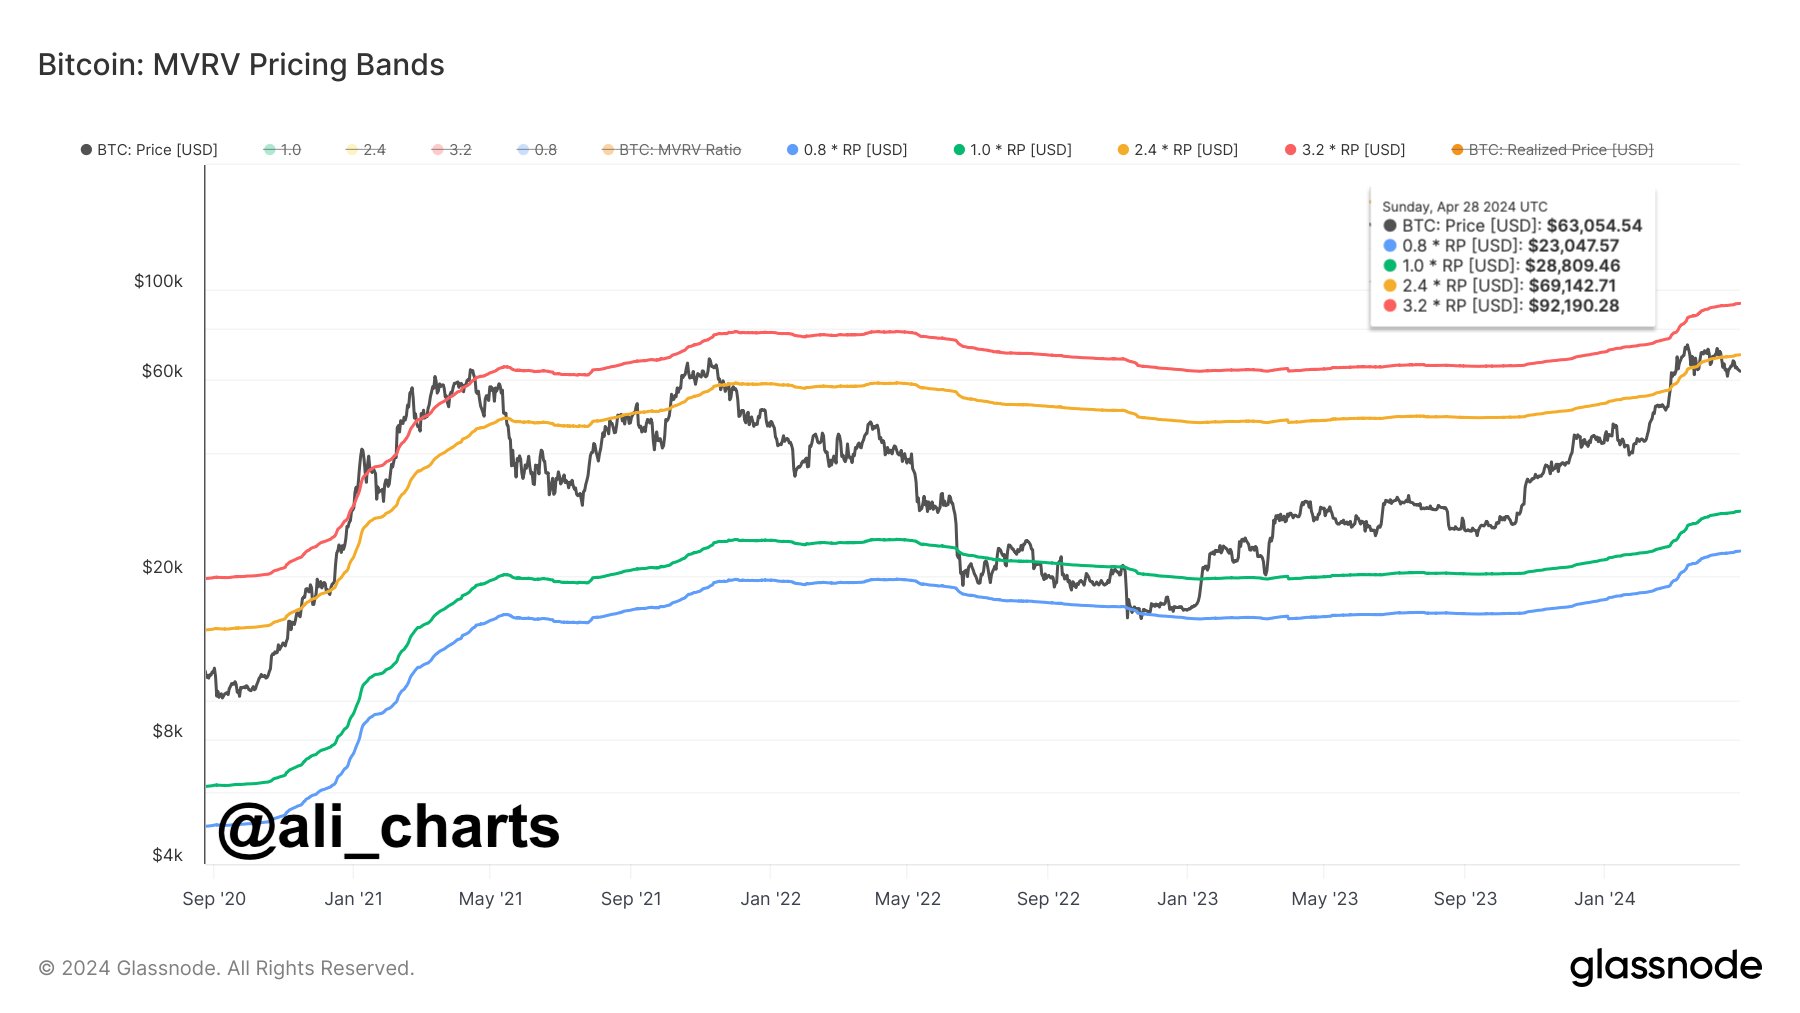
Peter Schiff has often voiced his bearish outlook on Bitcoin, and his latest comments come as Bitcoin has just slipped below the crucial $60,000 mark.

This level had previously served as strong support during the short-term bull run, and its breach has intensified the bearish sentiment among investors. Schiff warns that staying below this threshold could spell doom for the bullish fervor, potentially derailing Bitcoin’s momentum.

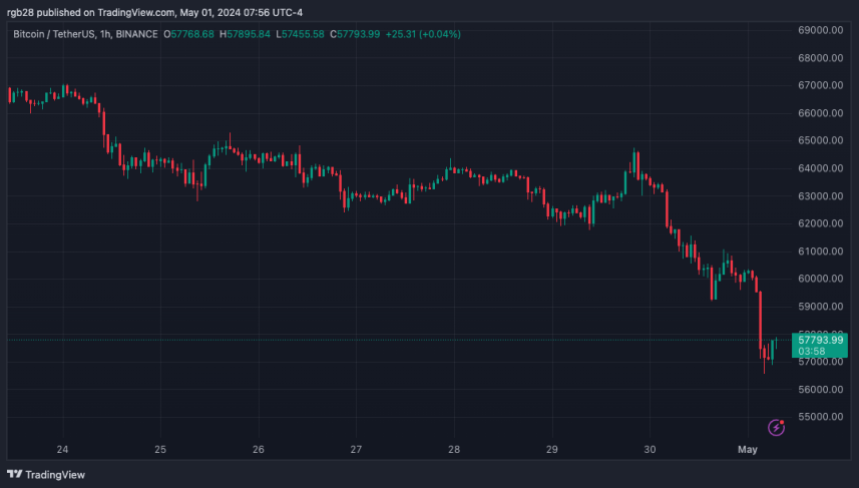
At the time of writing, Bitcoin is trading at approximately $57,054, teetering close to its 100-day Exponential Moving Average (EMA). Schiff points out that remaining below this EMA could confirm a bearish trend, signaling an end to the rally.

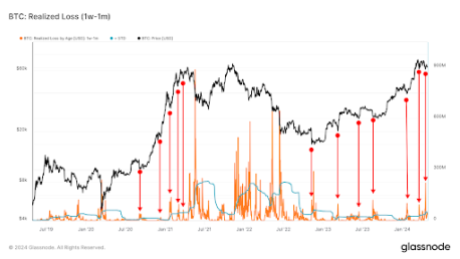
Amidst these developments, the market has seen an increase in trading volume, coupled with the price drop, indicating strong selling pressure.

Over the last 24 hours, Bitcoin’s trading volume has dropped from $45 billion to $48 billion, coinciding with a 6.3% price dip during the same period. This heightened activity is a traditional bearish indicator, lending weight to Schiff’s prediction of a downturn.

Moreover, investor sentiment is treading thin ice with significant outflows from Bitcoin spot ETFs, hitting a weekly high of $162 million. This departure of funds is particularly poignant as it unfolds just before the FOMC meeting, where potential interest rate hikes are on the agenda.

These outflows reflect a broader market trend, with the Grayscale Bitcoin Trust (GBTC) experiencing a substantial daily outflow of $93.23 million.

The Bitcoin ETF Conundrum And Market Forecasts

It is worth noting that last month was quite challenging for US Bitcoin ETFs. After a promising start with positive inflows in the initial months following their launch, April witnessed collective outflows amounting to $182 million across all active spot Bitcoin ETFs in the US.

This pullback is attributed to macroeconomic concerns and geopolitical tensions, which have clouded the investment landscape.

Bitcoin (BTC) price chart on TradingView

As the market braces for further turbulence, analysts such as Micheal Van de Poppe are forecasting an additional correction, potentially pushing Bitcoin’s price down to $55,000 before any sign of recovery.

Featured image from Unsplash, Chart from TradingView

Finance Expert Raoul Pal Says 20% Bitcoin Correction Only Temporary As Euphoria Will Return

Co-founder and Chief Executive Officer (CEO) of Real Vision, Raoul Pal has shed light on the current market state and the future outlook of Bitcoin, the world’s largest cryptocurrency. Despite the cryptocurrency witnessing declines of more than 15%, the financial expert has uncovered a significant pattern that indicates a potential bull flag following Bitcoin’s price correction. 

Crypto Expert Unveils “Banana Zone” Rally For Bitcoin

In an X (formerly Twitter) post published on Tuesday, April 28, Pal shared a yearly chart depicting Bitcoin’s price movements from October 2023 to April 2024. At the time of writing, Bitcoin’s price is trading below the $60,000 mark, at $59,185, marking monthly declines of 15.12% and weekly lows of 11.31%, according to CoinMarketCap. 

The crypto analyst has suggested that Bitcoin’s recent price correction was a temporary setback. He predicts that once the market fully refreshes, what he calls “the Banana zone” will kick in. He also described Bitcoin’s recent price declines as a “pause that refreshes.” 

The pause emphasizes the final days of the crypto spring, a period marked by renewed optimism after bearish markets. A prime illustration of this phase occurred when Bitcoin surged to new all-time highs, surpassing $73,000 in March, following its decline from 2022 to 2023. 

On the other hand, the Banana zone represents a phase characterized by intense market excitement and the possibility of significant price increases. However, Pal has described this distinctive period as “when the market begins to anoint the new big L1 or L2, which explodes even vs SOL.”

The financial expert noted that once the Banana zone commences, it may pick up momentum towards the end of the year and continue well into 2025, potentially reaching peak mania. He also shared a historical pictorial analysis illustrating his Bitcoin predictions. 

In the chart, the price of Bitcoin witnessed a Banana zone rally from $1,000 to $5,000 between 2014 and 2016 and from $10,000 to $60,000 between 2019 and 2020. Basing his predictions on this unique historical pattern, Pal suggested that Bitcoin’s price action from 2022 to 2024, starting at $50,000 could potentially skyrocket to a new all-time high of $300,000. 

Crypto Summer Is The Start Of Altcoin Season

Pal has predicted that after the crypto spring, a new season for cryptocurrencies will occur, termed “the crypto summer.” The financial expert has confirmed that this period will be the start of the altcoin season, highlighting that it is typically marked by an intense bubble in the crypto fall. 

During the crypto summer, Pal projects that Ethereum would begin to outperform Bitcoin while Solana would accelerate its outperformance of both Bitcoin and Ethereum. The financial CEO disclosed that the crypto summer and fall are often confusing, as cryptocurrencies tend to adopt a narrative and may get caught up in the prevailing euphoria. 

He predicts another two or more “nasty corrections” triggered by excessive leverage before the onset of the Banana zone. Additionally, Pal has indicated that three or four cryptocurrencies are set to lead the altcoin season, with one particular cryptocurrency emerging as the “Big new entrant,” much like Solana did during the previous cycle alongside Avalanche and Polygon.

Bitcoin price chart from Tradingview.com

Bitcoin Bottom Out? Analyst Signal Turnaround Amid Market Slump

Bitcoin has recently concluded April, marking its most significant monthly decline. Despite the bearish momentum, leading market analysts, including Michael van de Poppe, believe that the worst may soon be over, suggesting that Bitcoin is nearing the end of its current correction phase.

Bitcoin At The End Of Correction?

April was challenging for Bitcoin, as its value plunged nearly 20%, dipping below $57,000, the lowest level traded since late February.

This drop is part of an intense market sell-off that has slashed the combined cryptocurrency market cap by nearly 10%, bringing it down to $2.2 trillion. Amid these declines, Michael van de Poppe, a revered figure in the crypto analysis space, provided hope.

In his recent statements on the social platform X, Van de Poppe suggested that Bitcoin’s current price levels might be nearing the bottom of this correction cycle.

Bitcoin (BTC) price chart on TradingView

He highlighted the critical price range of $56,000 to $58,000 as pivotal for Bitcoin’s short-term trajectory, indicating potential areas for a rebound.

A Closer Look At Predictions And Market Sentiments

Van de Poppe isn’t alone in his optimistic outlook. Other analysts, like Checkmate, an on-chain expert, have analyzed Bitcoin’s historical data to predict future movements.

Checkmate introduced the term “chopsolidation,” describing it as a phase of stagnant yet volatile market conditions that could precede a significant bullish run.

He expects this phase to last about six months, followed by a potential 6 to 12 months of explosive growth reminiscent of past cycles. Furthermore, historical data from Bitcoin’s Halving years support the theory that after a halving event, the market tends to perform strongly towards the end of the year.

However, there are not all optimistic forecasts in the crypto realm. The spot Bitcoin ETF market witnessed over $300 million in net outflows in April, breaking a three-month streak of inflows, reflecting a broader sentiment of caution among investors.

Moreover, Charles Edwards, founder of Capriole Investments, has voiced concerns over the market’s extraordinary bullishness, warning of the necessity for corrections within such a volatile asset class.

Featured image from Unsplash, Chart from TradingView

Is This Cycle’s Bitcoin Bottom In? Analysts Forecast BTC Bounce Back

As May 1st started, Bitcoin (BTC) faced a new correction that made the price stumble under the $60,000 support level. The flagship cryptocurrency has seen several retraces during this bull cycle, with BTC swiftly recovering the crucial support zones each time.

However, in the past 24 hours, the largest cryptocurrency by market capitalization has struggled to regain its momentum. Some analysts believe Bitcoin’s bottom this cycle might be in as this correction officially became its deepest retrace.

Is The Bitcoin Bottom Here?

In the early hours of Tuesday, Bitcoin started to plunge from the $64,000 price range. As the day continued, BTC prolonged its fall to briefly trading around $59,958 – $59,191 before recovering.

This time, the recovery didn’t last long as Bitcoin’s price resumed its downward trajectory to $57,000. In an X thread, crypto trader Milkybull examined some data suggesting the bottom might finally be in.

According to the analyst, BTC is “following the 2017 PA.” This would suggest that “either the bottom is in or close.” Moreover, he urged investors to remember that while good news “usually signals the top,” bad news signals a bull market’s bottom.

In the thread, the trader pointed out that the Bitcoin Bull Market Support Band indicator historically serves strong support during BTC’s bull cycles. As a result, he considers that the flagship cryptocurrency might “wick through the support and bounce back.”

Bitcoin, BTC

According to the analyst, Bitcoin and global liquidity are also strongly correlated, with BTC currently at a level it has previously bounced back from. These bouncebacks initiated “huge rallies across the crypto market” in October 2022 and October 2023.

Lastly, the thread highlighted that Bitcoin “is at a critical decision point for the local bottom.” The trader considers that while some call for a $48,000 bottom, the $51,000 support level might be where BTC bounces back to resume its cycle to this cycle’s top.

Bitcoin’s Deepest Retrace This Cycle

According to crypto analyst and trader Rekt Capital, this correction has officially been the deepest BTC retrace this cycle. Per the post, today’s -23.64% retrace surpasses the -22.91% retrace seen in February 2023.

The analyst also compared this cycle’s “Post-Halving” pullback to 2016’s. Moreover, the trader considers that this bullish cycle might be more similar to the 2016 one than investors think.

Previously, Rekt Capital listed three reasons these two cycles might be similar. Per the trader, the resemblances include the “Pre-Halving Re-Accumulation Range Breakout,” the “Pre-Halving Retrace Beginning,” and the “Similar Initial Reaction after the beginning of the Pre-Halving Retrace.”

After today’s retrace, the analyst added the “Continued downside in the three weeks after the Halving” as a fourth similarity between the 2016 and 2024 cycles. Like eight years ago, Bitcoin faces an “additional downside below the Range Low of its Re-Accumulation Range” in the three-week window after Bitcoin’s “Halving.”

Moreover, the analyst suggests that the current price development comes “as no surprise,” as it mirrors 2016’s “post-Halving Danger Zone.”

As of this writing, the flagship cryptocurrency is trading at $57,794.89. This correction represents a 6.2% drop in the past 24 hours. Similarly, BTC is registering 13.4% and 17.7% price decreases in the weekly and monthly timeframes.

BTC, Bitcoin, BTCUSDT

Bitcoin Investors Remain Unmoved Despite BTC Drop Below $60,000, The Worst Is Almost Over

On Wednesday, Bitcoin sharply declined, dropping below the crucial $60,000 support level. Despite this recent market downtrend, Bitcoin investors remain confident as they believe the flagship crypto can still reach new heights in this market cycle. Some say this might be what Bitcoin needs before making another parabolic run to the upside. 

Bitcoin’s Decline Is Nothing To Be Scared Of

Raoul Pal, the CEO of Real Vision, reassured in an X (formerly Twitter) post that Bitcoin’s recent price decline was not unusual, stating it was “pretty ordinary stuff.” He also pointed out that this was Bitcoin’s fourth 20% correction in the past 12 months, underscoring how normal these price movements are.  

Related Reading: Crypto Funds Mark 3rd Consecutive Weeks Of Outflows With $435 Million In Withdrawals

Bitcoin

Alex Thorn, Head of Research at Galaxy Digital, had previously warned that price declines of such magnitude were to be expected, stating that “bull markets are not straight lines up.” He noted that the same thing happened in the 2021 and 2017 bull runs when Bitcoin experienced about 13 price drawdowns of over 10% or more. 

Meanwhile, crypto analyst Rekt Capital claimed in an X post that “this is exactly what the cycle needs to resynchronize with historical price norms and the traditional Halving Cycle.” He added, “The longer this goes on, the better.” In another X post, he reassured his followers that Bitcoin is getting closer to its final bottom with each passing day. 

Like Rekt Capital, crypto analyst Mikybull Crypto also sounded confident that Bitcoin’s recent decline was just a part of the bigger picture for its move to the upside. They claimed this would be the “final shakeout before up, only rally to a cycle top.”

Thomas Fahrer, the CEO of Apollo, also shared his bullish sentiment towards Bitcoin, as he suggested that the crypto token’s volatility is what makes it a great investment. “Price might fall to $40K, but it might rise to $400K. That’s just how it is, and it’s a great bet. Bitcoin is still the best asymmetric opportunity in the market,” he wrote on X. 

Bitcoin Bull Run Is Far From Over

Crypto analyst Ali Martinez suggested that Bitcoin’s bull run was far from over while comparing Bitcoin’s current price action to the last two halving events. According to him, Bitcoin consolidated for 189 and 87 days around the halving in 2016 and 2020, respectively, before the bull run resumed. 

Bitcoin price

He further noted that Bitcoin has only consolidated for 60 days this time around, meaning that the flagship crypto will continue its run eventually. In a subsequent X post, the analyst stated that Bitcoin might be 538 days away from hitting its next market top if it follows its trend from the previous two bull runs.

Related Reading: Ethereum Flashes Bullish Signals, Can It Rally 50% From Here?

Before now, Martinez mentioned that Bitcoin could rise to a new all-time high (ATH) of $92,190 if it breaches the resistance level of $69,150. 

At the time of writing, Bitcoin is trading at around $59,600, down over 5% in the last 24 hours, according to data from CoinMarketCap.

Bitcoin price chart from Tradingview.com

Bitcoin Euphoria Cools Off As BTC Distribution Enters Fear Zone

Bitcoin has finally broken below the $60,000 support level for the first time in two months. The world’s largest digital asset has largely been in a euphoria phase since the beginning of the year, particularly after the launch of Spot Bitcoin ETFs in the US market. However, the current consolidation of the price of Bitcoin indicates the euphoria might be fading.

According to a new report from Glassnode, an on-chain analytics firm, the euphoria surrounding Bitcoin, which has been active for the past 6.5 months, looks to be fading. At the same time, the BTC distribution has entered into the fear zone and investors are now heavily weighted towards selling.

Selling Pressure Rises

After reaching an all-time high of over $73,737 in March 2024, Bitcoin has declined by more than 18% as investors take profits. This drop in price has been accompanied by a rise in the percentage of addresses holding losses, indicating increased selling pressure. The percentage of addresses making a profit has fallen in tandem from over 99% to 86% at the time of writing. 

Related Reading: Ethereum Flashes Bullish Signals, Can It Rally 50% From Here?

On-chain analytics platform Glassnode noted in its recent report the consolidation action. According to the Net Unrealized Profit & Loss (NUPL) metric, Bitcoin has been in a euphoria mode very early in this cycle when compared to past cycles. Notably, the NUPL crossed over 0.5 approximately 6.5 months before the just concluded halving amidst hype about Spot Bitcoin ETFs.

This is in comparison to the 2021 market cycle, where the NUPL was triggered into a profit zone 8.5 months after the Bitcoin halving. This metric suggests the market is still in its euphoria phase for the last seven months but has cooled off significantly due to correction in the past two months.

Interestingly, the report noted a “distinct uptick in net outflows” across all wallet sizes throughout April, indicating the current sentiment among traders. This means traders are now in a sell-side pressure across the board. Furthermore, a majority of short-term (one week to one month) holders have been posting losses on the 90-day +1sd level since March. 

Bitcoin

What Does This Mean For Bitcoin?

While the “fear” rating may worry investors, a pullback after such a steep price rise is considered healthy by most crypto analysts. Many long-term holders are still holding strong and are waiting for the halving effect to kick in. At the time of writing, Bitcoin is trading at $59,899 and is down by 5.35% in the past 24 hours.

Related Reading: Crypto Funds Mark 3rd Consecutive Weeks Of Outflows With $435 Million In Withdrawals

Considering the current cost-basis for short-term holders (STH) is at $66,700, and their realized price is at $59,800, many more holders in this cohort have possibly entered into the loss zone. 

According to crypto analyst Ali Martinez, $59,800 is a key price level to watch, as history has shown Bitcoin tends to bounce over the STH realized price.

Bitcoin price chart from Tradingview.com

Bitcoin Greed No More: Sentiment Back At Neutral After $57,000 Plunge

Data shows that Bitcoin sentiment has cooled off to neutral from greed following the asset’s latest plunge to the $57,000 level.

Bitcoin Fear & Greed Index Has Returned To Neutral Levels

The “Fear & Greed Index” is an indicator created by Alternative that shows the average sentiment among investors in the Bitcoin and wider cryptocurrency market.

This index estimates sentiment by considering five factors: volatility, trading volume, social media data, market cap dominance, and Google Trends.

The metric uses a scale that runs from zero to 100 to represent this average sentiment. All values under 46 suggest that investors are fearful, while those above 54 imply a greedy market. The zone between these two cutoffs naturally corresponds to the territory of neutral mentality.

Now, here is what the Bitcoin sentiment looks like right now, according to the Fear & Greed Index:

Bitcoin Fear & Greed Index

As displayed above, the Bitcoin Fear & Greed Index is at a value of 54, implying that investors share a neutral sentiment currently. However, the neutrality is only just, as the metric is right at the boundary of the greed region.

This is a significant departure from yesterday’s sentiment: 67. The chart below shows how the indicator’s value has changed recently.

Bitcoin Neutral

As the graph shows, the Bitcoin Fear & Greed Index has been declining recently. For most of February and March, as well as the first half of April, the indicator was in or near a special zone called extreme greed.

The market assumes this sentiment at values above 75. As the asset price struggled recently, the mentality cooled off from this extreme zone and entered the normal greed region. With the latest crash in BTC, the index has seen a sharp plunge, now exiting out of greed altogether.

Historically, cryptocurrency has tended to move against the majority’s expectations. The stronger this expectation, the higher the probability of such a contrary move.

This expectation is considered the strongest in extreme sentiment zones, as well as extreme fear and greed. As such, major bottoms and tops have often occurred in these territories.

The all-time high (ATH) price last month, which continues to be the top of the rally so far, also occurred alongside extreme values of the Bitcoin Fear & Greed Index.

With the sentiment now cooled to neutral, some investors may be watching for a fall into fear. This is natural because a rebound would become more probable the worse the sentiment gets now.

BTC Price

During Bitcoin’s latest plunge, its price briefly slipped below $57,000 before surging back to $57,300.

Bitcoin Price Chart

Bitcoin Milestone Ahead? Analyst Forecasts New Peak This Month

In the face of a general market decline and pessimism, Captain Faibik, a cryptocurrency expert and enthusiast, has emerged with an optimistic outlook for Bitcoin (BTC) foreseeable future trajectory, predicting that the crypto asset could rise to a new all-time high before this current month closes. 

Bitcoin To Reach New All-Time High In May

Faibik’s analysis, which is based on his in-depth knowledge of cryptocurrency dynamics and a sharp eye for market trends, explores the possibility of a large short-term rise in Bitcoin. According to the analyst, Bitcoin is at a key junction currently testing the daily Moving Average 100 (MA100) level once more after recovering from it in the past.

Bitcoin

Historically, the crypto asset has found considerable support at the 100MA level. Should BTC recover from this point on, Captain Faibik anticipates a significant rise on the upside in the upcoming days. Thus, he expects the digital asset to reach a new all-time high within the month.

The post read:

Last time, BTC bounced back from the daily MA100, and now it is testing it again. If it bounces back from here, we can expect a Bullish Rally in the coming days. New All the High could be incoming this month

The crypto analyst noted Bitcoin’s price action in the daily timeframe also suggests that a bullish rise is on the horizon. Faibik stated that on the daily timeframe chart, BTC is still moving above the major trendline and inside the green box indicated in his chart. As a result, the analyst expects BTC to undergo a quick comeback.

Related Reading: If History Repeats, This Is How Bitcoin Price Will Perform In The Next 6 Months

Another notable finding from Captain Faibik is that the daily Relative Strength Index (RSI) has been drifting below a trendline that has been in place for some months. Although this might indicate a brief waning of positive momentum, Faibik interprets it as a sign of an impending price recovery for Bitcoin. Given that BTC is still moving inside the bullish flag pattern, the expert anticipates a bounce back towards $68,000 in the upcoming days.

$100,000 Price Target For BTC

Captain Faibik’s most bullish target for BTC recently is the $100,000 price mark. Last week, Faibik pointed out key narratives that could catalyze Bitcoin’s price to $100,000 in the coming months.

According to the expert, the presence of bullish investors in the market was the reason why BTC was trying to make a comeback in the previous week. Thus, for a significant price increase to $100,000, these investors must retake the crucial resistance level of $72,000.

Furthermore, Faibik highlighted that BTC Bulls have solidly secured the weekly Exponential Moving Average (EMA) 10 following the October 2017 Descending Channel breakout. Due to this, the crypto analyst is setting $100,000 as the digital asset’s next price target.

Following a decrease of more than 13% over the previous 7 days, the price of Bitcoin is currently trading at $57,701. In the last day, its market cap has plummeted by over 6%, while its trading volume has increased by about 61%.

Bitcoin

Bitcoin Price Dips Below $57,000: 4 Key Reasons

Bitcoin (BTC) has witnessed a significant drop, falling to $56,556 during Wednesday morning in Europe, marking the lowest point since late February. This downturn represents the sharpest monthly decline since November 2022, with BTC tumbling approximately 7.5% within the last 24 hours and breaching the previously stable $60,000 support late Tuesday.

#1 Derisking Before Today’s FOMC Meeting

Anticipation and anxiety are high in financial circles as the Federal Open Market Committee (FOMC) is set to announce its interest rate decision later today. This event is crucial as the crypto market, notably Bitcoin, has grown increasingly reactive to macroeconomic signals.

Recent data, reflecting a slowdown in GDP growth coupled with persistent inflation, has significantly reduced expectations of interest rate cuts by the Federal Reserve. “Bitcoin and other risk assets are currently feeling the pressure from a stagflationary environment, geopolitical tensions, and seasonal liquidity variations,” remarked Ted from TalkingMacro.

Initially, up to seven rate cuts were anticipated by the end of 2024, a sentiment that has shifted dramatically with the market now pricing in only one potential cut by December 2024. This shift comes amidst an environment where inflation data is trending upwards, challenging the Federal Reserve’s position and potentially leading to a more cautious approach from Jerome Powell, the Fed Chairman.

“For the first time in recent memory, the market is calling the Fed’s bluff, quickly front-running the idea that the Fed may not cut at all in 2024,” noted Ted.

#2 Cyclical Bitcoin Correction Phase

Following an exceptional rally since the year’s start, the market is undergoing a natural correction phase. Prior to the price crash, Charles Edwards, founder of Capriole Investments, noted: “We are a day short of breaking the record set in 2011 for days without a meaningful dip [-25%],” emphasizing the extraordinary nature of Bitcoin’s recent performance.

Scott Melker, known as “The Wolf Of All Streets,” highlighted technical indicators that suggested an impending correction. “Broke and retested range lows as resistance. […] My biggest concern I have been discussing for months [was] that RSI never made the trip to oversold. Almost there now, all lower time frames oversold. This is still ONLY A 23% correction, very shallow for a bull market and consistent with other corrections on this run. We are yet to see a 30-40% pull back during this bull market, like those of the past.”

#3 Profit-Taking

Traditional finance markets and seasoned investors are seizing the opportunity to take profits following substantial gains. “TradFi/Boomers are taking profits: CME Open Interest is decreasing rapidly, April 29th 135,6k coins, April 30th 123,9k coins, topped around 170.4k coins (March 20th),” explained crypto analyst RunnerXBT.

This trend confirms a broader profit-taking strategy post significant events like the ETF approval and the anticipation around the Bitcoin halving. “That […] confirms my thesis that a lot of these guys longed in October 2023 because of ETF approval and BTC halving, trade played out and now they are taking profits (yes they are still up a lot), because they longed BTC not dead altcoins.”

#4 US ETF Flows And Hong Kong Disappointment

The dynamics surrounding spot Bitcoin ETFs have shown significant strains, evidenced by recent activities in both US and Hong Kong markets. In the United States, Bitcoin exchange-traded funds (ETFs) faced substantial outflows, indicating a cooling investor sentiment.

According to recent data, the total outflows from US spot Bitcoin ETFs amounted to $161.6 million. Notably, the Grayscale Bitcoin Trust (GBTC) experienced outflows of $93.2 million, while Fidelity and Bitwise registered outflows of $35.3 million and $34.3 million, respectively. BlackRock had zero net flows once again. These numbers suggest a retreat in institutional interest, which has traditionally been a bulwark against price volatility.

Parallel to the US, the debut of Bitcoin ETFs in Hong Kong also faltered significantly below expectations. Six newly launched ETFs, intended to capture both Bitcoin and Ethereum markets, collectively reached just $11 million in trading volume, starkly underperforming against the anticipated $100 million. The spot Bitcoin ETFs accounted for $8.5 million in trading volume. This was markedly lower than the launch day volumes of US-based spot Bitcoin ETFs, which had reached $655 million on their first day.

#5 Long Liquidations

The market has also been impacted by substantial long liquidations, with a total of $451.28 million liquidated in the last 24 hours alone. The largest single liquidation was an ETH-USDT-SWAP on OKX valued at $6.07 million, but Bitcoin-specific liquidations were significant as well, totaling $143.04 million, according to data from CoinGlass. These liquidations have amplified the selling pressure on Bitcoin.

At press time, BTC traded at $57,715.

Bitcoin price

If History Repeats, This Is How Bitcoin Price Will Perform In The Next 6 Months

In a recent thread on X (formerly Twitter), renowned on-chain analyst Checkmate provided an analysis regarding the future trajectory of Bitcoin. Currently, the premier cryptocurrency hovers around the $60,000 mark, a pivotal moment that echoes historical patterns within the Bitcoin market cycle.

What Will The Next 6 Months Bring For Bitcoin?

Checkmate argues that Bitcoin is positioned in a “chopsolidation” phase—a term coined to describe a stagnant yet volatile period. He suggests that this could last approximately six months, based on previous cycles, and potentially usher in a period of parabolic growth that could last between six to twelve months. “Bitcoin history tends to rhyme, and thus far, this cycle is no different,” Checkmate noted. “The song sung during the last two cycles paints around 6-months of chopsolidation ahead of us, followed by 6-12 months of parabolic advance.”

Bitcoin Index Performance Since Cycle Low

Supporting his analysis, Checkmate refers to April 2021 as a significant high point for Bitcoin for “many good reasons,” noting that despite a considerable monthly drop of over $8,250 in April, such movements are typical and often signify healthy market corrections. “It’s an -11.2% monthly pullback, and is extremely common during uptrends, and corrections are healthy and necessary,” he stated, reinforcing his confidence in Bitcoin’s resilience and potential for recovery.

Bitcoin Monthly Price Performance

Further statistical backing comes from historical data focused exclusively on Bitcoin halving years (2012, 2016, 2020, and 2024), which Checkmate used to illustrate that such month-over-month corrections are not outliers but rather common occurrences within the digital asset’s cyclical trends. The end of each year post-halving has historically shown strong performance, supporting the notion that the current price point could be a precursor to significant gains.

Bitcoin Index Performance Since Cycle ATH
Sell In May And Go Away?

Checkmate also retweeted a post from Charles Edwards. The founder of Capriole Investments commented on the market’s unprecedented bullishness, implying that a deeper correction is to be expected.

“This is starting to get ridiculous. Bitcoin has not had a run like this since inception. We are now 1 day short of the record set in 2011 for days without a meaningful dip [more than 25%]. If you are not prepared to accept some downside in this asset class, you shouldn’t be here. Especially now,” said Edwards. His remark highlights the unusual lack of severe downturns in the market, suggesting that investors should be prepared for potential volatility.

In another post on X, Edwards added a cautious note to the otherwise optimistic outlook. He advised, “Sell in May and go away. This looks like distribution to me. As long as we trade below $61.5K, scenario (1) is technically more likely. A strong reclaim of $61.5K would give some hopes to the bulls for scenario (2). A flush would also be good for the sustaining continuation of the bull market, the sooner we get one, the better the long opportunities are.”

Bitcoin price analysis

This perspective suggests a strategic withdrawal may be wise in the short term, implying that current market conditions might be more bearish than they appear and that a significant correction could potentially strengthen the market’s long-term prospects.

At press time, the BTC plunged to $57,691.

Bitcoin price

Bitcoin Price Nosedives, Can Bulls Save The Key Support at $60K?

Bitcoin price took a hit and even spiked below $60,000. BTC could gain bearish momentum if there is a daily close below the $60,000 support zone.

  • Bitcoin started another decline and traded below the $61,200 zone.
  • The price is trading below $62,000 and the 100 hourly Simple moving average.
  • There is a connecting bearish trend line forming with resistance at $60,400 on the hourly chart of the BTC/USD pair (data feed from Kraken).
  • The pair could accelerate lower if it fails to recover above $60,400 and then $62,000 this week.

Bitcoin Price Reaches Support

Bitcoin price started another decline below the $62,500 support level. BTC dropped below the $61,200 level as the bears took control. They even managed to push the price below $60,000.

A low was formed at $59,110 and the price is now consolidating losses. There was a minor increase above the $60,000 level and the 23.6% Fib retracement level of the recent decline from the $64,738 swing high to the $59,110 low.

Bitcoin is now trading below $61,500 and the 100 hourly Simple moving average. Immediate resistance is near the $60,400 level. There is also a connecting bearish trend line forming with resistance at $60,400 on the hourly chart of the BTC/USD pair.

The first major resistance could be $61,200. The next key resistance could be $62,000 or the 50% Fib retracement level of the recent decline from the $64,738 swing high to the $59,110 low.

Bitcoin Price

Source: BTCUSD on TradingView.com

A clear move above the $62,000 resistance might send the price higher. The next resistance now sits at $62,500. If there is a clear move above the $62,500 resistance zone, the price could continue to move up. In the stated case, the price could rise toward $64,000.

More Downsides In BTC?

If Bitcoin fails to rise above the $60,400 resistance zone, it could continue to move down. Immediate support on the downside is near the $59,500 level.

The first major support is $59,100. If there is a close below $59,100, the price could start to drop toward $58,000. Any more losses might send the price toward the $56,400 support zone in the near term.

Technical indicators:

Hourly MACD – The MACD is now gaining pace in the bearish zone.

Hourly RSI (Relative Strength Index) – The RSI for BTC/USD is now below the 50 level.

Major Support Levels – $59,500, followed by $59,100.

Major Resistance Levels – $60,400, $61,200, and $62,000.

Ethereum Price Prediction: Crypto Expert Says ETH Is Yet To Bottom Against Bitcoin

A crypto analyst has predicted when Ethereum, the world’s second-largest cryptocurrency, will bottom against Bitcoin, however, under certain conditions. 

Analyst Predicts ETH/BTC Bottom Timeline

In a recent X (formerly Twitter) post, crypto analyst and founder of ITC Crypto, Benjamin Cowen, shared his forecast regarding the Ethereum to Bitcoin price ratio, projecting the timeline for when ETH/BTC would hit its lowest value in the current market cycle. 

Sharing insights on the market conditions, Cowen noted striking similarities between the present market’s dynamics and the one seen in 2019. He disclosed that ETH/BTC’s recent bounce mirrored the market’s behavior in 2019, two months before the Federal Reserve (FED) cut down rates. 

Cowen predicts that the ETH/BTC ratio will reach the lowest point in its price cycle when the FED makes a significant change in its monetary policy, often referred to as a “pivot.” The crypto expert expects this pivot to occur in a few months, ultimately suggesting that Ethereum would bottom against Bitcoin in the coming months. 

His analysis is also based on the assumption that macroeconomic conditions and the FED’s monetary policies can significantly impact the cryptocurrency market. Sharing a price chart of Ethereum against Bitcoin in another post, Cowen projected that the ETH/BTC ratio will head towards a range of 0.03 and 0.04 by summer. 

Commenting on his prediction of ETH/BTC’s bottom, a crypto community member expressed skepticism about the FED’s likelihood of cutting down rates while inflation was still high. Cowen responded that the absence of a rate cut further reinforced his beliefs that the ETH/BTC ratio has not yet reached its lowest point. He suggests that unless inflationary pressures are addressed, the ETH/BTC ratio may continue on its downward trend. 

Crypto Expert Calls Ethereum A Higher Risk Asset

In another post, Cowen referred to Ethereum as a higher-risk asset and Bitcoin as a lower-risk asset. The crypto analyst’s forecast on Ethereum against Bitcoin is underpinned by his interpretation of capital migration dynamics, suggesting that higher-risk assets typically depreciate relative to lower-risk assets.

He highlighted the uncertainty surrounding the future market movements of ETH/BTC following the halving event. Cowen predicted that if ETH/BTC witnesses a “relief rebound” after the halving, then he expects a rejection by the bull market support band, particularly in the context of weekly closing prices, estimated to range between $0.053 to $0.054. 

While acknowledging his past successes in predicting ETH/BTC price movements, Cowen highlighted that his predictions remain speculative, stating, “Just because I have been right so far about ETH/BTC does not mean I will continue being right.”

Ethereum price chart from Tradingview.com

USDT Dominance Falling, Analyst Predicts Bitcoin To Reach $80,000

Though Bitcoin prices are fast-dropping, looking at events in the daily chart, one analyst thinks the coin is gearing up for a comeback, citing developments in the USDT dominance chart, or USDT.D. 

USDT Dominance Falling, Good For BTC?

Taking to X on April 29, the analyst said USDT.D recently fell, breaking below a critical support trend line. Thus far, USDT.D faces strong rejections at immediate resistance levels, signaling weakness.

All this, while considering the inverse relation the USDT.D chart has with Bitcoin, the analyst now expects the world’s most valuable coin to tear higher, reversing recent losses and rejuvenating the broader crypto scene.

USDT dominance chart | Source: TradingView

To understand what’s going on, one has to understand what the USDT.D chart represents. In essence, it compares the market capitalization of USDT, the world’s largest stablecoin, versus the total market capitalization of other stablecoins, including USDC, DAI, FUSD, and every other USD-pegged asset.

This chart reflects the dominance of USDT in the stablecoin scene. However, analysts have also been using this chart to gauge sentiment and correlation with Bitcoin. 

As expected, USDT.D and Bitcoin, analysts note, enjoy an inverse correlation. Since stablecoins like USDT act as a safe haven when prices are plunging, USDT.D will rise when BTC prices are plunging and fall whenever Bitcoin is tearing. 

Following the drop below the support trend line and dipping USDT dominance, the analyst predicts Bitcoin prices will stabilize and even expand in the sessions ahead. So far, BTC is under pressure, shrinking by over 15% from all-time highs.

Meanwhile, the USDT.D chart has found resistance. If it rejects, it could signal the resumption of Bitcoin’s early Q1 2024 uptrend.  

Bitcoin Bears Pressing On: Next Stop $60,000?

Currently, Bitcoin is trending lower but above $60,000. Despite the slowdown, the possibility of BTC finding traction and expanding, even reclaiming $73,800, cannot be discounted.

The analyst expects a “massive leg up” for Bitcoin should USDT.D continue falling, aligning with the support trend line break. According to the analyst’s projection, BTC can rally above the all-time high towards $80,000 or even higher.

Bitcoin price trending downward on the daily chart | Source: BTCUSDT on Binance, TradingView

Even so, though the analyst is optimistic, BTC prices will not be guaranteed to fly because of shrinking USDT dominance.

Shifting market dynamics, including institutional adoption via spot Bitcoin exchange-traded funds (ETFs) and even regulatory developments, such as the United States Securities and Exchange Commission (SEC) initiating charges against stablecoins as it did for BUSD, can impact Bitcoin prices or USDT dominance.

Crypto Analyst Reveals Why $59,800 Is An Important Level For Bitcoin

Crypto analyst Ali Martinez has provided insights into why $59,800 is a crucial price level for the Bitcoin future trajectory. The analyst revealed two things that could happen if the flagship crypto drops that low. 

Why $59,800 Is An Important Level For Bitcoin

Martinez mentioned in an X (formerly Twitter) post that the Bitcoin short-term holder’s (STH) realized price is at $59,800. He added that BTC historically often bounces off this level during an uptrend, which would mean that the flagship crypto could experience a massive pump if it were to drop to that price level.

Bitcoin $59,800

However, Martinez also warned of what could happen if Bitcoin fails to experience this bounce, noting that a fall below this level could “trigger notable Bitcoin price corrections.” Although the crypto analyst didn’t mention how low Bitcoin could drop, his choice of words suggests that a price breakdown for the crypto token could be severe. 

STH is an important metric that measures the average price at which Bitcoin short-term investors bought the crypto token. A drop to that level suggests that these short-term investors have realized their profits, which leaves room for Bitcoin to make another run following this wave of sell-offs. 

On the other hand, as Martinez warned, Bitcoin could drop further if it fails to establish support at that level. This brings crypto analyst DonAlt’s recent prediction into context. He hinted that BTC could fall between $52,000 and $47,000 if it eventually breaks the $60,000 support level. 

Meanwhile, Martinez also drew the crypto community’s attention to the $61,900 mark, which he remarked has “consistently been a crucial support level for Bitcoin.” He further claimed that BTC could rise to as high as $71,000 if it continues to hold above that level. 

Is The BTC Top In?

In a more recent X post, Martinez gave his opinion on whether or not Bitcoin has reached its market top. He tried to analyze it from both sides of the divide. First, he noted that a spike in BTC’s realized profits has “historically coincided with market tops.” He then revealed that Bitcoin’s realized profits skyrocketed to $3.52 billion when it hit $73,880 last month. 

This would suggest that the market top was indeed in. However, Martinez added that he was waiting for another confirmation before confidently claiming that the market top is in. He claims that this confirmation will come if BTC achieves a sustained close below the short-term realized price, currently around $59,800. 

Meanwhile, he further stated that this market top theory could be invalidated if Bitcoin surges above $66,250 and claims this area as support. Bitcoin rising above that price level will help it gain the strength it needs to move towards $69,150. If BTC eventually breaches that resistance level, Martinez claimed it could advance to a new all-time high (ATH) of $92,190. 

At the time of writing, Bitcoin is trading at around $62,300, down in the last 24 hours, according to data from CoinMarketCap.

Bitcoinprice chart from Tradingview.com

Bitcoin To $92,190: Crypto Analyst Reveals Path To ATH Target

An analyst has explained what path Bitcoin might need to follow to surge to a new all-time high (ATH) target of $92,190.

Bitcoin Needs To Breach This Resistance Barrier To Rise To New ATH

In a new thread on X, analyst Ali discussed whether the BTC price has hit the top. The one signal the analyst has pointed out that may point towards the top has been the massive scale of profit-taking that the market has seen recently.

Ali is waiting for another confirmation before the top can be confirmed. In the scenario that the top gets validated, these are the targets the analyst has marked based on on-chain data.

Bitcoin URPD

The above chart shows the Bitcoin UTXO Realized Price Distribution (URPD) data from Glassnode, which tells us how many coins were last bought at what price levels.

Generally, the cost basis is an important level for any investor, so they are likely to show some reaction when a retest of it happens. This reaction is the largest when many investors share their cost basis around the same level.

When this retest happens from above, the holders may respond by buying more, as they could see the drop as a dip opportunity. As such, large cost basis zones below the current price can prove to be centers of support.

“If the market top is confirmed, BTC could drop toward $51,530 or even $42,700!” notes Ali, given that these two levels are the next major support lines for the coin.

The analyst says, however, that if BTC can instead break the $66,250 level, which is a source of major resistance right now since these loss holders may be desperate to exit at their break-even, then this bearish outlook could become invalidated.

An on-chain pricing model could provide some hints about what might happen when such a break occurs.

Bitcoin MVRV Pricing Bands

The Market Value to Realized Value (MVRV) Pricing Bands is a model that, in short, tells us about where the different multipliers of the average cost basis of the entire market currently lie.

The chart shows that the market cost basis is currently at $28,800. Historically, three multipliers of this metric have been relevant for the asset: 0.8x, 2.4x, and 3.2x.

The 0.8x level is where bottoms occur, while the 3.2x line is a probable spot for tops to form. Bull rallies in proper have occurred after a breach of the 2.4x level.

At present, the 2.4x level lies at $69,150. “By rising above $66,250, Bitcoin will gain the strength to push towards $69,150. And if this resistance barrier is breached, BTC can advance toward a new all-time high of $92,190,” explains Ali.

This ATH target is based on the fact that the 3.2x level is equivalent to $92,190 at the moment. It remains to be seen whether the top is already in and BTC would retest the lower levels or if more is left to this rally.

BTC Price

At the time of writing, Bitcoin is trading at around $61,100, down more than 7% over the past week.

Bitcoin Price Chart