The Bitcoin miner’s top line came below expectations due to “unexpected equipment failures” and worse-than-predicted weather at multiple mining sites.
Cryptocurrency Financial News
The Bitcoin miner’s top line came below expectations due to “unexpected equipment failures” and worse-than-predicted weather at multiple mining sites.
Grayscale Investments, the issuer of one of the recently approved spot Bitcoin exchange-traded funds (ETFs) in the US, saw flat revenues in the first quarter of the year due to its decision to maintain fees on its flagship Grayscale Bitcoin Trust ETF (GBTC).
According to a shareholder letter from its parent company, Digital Currency Group (DCG), the operator of the Grayscale Bitcoin Trust recorded $156 million in revenue, showing little change from the previous quarter.
Since the GBTC trust’s conversion to an ETF in January, Grayscale has seen outflows of about $17.4 billion as investors appear to have shifted their assets to new, lower-cost funds offered by BlackRock and Fidelity, the leaders in the US ETF race in terms of inflows recorded since January.
While GBTC charges a 1.5% management fee, many of its competitors charge less than 0.3%, leading to outflows. In response, Grayscale announced plans in March to seek approval from the Securities and Exchange Commission (SEC) to spin off some of Grayscale’s assets into a new, lower-fee “Bitcoin Mini Trust.”
Despite the outflows, the Q1 revenue attributable to GBTC exceeded Grayscale’s expectations. The firm had previously anticipated outflows due to increased competition under the ETF wrapper. Grayscale previously charged a 2% sponsorship fee before the trust was converted.
The flat revenue was also attributed to higher average Bitcoin and Ethereum prices and a decrease in assets under management (AUM).
In contrast to Grayscale’s performance, all US spot Bitcoin ETFs have witnessed a total net inflow of over $11 billion thus far. However, demand for these ETFs has recently declined amidst tightening financial conditions in the US, where the Federal Reserve (Fed) faces the challenge of addressing persistent inflation.
Digital Currency Group, founded by Barry Silbert and the parent company of Grayscale, reported an 11% quarter-over-quarter increase in Q1 revenue to $229 million, primarily due to higher asset prices.
However, revenue growth lagged behind Bitcoin’s price appreciation, which rose more than 60% during the same period. In its letter, DCG attributed this disparity to lower GBTC sponsor fees, redemptions, and steady mining revenues at its Foundry subsidiary.
Foundry, DCG’s mining subsidiary, experienced a sequential revenue increase of 35%, propelled by staking and equipment sales revenue. Meanwhile, Luno, the company’s crypto exchange subsidiary, witnessed a 46% quarter-over-quarter sales boost, driven by a significant surge in trading volume.
At press time, Bitcoin is trading at $62,100 and has recently encountered significant price volatility. These price swings have failed to establish a stable position above crucial price thresholds.
Featured image from Shutterstock, chart from TradingView.com
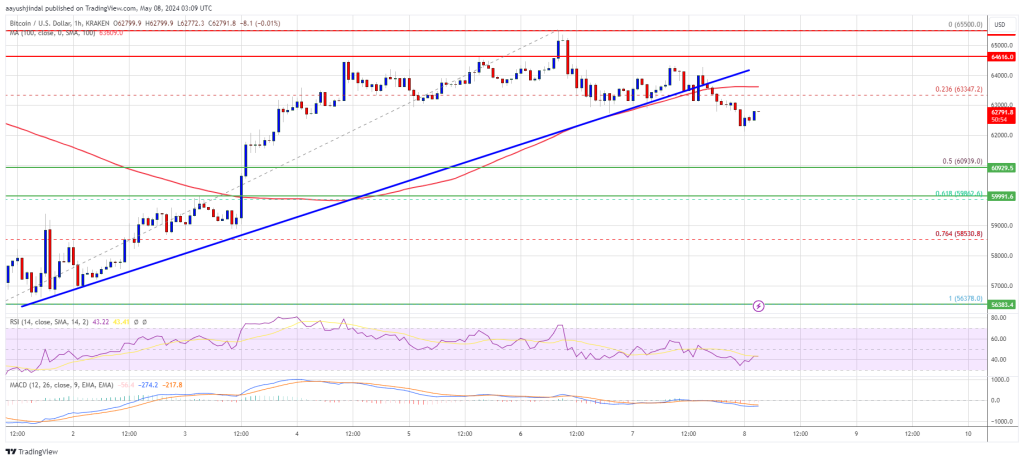
The Bitcoin price has experienced heightened volatility over the past week. After recovering from a low of $56,500, the largest cryptocurrency in the market surged to $65,500 within four days. However, it has since retraced some of its gains and is currently testing the $61,000 support level.
Despite this volatility and the absence of strong bullish momentum, venture capital firm Pantera Capital remains optimistic about the future of BTC’s price, citing the recent Halving event as a significant factor.
In a recent investor letter, Pantera Capital revealed its Bitcoin Halving rallies model, which predicts a bottoming out of the BTC price followed by a rise through the Halving rally.
Based on the average duration of previous rallies, the firm forecasts that BTC’s price will peak at $117,000 in August 2025. The average total duration of this cycle, encompassing pre- and post-Halving rallies, has historically been around 2.6 years, with symmetry observed across cycles.
Pantera Capital highlights the relationship between Halving events and BTC’s price. The firm asserts that if the demand for new Bitcoin remains constant while the supply of new Bitcoin is reduced by half, it will create upward pressure on the price.
The anticipation of a price increase has also historically driven increased demand for Bitcoin leading up to Halving events. However, Pantera Capital acknowledges that the impact of each subsequent Halving on price may diminish as the reduction in the supply of new Bitcoin from previous Halvings becomes less significant.
Moreover, the firm notes that, on average, the Pantera Bitcoin Fund has nearly doubled in value for eleven years. Based on this historical performance, Pantera Capital envisions a scenario in which the price of Bitcoin reaches $117,000 by 2025.
Renowned crypto analyst Titan of Crypto has recently taken to social media platform X (formerly Twitter) to share bullish predictions for the Bitcoin price. With forecasts ranging from $75,000 to $110,000, Titan of Crypto highlights various factors and patterns that could potentially drive BTC’s growth.
According to Titan of Crypto, a price rise to $110,000 for Bitcoin is “programmed.” While the analyst did not elaborate on the specifics of this programming, it suggests a strong conviction in BTC’s potential to reach that level.
Titan of Crypto also identifies a current head-and-shoulders pattern in the Bitcoin price chart. If this pattern holds, the analyst suggests that BTC could rise to the $75,000 mark. If confirmed, this pattern could signify a bullish trend reversal and further support the projection of Bitcoin reaching higher price levels.
The analyst also highlighted $61,500 as a critical point to monitor due to the possibility of “panic selling.” The analyst suggests many market participants might react to this level, potentially increasing selling pressure.
Lastly, based on his analysis, the analyst suggests a conservative price prediction of $108,000. However, Titan of Crypto believes that BTC’s price may exceed this projection, indicating a more optimistic outlook.
Featured image from Shutterstock, chart from TradingView.com
The Bitcoin mining difficulty has experienced a significant decrease, the largest drop observed in the last 18 months. This change is directly tied to fluctuations in the network’s hash rate, which has dipped below 600 EH/s following the recent halving event.
The adjustment, which marks a 5.7% fall in mining difficulty, brings the level down to 83.1 trillion, according to data from Bitbo.
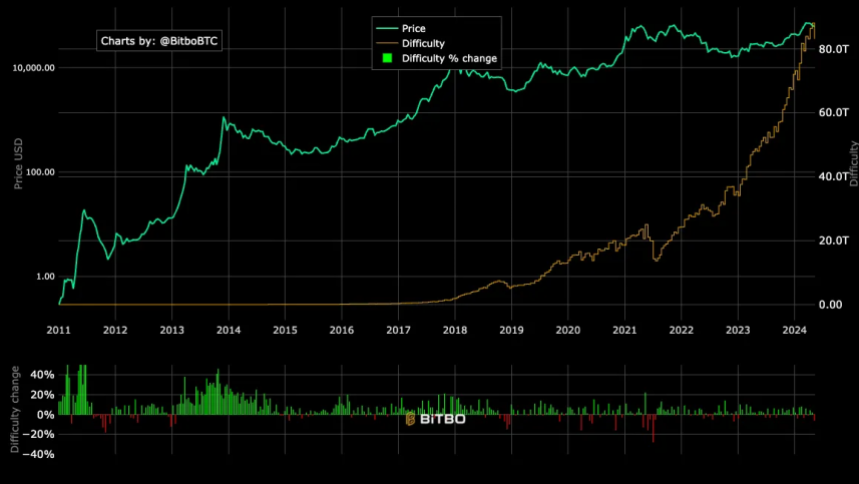
This most substantial adjustment since December 2022 reflects broader shifts within the Bitcoin mining landscape. At that time, Bitcoin’s price hovered around $17,000, contrasting sharply with current levels.
Notably, the mining difficulty, a metric that determines how challenging it is to find a new block, adjusts approximately every two weeks, or every 2016 blocks. This system ensures that block discovery remains consistent at around every 10 minutes, irrespective of the number of miners.
The recent decline in mining difficulty came after a 10% drop in the network’s hash rate from a seven-day moving average of 639.58 EH/s to 581.74 EH/s.
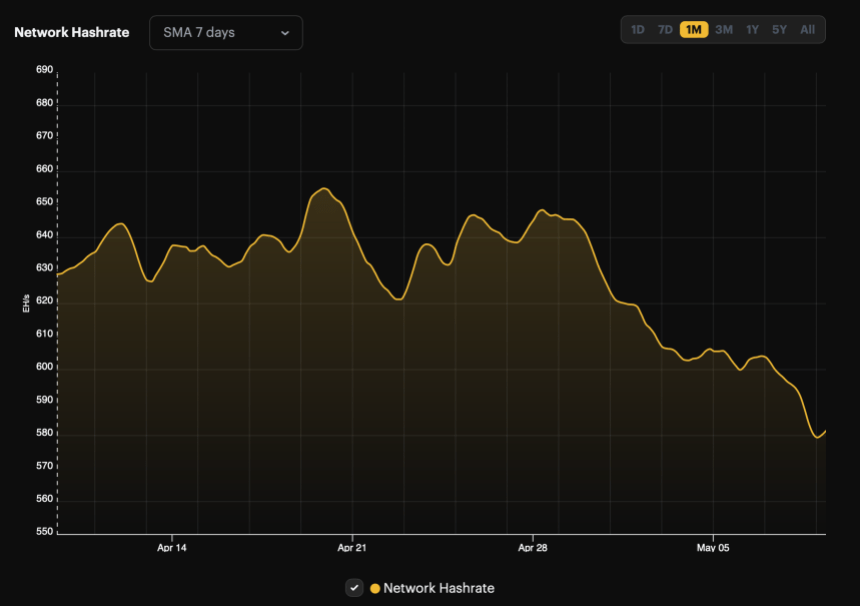
This decrease in hash rate led to longer average block times of about 10 minutes and 36 seconds, up from the standard 10 minutes, before the difficulty adjusted downward at block height 842,688.
The reduced hash rate also contributed to a new low in the hash price, which fell to roughly $0.049 per TH/s per day.
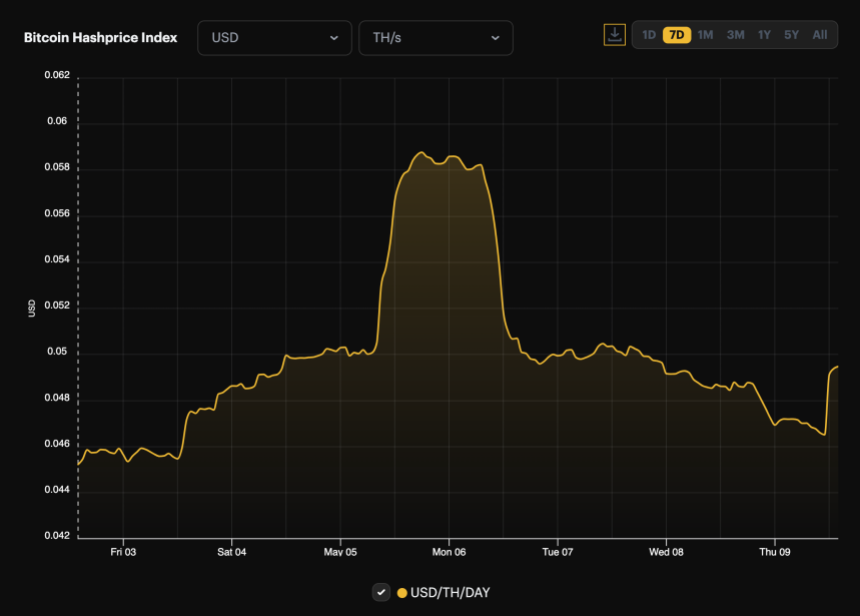
This decline impacts miners’ profitability, as the hash price, a term introduced by Bitcoin mining firm Luxor, represents the earnings a miner can expect per unit of hashing power per day.
However, today’s negative difficulty adjustment may provide some relief for miners, making it easier to mine blocks than in the previous two weeks.
The adjustments in mining difficulty and hash rate come when Bitcoin’s price also shows signs of volatility. After reaching a peak above $73,000 in March, the price has fallen by 16% and is now trading around $61,376.
This decline mirrors the broader trend in the mining difficulty, suggesting a possible correlation between these metrics.
Furthermore, the market has observed subdued activity in the spot Bitcoin exchange-traded funds (ETFs). Data from Soso Value indicates minimal net inflows or outflows, with Bitwise Bitcoin ETF being the only issuer that experienced inflows yesterday.
On May 8, the total net inflow of Bitcoin spot ETF was $11.5409 million. Grayscale ETF GBTC has no inflows and outflows. Bitwise ETF BITB saw a single-day net inflow of $11.5409 million. The total net asset value of Bitcoin spot ETFs is $51.504 billion. https://t.co/OkjFkXsACa
— Wu Blockchain (@WuBlockchain) May 9, 2024
This trend could signify a cooling interest in Bitcoin investments or a shift in investor strategy following the recent price and mining adjustments.
Feature image from Unsplash, Chart from TradingView
Ki Young Ju, CEO of cryptocurrency analysis firm CryptoQuant, has given an ultra-bullish prediction for Bitcoin. The crypto founder alluded to certain factors that could spark the flagship crypto’s rise to such heights.
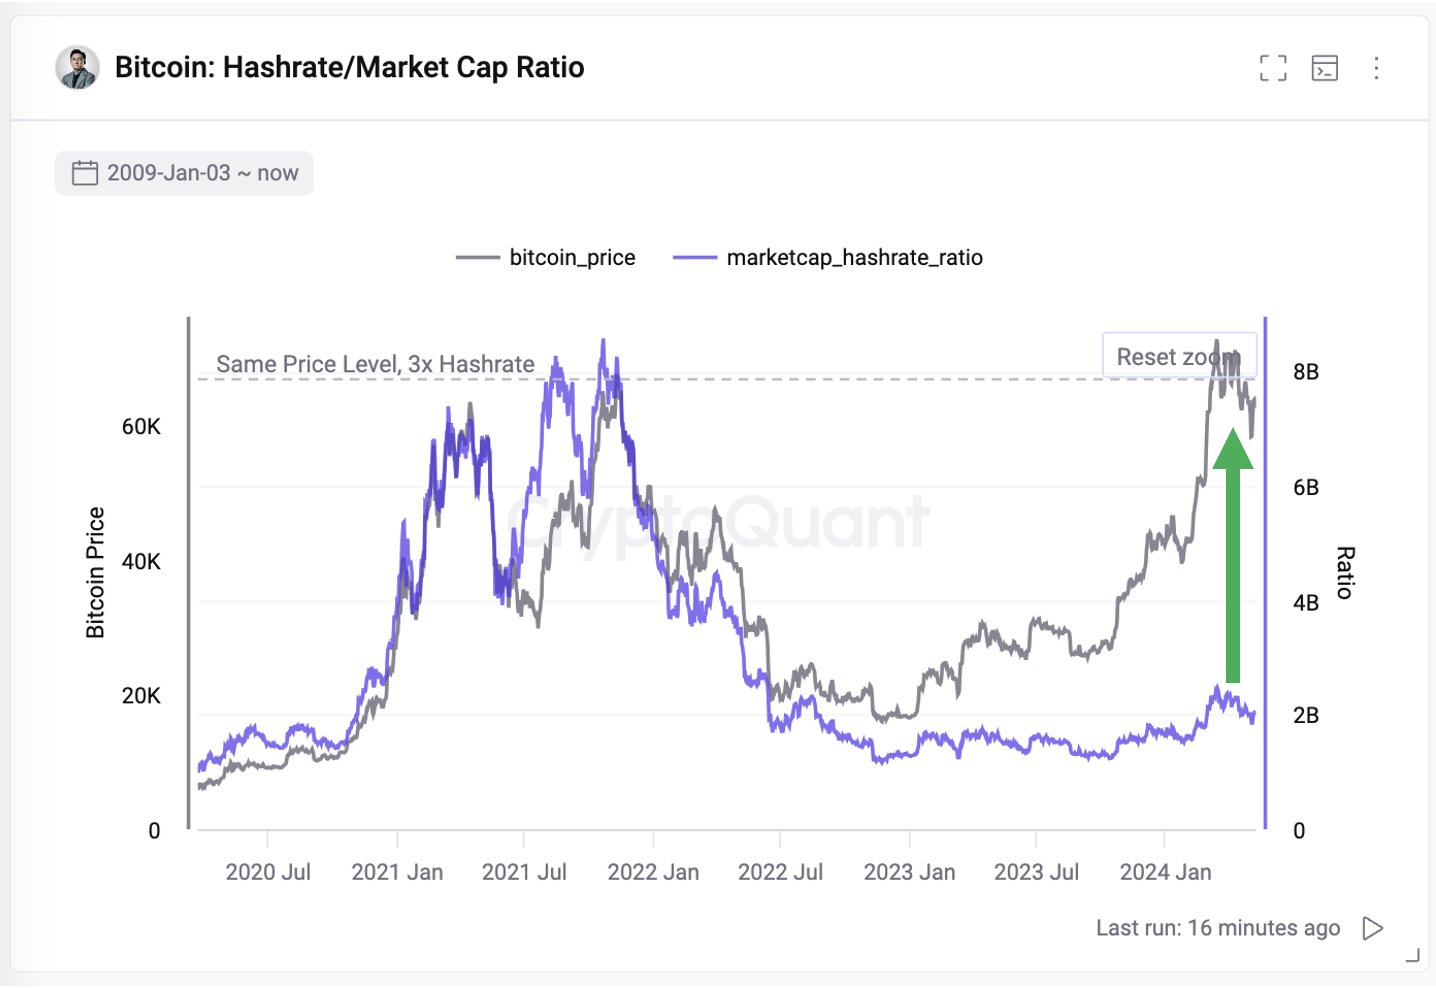
Young Ju mentioned in an X (formerly Twitter) post that “Bitcoin’s network fundamentals could support a market cap three times its current size compared to the last cyclical top.” He added that this development could help BTC rise to $265,000. The fundamental that the crypto founder was alluding to was the Hashrate/Market Cap ratio.
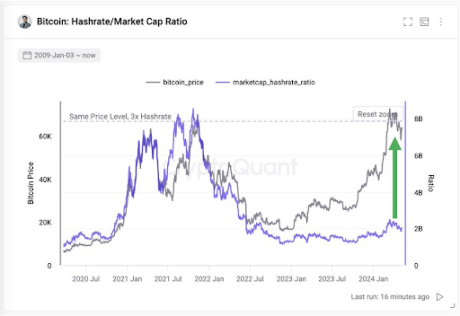
The accompanying chart that Young Ju shared showed that Bitcoin’s hash rate is currently more than three times what it was at the last market cycle top. Meanwhile, BTC is still at the price level it was during that period. As such, the CryptoQuant CEO believes that Bitcoin could also see a 3x increase in its price, just like the Hash rate.
Young Ju’s prediction provides a much-needed bullish outlook for Bitcoin, especially given the flagship crypto’s recent decline and talk that Bitcoin may have already attained the market top for this cycle. Tom Lee, co-founder of research firm Fundstrat, also recently shared his bullish sentiment towards BTC, stating that the crypto token will still reach $150,000 this year.
Meanwhile, similarly to Young Ju’s prediction, crypto analyst MacronautBTC had previously stated that Bitcoin could rise to $237,000. The crypto analyst made this “conservative” calculation based on BTC’s demand outpacing its supply in the long run, especially with the halving further reducing Miners’ supply.
Young Ju’s prediction of $265,000 for Bitcoin is far from ambitious when considering that Samson Mow, the CEO of JAN3, predicted that Bitcoin could rise to as high as $1 million this year. He explained that this unprecedented rise was possible due to the impressive demand that Bitcoin was currently enjoying.
Pseudonymous crypto analyst PlanB also echoed a similar sentiment, stating that BTC hitting $1 million is possible, although he suggested that could happen in 2025 rather than this year. He made this prediction based on the Bitcoin stock-to-flow (STF) indicator, which hints at $500,000 being the average price level for Bitcoin in this market cycle.
As such, the analyst believes that $1 million could be the market top for this bull run. Meanwhile, PlanB mentioned that Bitcoin hitting $100,000 this year was “inevitable.”
At the time of writing, Bitcoin is trading at around $61,700, down over 1% in the last 24 hours, according to data from CoinMarketCap.

Bitcoin price data makes a strong argument for why the current price range is a buy-the-dip opportunity.
As the clock ticks closer to the end of today, May 3, the cryptocurrency market braces itself for potential upheavals, with roughly $2.4 billion worth of Bitcoin and Ethereum options set to expire.
This significant event could catalyze notable shifts in market dynamics, steering the trajectory of Bitcoin and Ethereum prices in the near term.
Notably, Options contracts in the crypto sphere allow traders to hedge against price volatility or speculate on future price movements without directly holding the assets. Typically structured as either calls or puts, these contracts enable buying (call) or selling (put) at predetermined prices within a specified timeframe.
As the expiry date approaches, movements within these contracts tend to introduce heightened volatility into the market, given the adjustments traders make to hedge their positions or capitalize on anticipated price movements.
The mechanics of options trading offer insights into market sentiment, primarily through analyzing the put/call ratio. This ratio gauges the market’s bullish or bearish stance, depending on whether the volume of call options (betting on price rises) outweighs put options (betting on price drops) or vice versa.
Presently, the put-to-call ratio for Bitcoin stands at a relatively low 0.5, suggesting a bullish sentiment as more traders bet on rising prices with the maximum pain point—a price level causing maximum trader losses—at about $61,000 and a notional value of $1.4 billion.

In contrast, Ethereum’s options market is also teeming with activity, marked by the upcoming expiry of contracts valued at around $1 billion. With a put-to-call ratio of 0.37, the sentiment leans even more bullish than Bitcoin, indicating stronger trader confidence in Ethereum’s price performance.
Ethereum’s designated maximum pain point sits at $3,000, aligning with key psychological and technical support levels.
May 3 Options Data
23,000 BTC options are about to expire with a Put Call Ratio of 0.49, a Maxpain point of $61,000 and a notional value of $1.4 billion.
330,000 ETH options are due to expire with a Put Call Ratio of 0.36, Maxpain point of $3,000 and notional value of $1… pic.twitter.com/mEA4PV98C3— Greeks.live (@GreeksLive) May 3, 2024
Historically, the expiration of such a voluminous cache of options has precipitated abrupt price fluctuations in the spot markets for Bitcoin and Ethereum. This is attributed to the large-scale repositioning by institutional and retail investors in anticipation of or in response to the expiry outcomes.
These strategic movements are particularly pivotal when both cryptocurrencies recover from recent pullbacks. GreeksLive noted:
The current point of sustained sideways trading is unlikely, no rebound is bound to be a downward relay, the giant whale on the lack of confidence in the market, Block trading is worth strengthening attention.
Meanwhile, Bitcoin appears to be recovering from the recent downturn with a 5.4% increase in the past day, momentarily piercing the $60,000 mark, signaling a potential resumption of its upward march.
Similarly, Ethereum has shown resilience, climbing above the $3,000 threshold with a modest 3% gain. These upticks coincide with broader market analyses like that of Marco Johanning, a well-known crypto analyst and founder of The Summit Club, suggesting that foundational bullish sentiments remain intact despite recent corrections.
Featured image from Unsplash, Chart from TradingView
Rekt Capital a popular cryptocurrency expert has set aside the potential timeline that Bitcoin, the largest crypto asset is expected to peak in the ongoing bull cycle, citing historical price trends. Rekt Capital’s analysis examines the current price action of Bitcoin and how it aligns with previous bull cycle peaks following the Bitcoin Halving event.
Today, May 9, BTC’s price witnessed a drop below the $61,000 price level, demonstrating a potential move on the downside. However, Rekt Capital is unshaken by this move as he believes the more Bitcoin consolidates between current price levels and $70,000 following the Halving, this cycle will slow down and resynchronize with its regular historically recurrent Halving cycle. As a result, given the price movements of past trends, he expects BTC to see a bull market top between the middle of September and October next year.
Furthermore, he noted that due to Bitcoin’s current two-month consolidation period, the present rate of cycle acceleration has dropped from 260 days to 210 days.
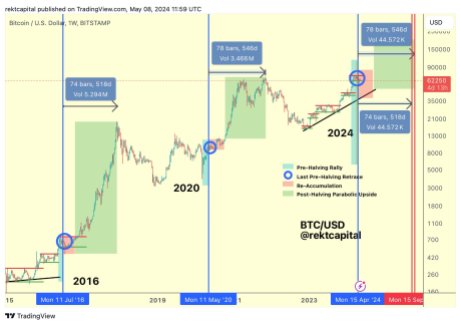
The analyst highlighted that about 518 days after the Halving in the 2015-2017 cycle, BTC reached its market peak. Meanwhile, in the 2019-2021 bull cycle, it took the digital asset approximately 546 days after the Halving to top out.
Thus, in the event that BTC reiterates these trends and the next bull market top takes place between 518 and 546 days post-Halving event, Bitcoin’s peak this cycle might occur during the aforementioned timeframes. This is the reason why the expert is confident that the more time Bitcoin takes to stabilize, the better off it will be for bringing this cycle back in alignment with the customary Halving cycle.
While the analyst anticipates BTC to experience a retrace large enough to persuade investors that the bull market is over, he urges investors not to be shaken out as it will turn around eventually to resume its upward movement. According to Rekt Capital, fortunate investors understand that there are moments to panic and moments to accumulate and that the two often go hand in hand.
Currently, the price of Bitcoin is moving on the downside after a slight recovery on Wednesday. BTC’s price has now fallen close to $60,700 as it was unable to break above $65,500 once more.
Related Reading: Bitcoin Peak Pre-Halving Doesn’t Guarantee Further Gains: Analyst
At the time of writing, the digital asset in the weekly timeframe is demonstrating a positive momentum, while in the daily timeframe, it is trending on the downside. In the past week, BTC has increased by over 4% and has decreased by about 2.29% in the past day, trading at $60,860.
Both the trading volume and market cap are also down by 2.45% and 2.20% respectively in the last 24 hours.
Movement and accumulation from crypto whales are two of the catalysts for Bitcoin price increases. Although major whales are still buying the dip, on-chain data indicates a general waning accumulation momentum which suggests their conviction might actually be waning.
According to IntoTheBlock, an on-chain analytics firm, Bitcoin whale accumulation volumes have declined substantially in each buying cycle over the past month. This decline in whale accumulation could be worrying for investors, especially as the price of Bitcoin is now trying to hold above $60,000.
Whales, or large investors holding over 1,000 BTC, have accumulated strongly since the beginning of the year, especially during market dips. This accumulation has largely helped to keep Bitcoin in bullish sentiment and prevented huge price declines. However, IntoTheBlock recently revealed an interesting pattern between these whale wallets in each accumulation phase.
The largest accumulation occurred between March 5 and March 7, when these wallets acquired over 120,000 BTC. Every succeeding price dip has, however, seen less accumulation than the one before it. Particularly, Bitcoin’s recent dip to $56,000 failed to attract notable whale accumulation. This drop in buying and selling activity indicates whales may have lost some interest or appetite for accumulating more Bitcoin in the short term.
Whales are buying the dip, but is their conviction dwindling?
Addresses holding over 1000 BTC have accumulated strongly in recent months, especially during dips.
Prices have increased shortly following every accumulation.
However, note that each spike in accumulation by… pic.twitter.com/OkbekJr5NC
— IntoTheBlock (@intotheblock) May 6, 2024
The waning conviction among Bitcoin whales has raised the question of whether Bitcoin could reverse back into a full bearish momentum. These concerns are particularly valid, considering some analysts are of the notion that Bitcoin might’ve reached its peak in this cycle.
As IntoTheBlock noted, prices have increased shortly following every accumulation this year. While the lower whale buying activity could stall price increases in the short term, it is not a sure sign that Bitcoin is headed for a major price crash. However, if the trend continues for several more months, it could signal lower demand and a weakening bull market.
According to the “In/Out Of Money Metric”, there is still a strong resistance volume between $59,000 and $61,000. A drop below this range again would push 552,220 addresses into losses. In fact, while a drop to his level would be painful for many holders, most crypto analysts remain optimistic about Bitcoin’s long-term prospects.
At the time of writing, Bitcoin is trading at $61,488. The crypto recently rebounded around $57,500 and is up by 7.4% in the past seven days. According to analyst Marco Johanning, $57,000 is an important support level for Bitcoin. He noted that while a break below $57,000 could lead to further declines into $52,000, the crypto market is still very bullish for Bitcoin.

A convenience store in South Korea is offering Bitcoin meal boxes in collaboration with the local exchange Bithumb where customers can win small amounts of Bitcoin with their purchase.
Bitcoin price extended losses and traded below the $62,500 zone. BTC is showing bearish signs and might turn bearish if it settles below $60,000.
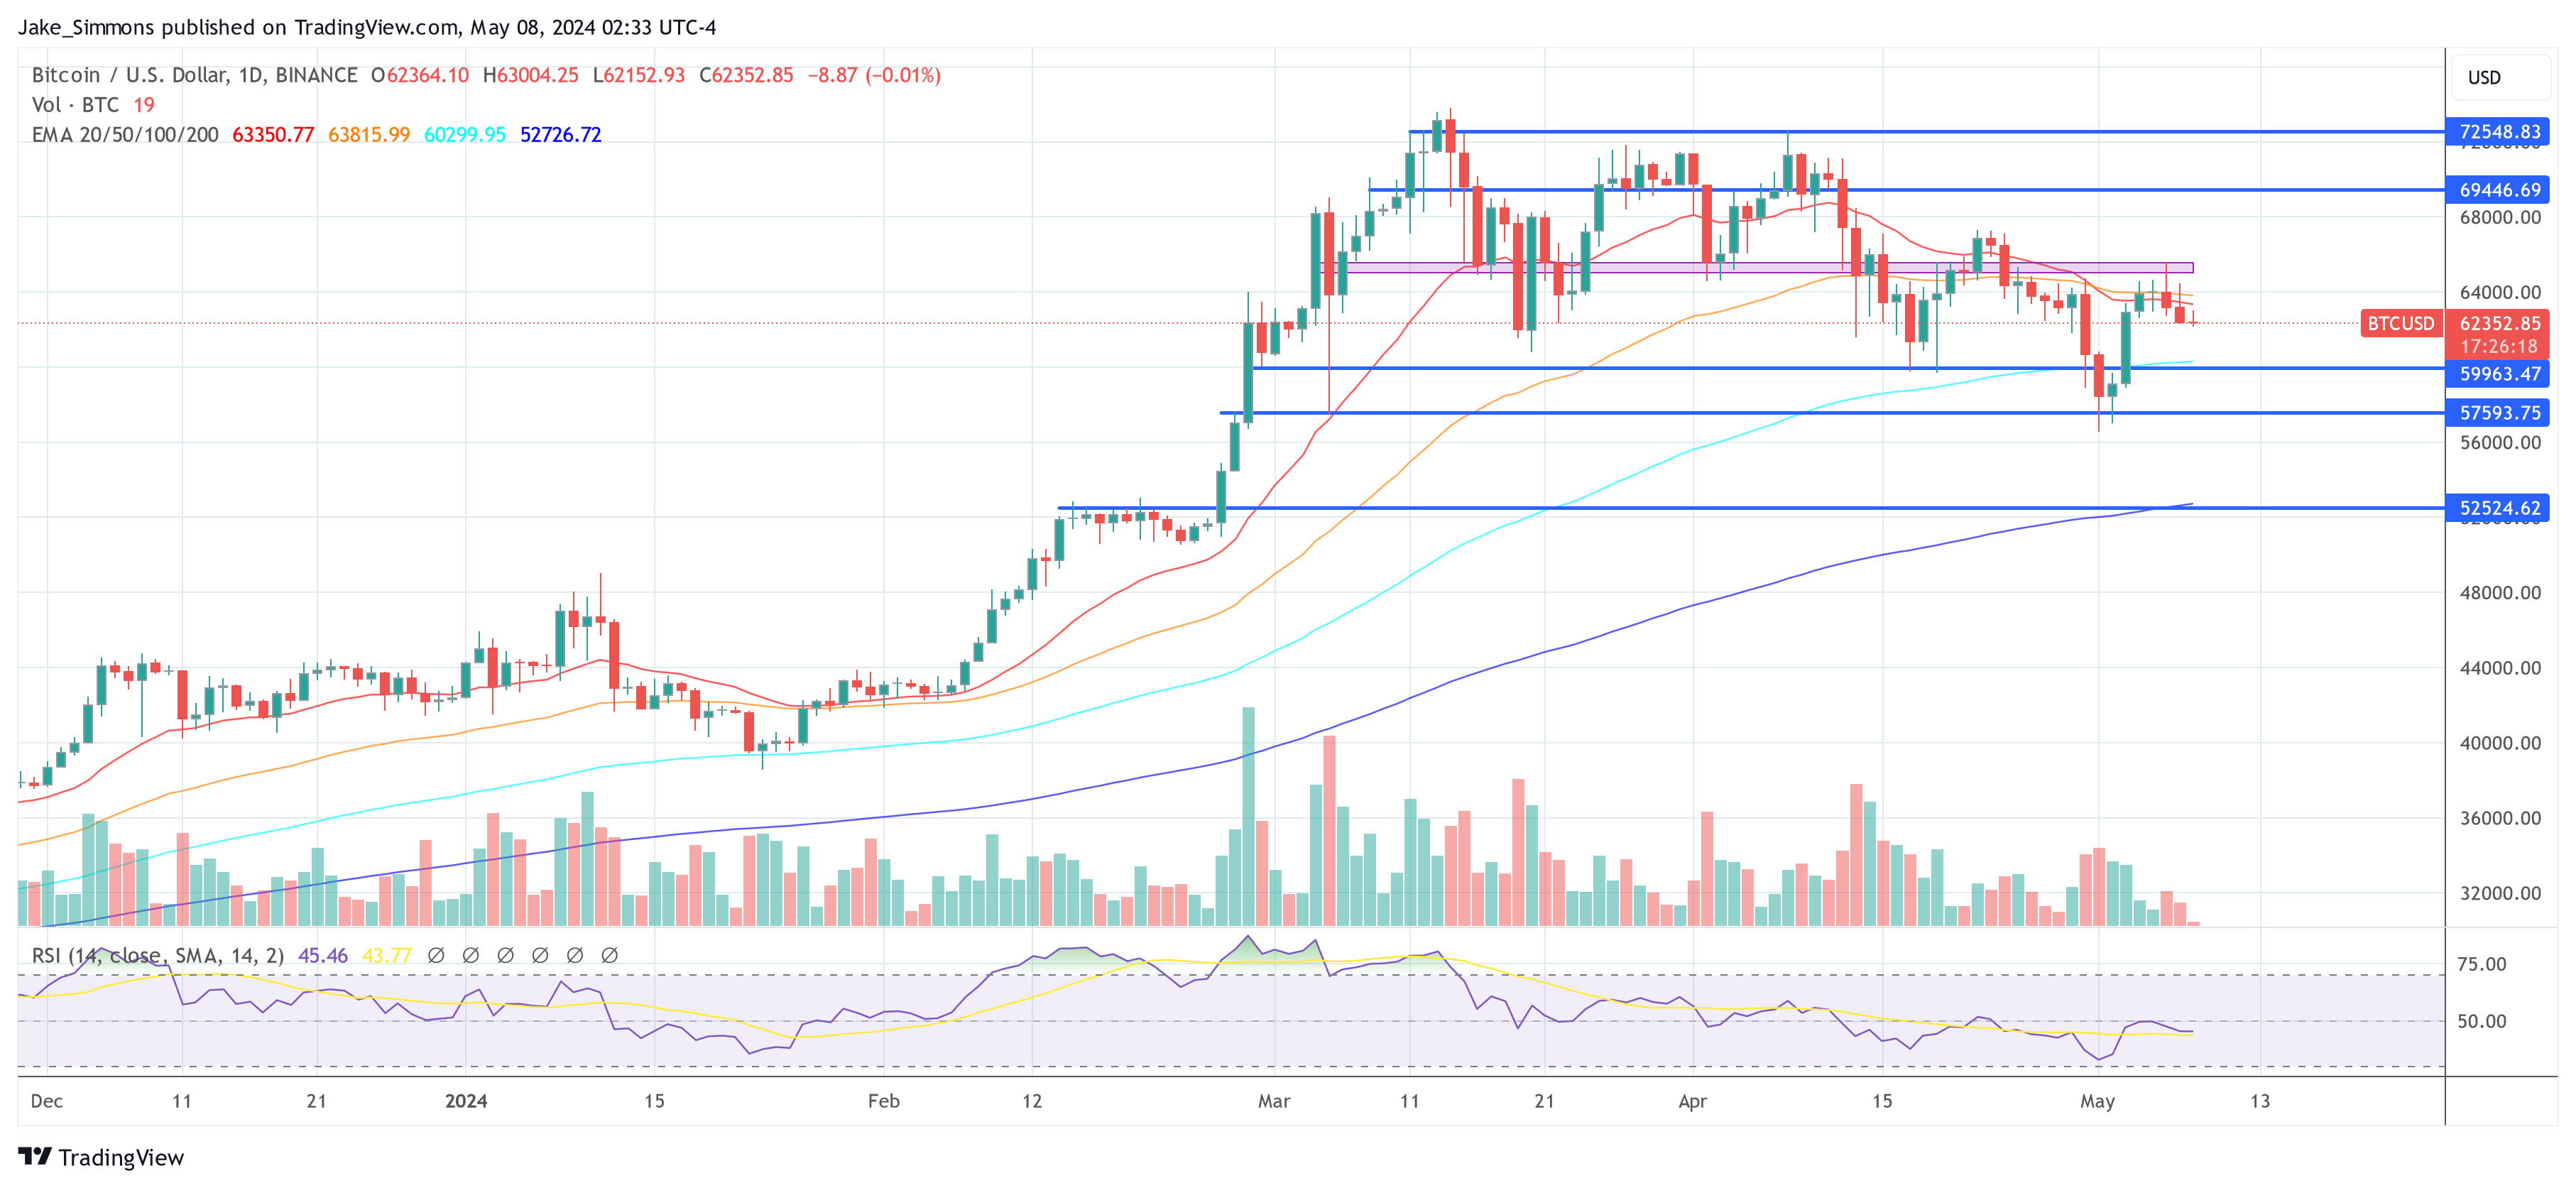
Bitcoin price struggled to stay above the $63,500 zone and extended losses. There was a move below the $63,000 and $62,500 levels. The bears even pushed it below $61,200.
A low was formed at $60,888 and the price is now consolidating losses. If there is a recovery wave, the price might struggle to clear the $62,000 resistance or the 23.6% Fib retracement level of the recent decline from the $65,500 swing high to the $60,888 low.
There is also a connecting bearish trend line forming with resistance at $62,000 on the hourly chart of the BTC/USD pair. Bitcoin is now trading below $63,000 and the 100 hourly Simple moving average.
Immediate resistance is near the $61,800 level. The first major resistance could be $62,000. The next key resistance could be $63,200 and the 100 hourly Simple moving average. It is close to the 50% Fib retracement level of the recent decline from the $65,500 swing high to the $60,888 low.
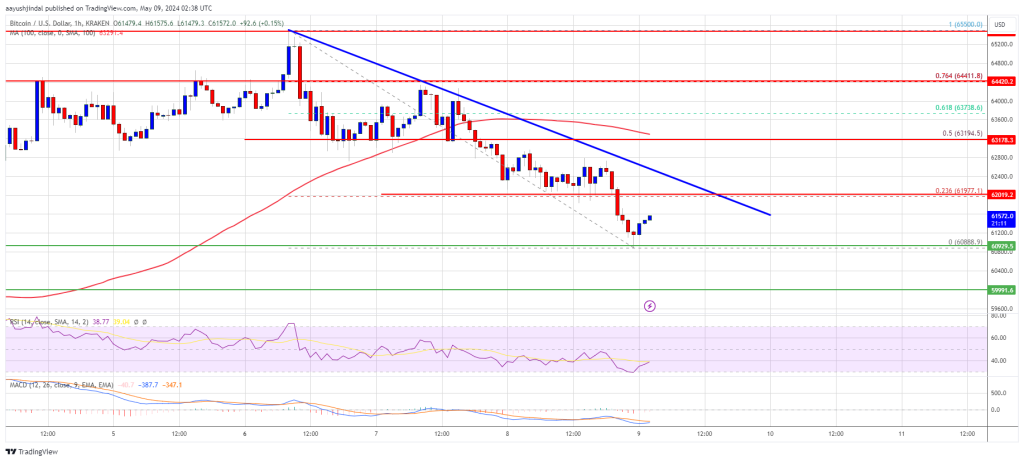
Source: BTCUSD on TradingView.com
The main hurdle is now at $63,800. A clear move above the $63,800 resistance might send the price higher. The next resistance now sits at $64,450. If there is a close above the $64,450 resistance zone, the price could continue to move up. In the stated case, the price could rise toward $65,500.
If Bitcoin fails to climb above the $62,000 resistance zone, it could continue to move down. Immediate support on the downside is near the $60,850 level.
The first major support is $60,000. If there is a close below $60,000, the price could start to drop toward $58,000. Any more losses might send the price toward the $56,500 support zone in the near term.
Technical indicators:
Hourly MACD – The MACD is now gaining pace in the bearish zone.
Hourly RSI (Relative Strength Index) – The RSI for BTC/USD is now below the 50 level.
Major Support Levels – $60,850, followed by $60,000.
Major Resistance Levels – $62,000, $63,200, and $64,450.
The CEO of analytics firm CryptoQuant has explained how the Bitcoin network fundamentals could support a market cap three times the current size.
In a new post on X, CryptoQuant founder and CEO Ki Young Ju has talked about what the network fundamentals could reveal about how much more market cap Bitcoin can sustain.
BTC is a cryptocurrency that runs on the proof-of-work (PoW) consensus mechanism, meaning that validators called miners compete with each other using computing power to get the chance to add the next block to the blockchain.
Miners have to pay constant electricity costs to run this computing power. Generally, these chain validators do so by selling their block rewards. These rewards are fixed in BTC value and given out at a more or less constant rate, so the main variable in miner finances is the asset’s USD value.
Mining-related economics are very much related to the cryptocurrency’s price. A metric central to the miners is the Hashrate, a measure of the computing power this cohort has connected to the Bitcoin blockchain.
Below is a chart that shows the trend in the 7-day average value of this BTC indicator over the past year.
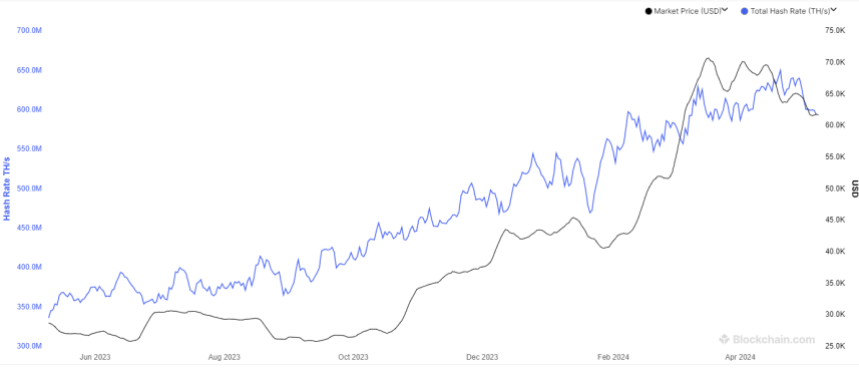
As the graph shows, the Bitcoin Hashrate has been riding an uptrend during this period, largely due to the rally that the asset’s price has enjoyed in this window.
To relate this fundamental metric with the price of the asset, the CryptoQuant CEO has referred to the “Hashrate/Market Cap Ratio,” which is an indicator that keeps track of how the market cap (that is, the total valuation) of the cryptocurrency compares against its Hashrate.
Here is the chart shared by Ju that shows the trend in this metric over the last few years:
The graph shows that the Bitcoin Hashrate/Market Cap Ratio has been at low levels compared to the highs the metric achieved during the 2021 bull run.
This is despite the fact that the asset’s price is currently at similar levels to back then. The reason behind this trend is that the network’s Hashrate is now more than three times what it was then.
If the ratio’s high from the previous cycle top is where the cycle peak will also be observed this time around, then it means that the asset’s market cap could increase over three times from its current value.
Based on this, Ju suggests that the current network fundamentals could potentially sustain a price of $265,000.
At the time of writing, Bitcoin is trading at around $62,300, up more than 9% over the past week.

Analysts forecast a Bitcoin run to $265,000, but it could take longer than investors expect.
Thomas Jong Lee, the Chief Executive Officer (CEO) of Fundstrat, an independent financial research boutique, has maintained a bullish stance on Bitcoin. The financial analyst has predicted that the world’s largest cryptocurrency could surge massively, doubling its current price to reach $150,000 during the 2024 crypto market cycle.
During a recent interview on Squawk Box, CNBC on May 7, Lee doubled down on his previous Bitcoin forecast, expressing strong confidence that the pioneering cryptocurrency would experience a dramatic surge before the end of 2024. He predicts that Bitcoin, currently priced at $62,371, according to CoinMarketCap, will exceed previous all-time highs and reach $150,000.
Related Reading: Can Ethereum Reclaim $4,000? Fragile Fundamentals Threaten To Send ETH Crashing
The Fundstrat CEO disclosed earlier in April in an interview with CNBC Television, that “Bitcoin would definitely make new all-time highs this year,” predicting that the cryptocurrency could surge to $150,000 in 2024, and $500,000 long term.
He highlighted that the strong demand for BTC has been fueling its price increase. Furthermore, the integration of the Rune Protocol, a new token standard for issuing fungible tokens on the Bitcoin network, has also bolstered the blockchain’s network.
Lee’s ambitious forecast of Bitcoin comes at a time when the market has been experiencing significant volatility and periods of fluctuations. Bitcoin previously surged to an all-time high above $73,000 in March, propelled by the hype and demand for Spot Bitcoin ETFs.
However, after Bitcoin halving on April 20, which many analysts and investors believed would trigger another price rally, BTC witnessed a dramatic drop, falling as low as $57,000 at some point in May.
Despite the upheaval in the broader crypto market, Lee remains optimistic about Bitcoin’s long-term value. His unwavering confidence in the cryptocurrency’s robust price fundamentals is reflected in his expectations of a potential price surge to or even exceeding half a million in the coming years.
While Lee made his bullish projections about Bitcoin, he also discussed the present inflationary situation and economic conditions of the United States. According to the Fundstrat CEO, inflation in the US is set to cool off dramatically, potentially triggering an upward momentum for Bitcoin if this happens.
Related Reading: Here’s How This Ethereum Whale Made $16 Million From A Single Trade
The CEO disclosed that the Federal Reserve (FED) currently has more leeway to cut rates, citing their impacts on the country’s banking balance sheet. Although he refrained from specifying a precise timeline for the drop in the US inflation rate, Lee indicated that it could potentially occur by the second half of 2024.
Overall, the Fundstrat CEO has maintained an optimistic outlook for inflationary pressures in the US, with Bitcoin typically serving as a hedge against inflation and a store of value during these periods of economic uncertainty.
Amid turbulence surrounding the crypto market, popular founder and Chief Executive Officer (CEO) of Into The Cryptoverse Benjamin Cowen has taken the spotlight to shed his insights on the recent downtrend observed in the Ethereum/Bitcoin (ETH/BTC) pair. Cowen’s views examine the complex relationship between Ethereum and Bitcoin pricing and the potential for further downside risk.
According to Benjamin Cowen, the ETH/BTC pair is currently on the downside, and the last 2 times that the pair declined, ETHUSD witnessed a steep decline of around 70%. Given that the crypto community has been eagerly anticipating an Altcoin season for the past 2.5 years, Cowen thinks it is crucial to warn the community that there is still a possibility of a downward movement.
Cowen has also confirmed that ETH/BTC is presently being rejected by the bull market support band, which he previously predicted days back due to a price pump. “I would expect it (ETH/BTC) to be rejected by the bull market support band, at least when looking at weekly closes ($0.053-$0.054),” he stated. He further noted that the pump appears to be mirroring the last cycle of rate cuts right before summer capitulation.
Following the launch of Bitcoin Spot Exchange-Traded Funds (ETFs), Cowen mentioned that ETH/BTC saw a sharp rally. The analyst affirms that the rally was probably similar to the trend of the previous bull cycle, ushering in new lows.
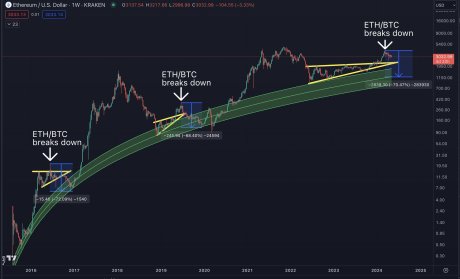
Furthermore, Cowen stated that there has been an unquestionable macro downtrend since November 2021, particularly following the merger of the ETH/BTC pair. However, it is also evident that the market did not decrease abruptly.
As a result, investors held ETH instead of BTC all the way down from 0.085 to 0.048 because of the multiple lower highs, giving the impression that it was holding up quite well.
Prior to the Bitcoin Halving, Cowen predicted that the bull market support band would reject ETH/BTC, at least when considering weekly closes ($0.053-$0.054), should there be a rebound after the Halving, similar to that witnessed with BTC spot ETF launch. Regardless of what occurs, the expert is confident that ETH/BTC will reach between $0.03 and $0.04 by this summer.
Being the two leading cryptocurrency assets, there is great interest surrounding Ethereum and Bitcoin. However, on-chain analytics firm Glassnode has highlighted a shift in performance between both digital assets.
According to the firm, the performance of Ethereum and Bitcoin has been increasingly diverging so far in the 2023–2024 cycle. This is due to poorer performance in ETH price, which is explained by a generally weaker trend in capital rotation. In addition, this is evident when particularly compared to preceding cycles and all-time highs.
The recent unimpressive price action of Bitcoin is playing out in the minds of institutional investors, with recent data highlighting their bearish sentiment. This has led to a wave of massive outflows from Bitcoin investment products, which could negatively impact the flagship crypto.
CoinShares revealed in a blog post that Bitcoin investment funds recorded an outflow of $284 million last week. Most of these outflows are said to have come from the US Spot Bitcoin ETFs, which saw outflows of $156 million last week. CoinShares noted that last week was the first time these funds recorded such a measurable amount of outflows.
Related Reading: Can Ethereum Reclaim $4,000? Fragile Fundamentals Threaten To Send ETH Crashing
These US Spot Bitcoin ETFs indeed had a week to forget last week, as even BlackRock’s iShares Bitcoin Trust (IBIT) recorded its first day of outflows since launch, with almost $37 million exiting the fund.
CoinShares suggested that the magnitude of outflows was likely due to Bitcoin dropping below $62,000, which they estimate is the average purchase price of these ETFs since launch. Therefore, they claim that Bitcoin’s decline may have triggered automatic sell orders.
Before now, institutional investors had already shown mixed feelings towards these funds thanks to Bitcoin’s recent price action. As such, it makes sense that Bitcoin dropping below $60,000 made them panic sell instead of holding their positions.
Despite this development, CoinShares noted that the Spot Bitcoin and Ethereum ETFs in Hong Kong which launched last week, were a bright spot, recording $307 million in inflows in the first week of trading. The launch of these funds could prove timely, with Bitcoin needing a catalyst to continue its upward trend.
Interestingly, CoinShares revealed that Bitcoin was the only crypto asset to record outflows. On its part, Ethereum broke its seven-week streak of recording outflows, with $30 million flowing into Ethereum investment products. Other altcoins like Avalanche, Cardano, and Polkadot also saw inflows.
With Grayscale’s GBTC recording its first day of net inflows last week, there was the feeling that such development could spark a turnaround in the outflows that the Spot Bitcoin ETFs have been recording. However, that hasn’t been the case. On May 7, these funds recorded a net outflow of $15.7 million.
Related Reading: Here’s How This Ethereum Whale Made $16 Million From A Single Trade
GBTC was again the primary culprit, with the fund seeing a net outflow of $28.6 million. These outflows have continued to affect Bitcoin’s price negatively, given the amount of selling pressure it is piling on the flagship crypto.
At the time of writing, Bitcoin is trading at around $62,300, down over 2% in the last 24 hours, according to data from CoinMarketCap.
Susquehanna International Group, a behemoth in asset management with a trading volume handling numerous financial products globally, has made a substantial investment in Bitcoin through various exchange-traded funds (ETFs). A disclosure to the Securities and Exchange Commission (SEC) on May 7 revealed that Susquehanna held approximately $1.2 billion in spot ETFs during the first quarter of 2024.
The details of the investment are particularly notable for their scale and diversity. Susquehanna now holds 17,271,326 shares in the Grayscale Bitcoin Trust (GBTC), which alone is worth approximately $1.09 billion as of March 31, 2024. This single investment represents a significant portion of the entire BTC investment, indicating Susquehanna’s preference for Grayscale due to its high liquidity.
Further diversification in Susquehanna’s holdings includes 1,349,414 shares of Fidelity‘s spot Bitcoin ETF (FBTC), valued at roughly $83.74 million. In addition, the firm has significantly increased its stake in the ProShares Bitcoin Strategy ETF (BITO), which offers exposure to BTC futures contracts. Susquehanna owned 7,907,827 shares of BITO as of the same date, valued at approximately $255.42 million — this represents a 57.59% increase from a February filing that listed 5,021,149 shares.
Additionally, Susquehanna’s Bitcoin ETF portfolio includes stakes in other high-profile funds such as the BlackRock ETF, ARK21 ETF, Bitwise ETF, Valkyrie ETF, Invesco Galaxy ETF, VanEck ETF Trust, and WisdomTree ETF. The firm’s strategic selection of funds illustrates its comprehensive approach to capitalizing on different aspects of Bitcoin’s investment potential.
Susquehanna International Group, LLP holds over $1 Billion in Bitcoin ETFs in Recent Portfolio Update pic.twitter.com/0UPzLUVRsK
— Phoenix » PhoenixNews.io (@PhoenixTrades_) May 7, 2024
Julian Fahrer, CEO and co-founder of Apollo, commented on the magnitude of this development, stating, “HUGE: Susquehanna International Group is the biggest Bitcoin ETF whale yet! $1.2 Billion held across 10 ETFs! The monsters are here.” This enthusiastic endorsement reflects the growing optimism and institutional interest in cryptocurrency investments.
Despite these considerable stakes, Susquehanna’s allocation to BTC remains a relatively minor fraction of its total portfolio. With total investments surpassing $575.8 billion, the $1.2 billion in Bitcoin ETFs constitutes approximately 0.22% of the firm’s holdings, signaling a cautious yet significant entry into the digital asset space.
This move by Susquehanna has far-reaching implications for the market. Bitcoin ETFs got off to a roaring trading start and have seen interest wane in recent weeks. The rise in institutional investment, as evidenced by Susquehanna’s activities, is expected to enhance Bitcoin’s credibility and stability as a financial asset.
Moreover, Susquehanna’s diverse investment is not just limited to direct Bitcoin exposure. The company also reported indirect exposure through its holdings in MicroStrategy stock, which possesses a substantial Bitcoin reserve on its balance sheet. However, in a recent rebalancing, Susquehanna reduced its stake in MicroStrategy by nearly 15%, adjusting its exposure in line with its strategic portfolio adjustments.
At press time, BTC traded at $62,352.
Bitcoin price failed to clear the $65,500 resistance. BTC is now moving lower and there are a few bearish signs emerging below the $63,500 level.
Bitcoin price extended its increase above the $64,500 level. However, BTC struggled to clear the $65,500 resistance zone. A high was formed at $65,550 and the price is now correcting gains.
There was a move below the $64,000 level. The price declined below the 23.6% Fib retracement level of the upward wave from the $56,380 swing low to the $65,550 high. Besides, there was a break below a major bullish trend line with support at $63,700 on the hourly chart of the BTC/USD pair.
Bitcoin is now trading below $63,500 and the 100 hourly Simple moving average. Immediate resistance is near the $63,350 level. The first major resistance could be $64,000. The next key resistance could be $65,000.
Source: BTCUSD on TradingView.com
The main hurdle is now at $65,500. A clear move above the $65,500 resistance might send the price higher. The next resistance now sits at $66,650. If there is a close above the $66,650 resistance zone, the price could continue to move up. In the stated case, the price could rise toward $68,000.
If Bitcoin fails to climb above the $63,500 resistance zone, it could continue to move down. Immediate support on the downside is near the $62,000 level.
The first major support is $61,000 or the 50% Fib retracement level of the upward wave from the $56,380 swing low to the $65,550 high. If there is a close below $61,000, the price could start to drop toward $60,000. Any more losses might send the price toward the $58,000 support zone in the near term.
Technical indicators:
Hourly MACD – The MACD is now gaining pace in the bearish zone.
Hourly RSI (Relative Strength Index) – The RSI for BTC/USD is now below the 50 level.
Major Support Levels – $62,000, followed by $60,000.
Major Resistance Levels – $63,500, $64,000, and $65,500.
The crypto market is currently buzzing with anticipation as Bitcoin options traders position themselves for what they foresee as a “substantial price rally” in September.
Particularly, the derivatives market is expressing confidence, with a significant number of traders betting on Bitcoin surpassing the $100,000 mark.
Recent analysis from industry experts highlights a significant trend in Bitcoin options that points to growing optimism among traders. According to insights from QCP Capital, a noticeable shift has occurred in the risk reversals landscape, with calls (options to buy) now priced higher than puts (options to sell).
QCP Capital noted that this change underscores a “stronger demand” for potential price increases rather than hedges against declines.
The preference for call options, particularly those pegged at ambitious strike prices of $75,000 and $100,000 for September, underscores the bullish sentiment permeating through the market.
Data from the Deribit derivatives exchange corroborates this trend, revealing that call options with a strike price of $110,000 for the end of September are currently seeing the highest volume.
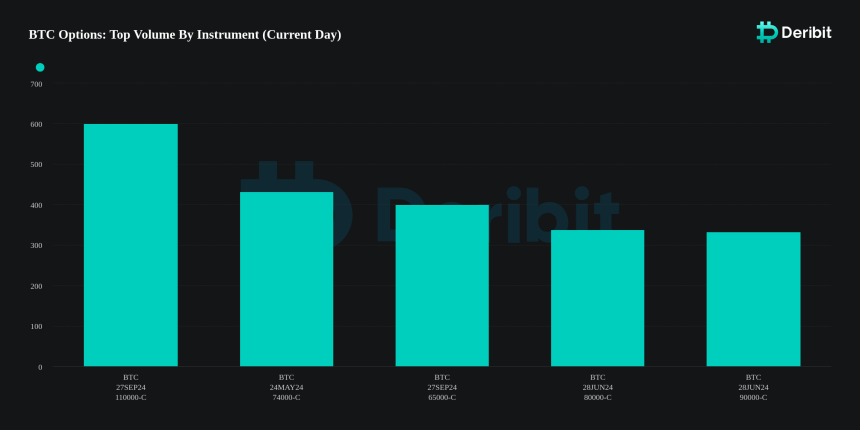
This enthusiasm in the options market is a strong indicator of the traders’ bullish outlook for Bitcoin, suggesting that many are betting on a significant price uptick by the end of the third quarter.
However, the skies are not clear. Bitfinex analysts have pointed out actions by Bitcoin whales that might signal potential short-term volatility. The whale ratio on exchanges—a metric indicating the amount of Bitcoin large holders are moving to exchanges—has seen an uptick.
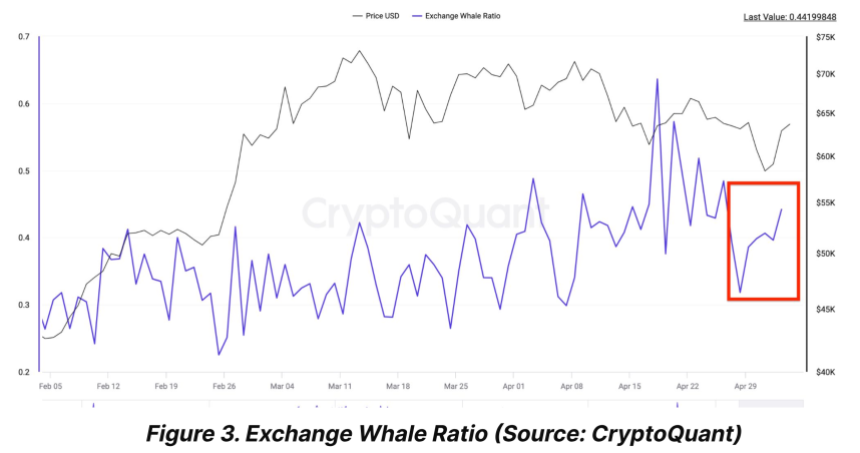
This could typically suggest that these major players are considering selling, which could introduce increased sell pressure in the market.
Bitfinex’s recent Alpha report revealed that while the short-term holders of Bitcoin seem to be at a pivot point with a realized price of $58,700 acting as an “important support level,” the increased activity by whales on exchanges might lead to heightened price fluctuations.
Despite these potential short-term pressures, the broader Bitcoin market has shown signs of recovery. After a drop from its peak above $73,000 in March, Bitcoin has demonstrated resilience with a 5.8% increase over the past week and a 2.8% rise in the last 24 hours alone. This recovery has brought its trading price to around $63,791 at the time of writing.
Adding to the long-term confidence in Bitcoin, Michael Saylor of MicroStrategy shared his views on the future catalysts for Bitcoin’s price.
In his perspective, regulatory decisions, particularly those rejecting spot exchange-traded funds (ETF) applications for other cryptocurrencies, will further solidify Bitcoin’s standing as an unmatched digital asset.
Saylor disclosed that this regulatory moat could potentially steer more institutional investments towards Bitcoin, as it remains the ‘steel’ of the cryptocurrency world—unparalleled and indispensable.
Featured image from Unsplash, Chart from TradingView
The cryptocurrency market has recently exhibited distinct divergences in the behavior of its two leading assets, Bitcoin and Ethereum. While Bitcoin appears to be stepping into a phase of relative stability, Ethereum’s journey paints a contrasting picture of sustained uncertainty, particularly in its options market.
This divergence is highlighted by the sustained high levels of implied volatility associated with Ethereum options, signaling a cautious outlook among investors regarding its future price movements.
Implied volatility (IV) serves as a crucial indicator in the options market, providing insights into the expected price fluctuations of an asset over a specific period. It reflects the market’s temperature, gauging the intensity of potential price movements traders anticipate.
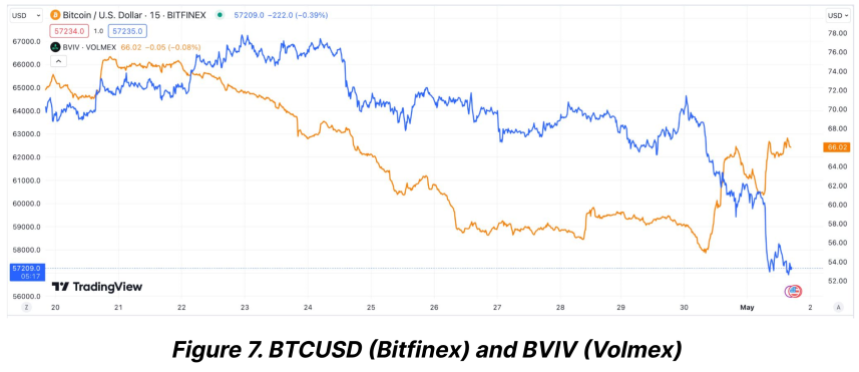
Recent analyses suggest that while Bitcoin’s implied volatility has settled down significantly post-halving, Ethereum’s has not followed suit. As Bitcoin’s IV dipped to a multi-month low, indicating a calming market, Ethereum’s IV remains stubbornly high.
Contrary to the calming waves in the Bitcoin market, Ethereum wrestles with heightened volatility. According to data from Bitfinex Alpha Report, Bitcoin’s volatility index sharply declined from 72% at the time of its latest halving event to about 55%.
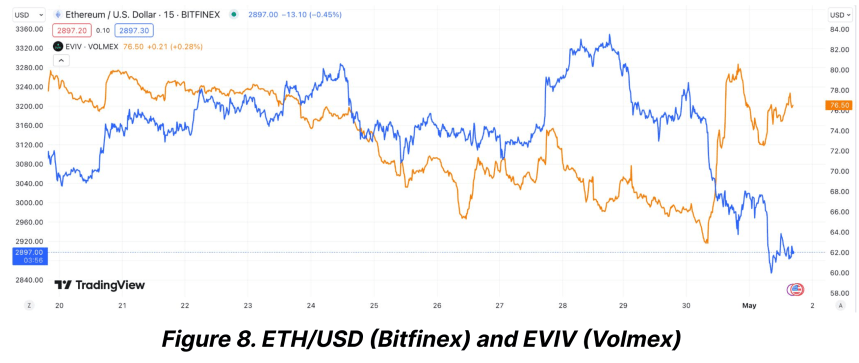
On the other hand, Ethereum saw a more modest reduction in its volatility index, dropping from 76% to 65% in the same period. This persistent volatility in Ethereum’s market is primarily fueled by uncertainties surrounding significant upcoming regulatory decisions and broader market implications.
The Ethereum market is particularly jittery in anticipation of the US Securities and Exchange Commission’s (SEC) impending decision on two spot Ethereum ETFs, slated for late May 2024.
This upcoming regulatory milestone is considered a critical event that could either catalyze a major market move or exacerbate the current volatility.
The Bitfinex Alpha report underscores that regulatory uncertainty is a primary driver behind Ethereum’s less significant drop in its Volatility Risk Premium (VRP) compared to Bitcoin’s.
Ethereum and Bitcoin have shown signs of recovery over the past week in terms of trading performance. Bitcoin has seen a 4.1% increase, while Ethereum reported a more modest gain of 2.4%.
However, the last 24 hours have been less favorable for Ethereum, with a slight dip of 0.7%, underscoring the ongoing volatility and investor caution.
Moreover, Ethereum’s network dynamics also reflect a subdued activity with a marked decrease in ETH burn rate attributed to reduced transaction fees.
This technical aspect further complements a cautious Ethereum market narrative, poised on the brink of potentially significant shifts depending on external regulatory actions.
Despite all these, analysts like Ashcrypto suggest that the current volatility could set the stage for a strong rebound in the year’s third quarter. Drawing on historical patterns, Ethereum’s speculative forecast is potentially reaching the $4,000 mark, provided market conditions align favorably.
Featured image from Unsplash, Chart from TradingView