Why is Bloomberg predicting a Bitcoin price at 400K in 2021?

Bitcoin has picked up its bullish momentum in the last 24 hours. High levels of Institutional adoption, fundamentals, and on-chain indicators look bullish and point to an extension of the rally, at least, in the long term.

In a recent report, Senior Commodity Strategist for Bloomberg Intelligence, Mike McGlone, states that Bitcoin is in a “transition phase.” As a result, the benchmark cryptocurrency could move from being a “risk asset” to become a global reserve asset.

Comparing the “rhythm” of Bitcoin’s 2017 bull market to the current one, McGlone estimates that Bitcoin’s price could peak at about $400,000 by the end of the year. In the chart below, he notes a correlation between surges in the cryptocurrency’s price and a rise in its Liquidity Index.

Bitcoin BTC
Source: Bloomberg Intelligence

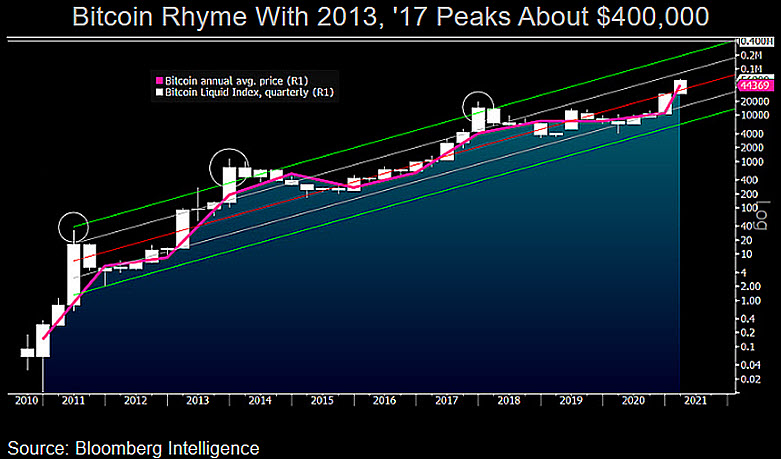
In late 2020 and early 2021, it can be seen how the latter metric has seen two significant growths. Recent Bitcoin price action and the approval of several Exchange Traded Fund (ETF) in Canada have had an impact on Grayscale Bitcoin Trust (GBTC). This product has been one of the most favored for institutional adoption.

However, its premium has trended lower in recent days. On the relationship between BTC’s price and the drop in GBTC’s premium, McGlone concludes:

Bullish underpinnings for GBTC are gaining legs, as it outpaced Tesla by almost 50% this year. The increasing probability for Bitcoin ETFs in the U.S. is supporting the price…but contributing to the GBTC discount.

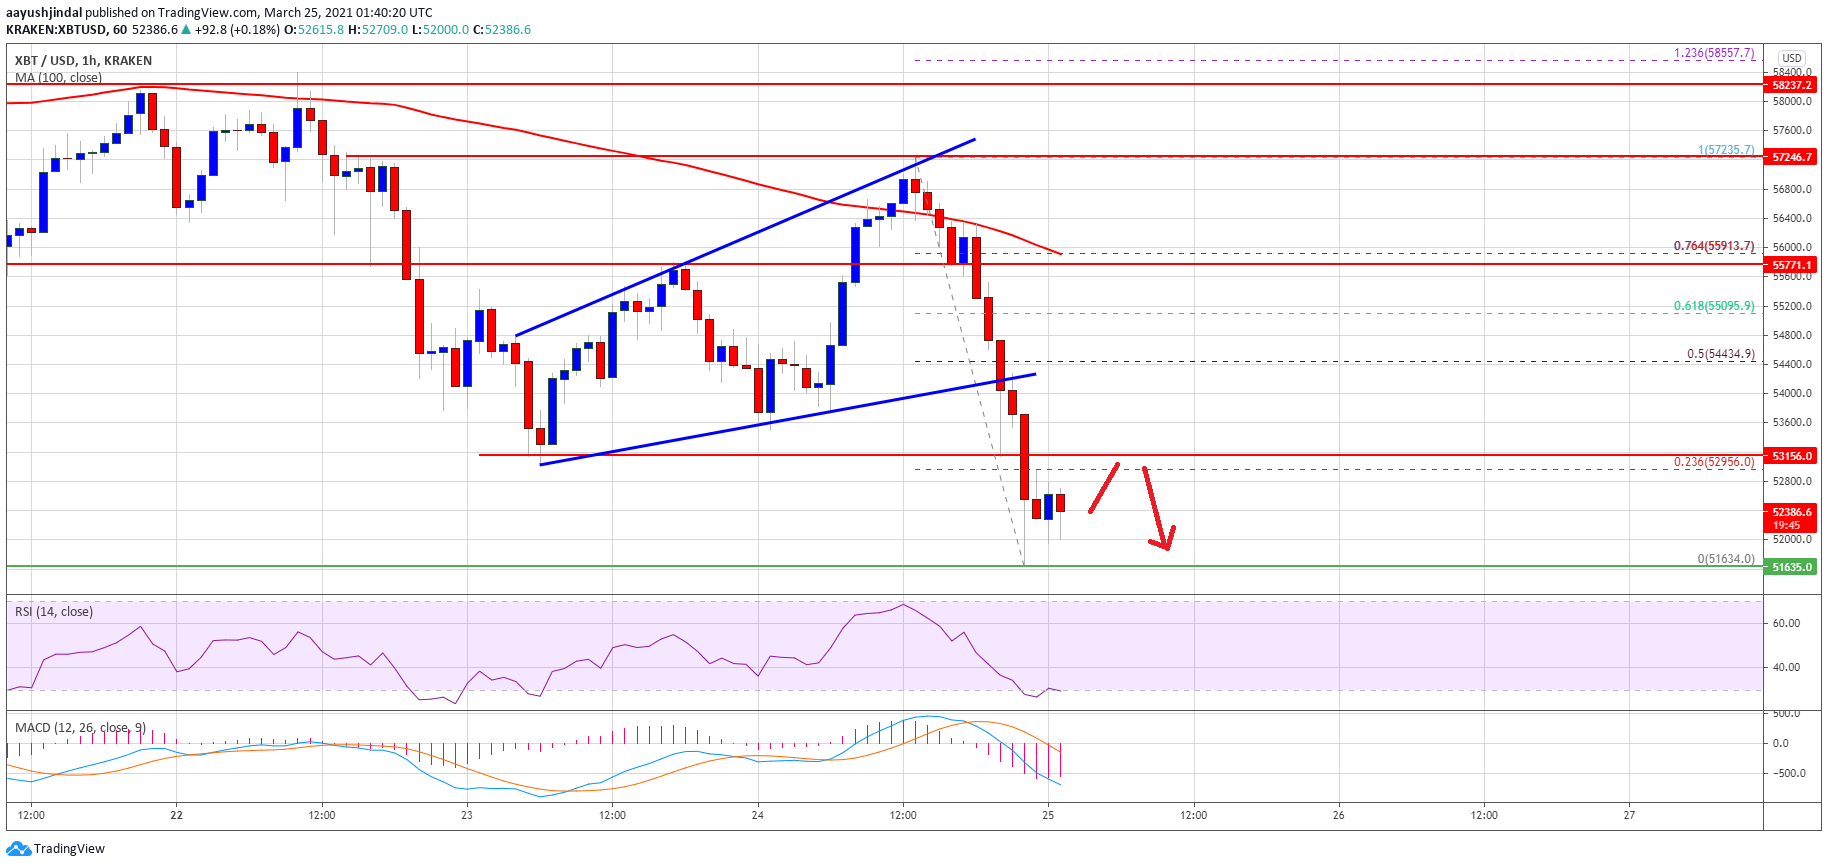
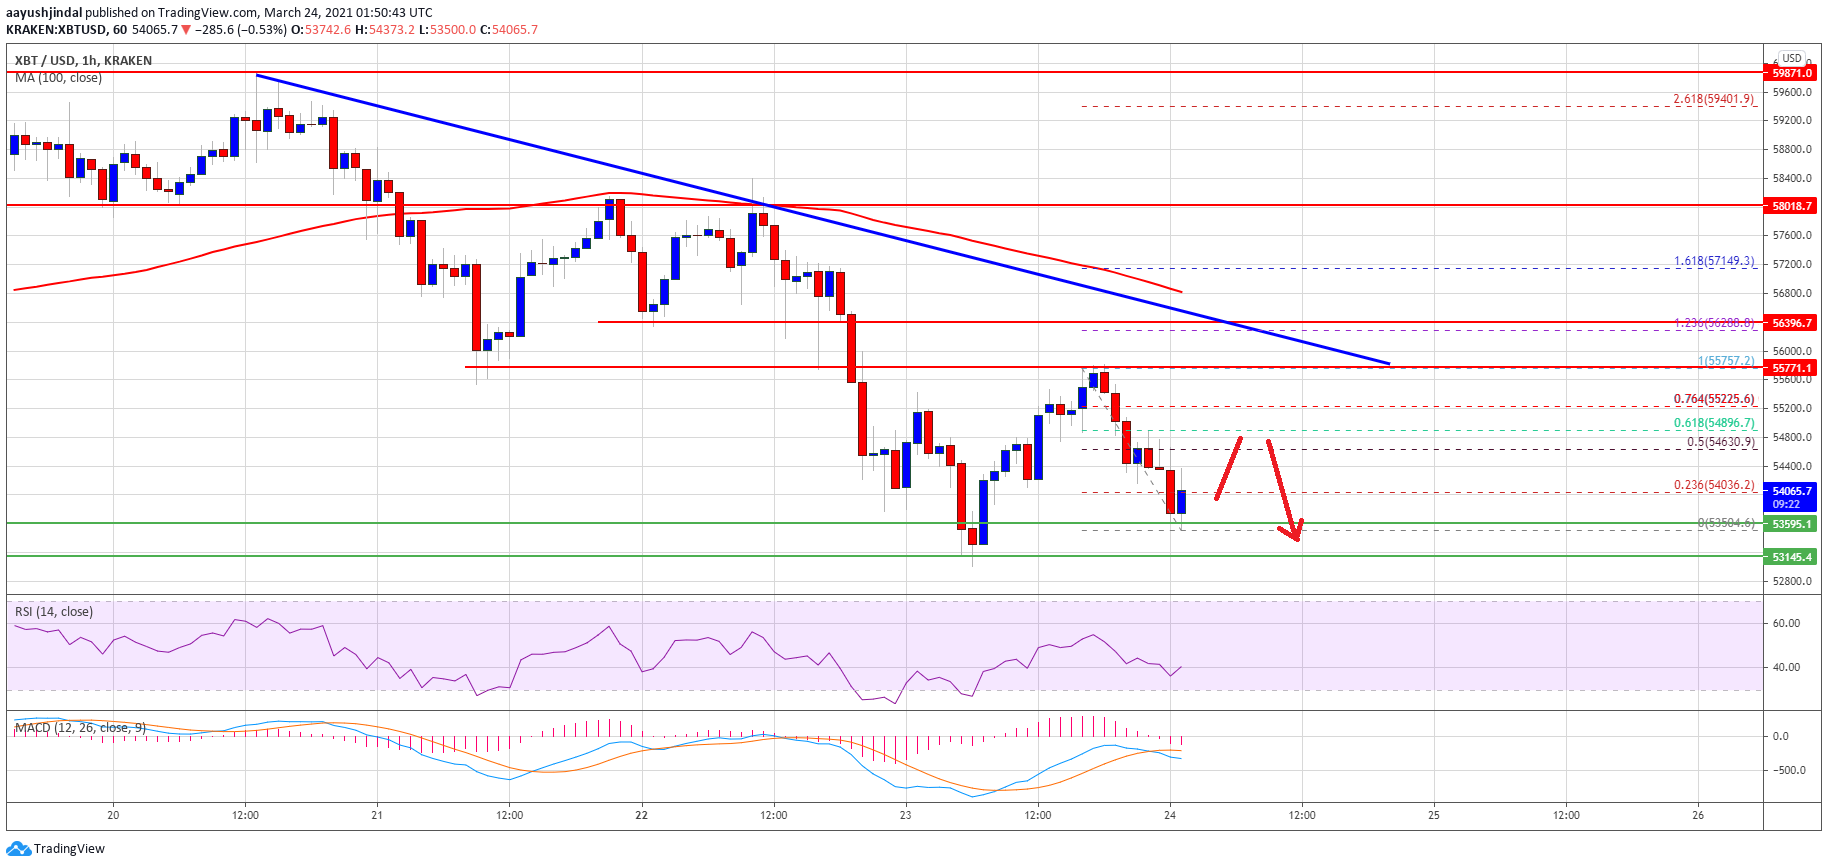
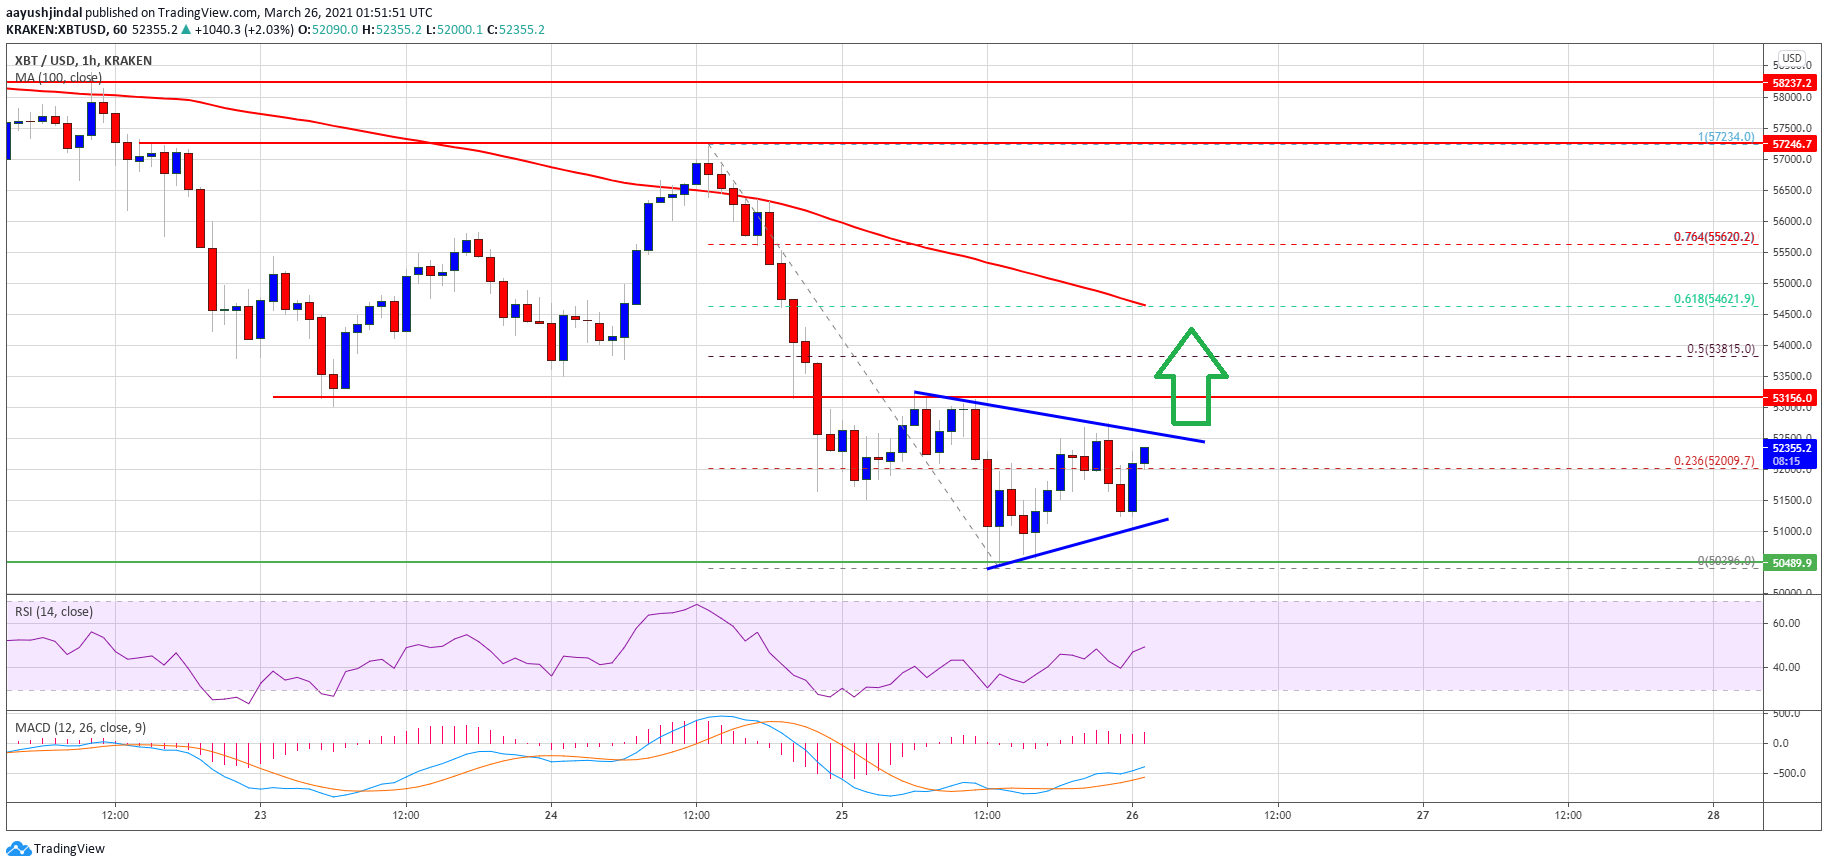
Where is Bitcoin price heading in the short term?

In the short term, the sideways trend Bitcoin price has seen recently could change and shift in the bulls’ favor. A “massive” amount of GBTC shares will be “unlocked” in the immediate future. The benchmark cryptocurrency could benefit, as analyst Ben Lily stated:

Which is creating a lot of uncertainty to its future. What I’d like to remind readers is each time a wave of large unlockings hit, not only does bitcoin’s spot price rise, but the share price of the Trust gains in value with respect to its underlying holdings (NAV). If we ignore the fact it’s at a discount then the likelihood of this measure to rise based on history is batting one-thousand-perfect.

Bitcoin’s Stock to Flow model creator, Plan B, has published estimates that coincide with Bloomberg’s analyst’s forecasts. In his latest chart based on the referenced controversial model, Bitcoin’s price could approach $500,000 by the end of 2021.

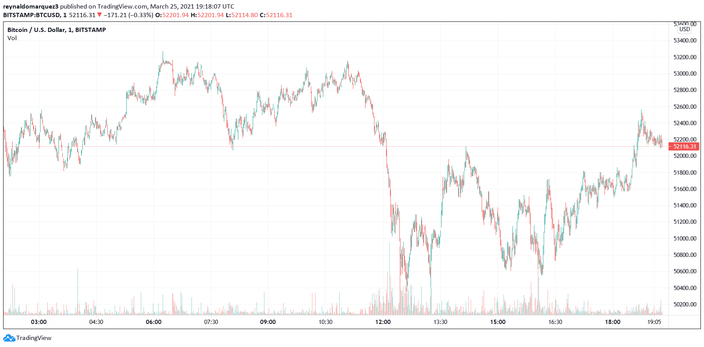
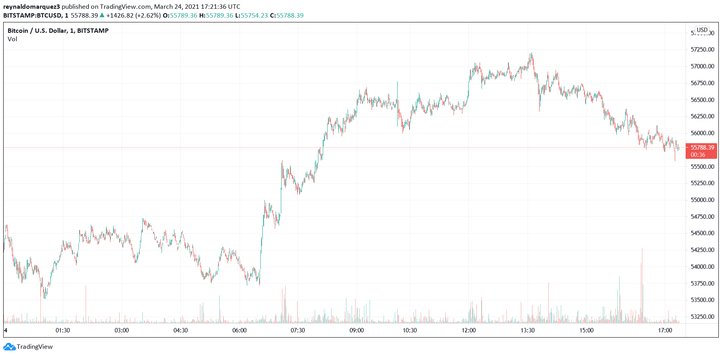
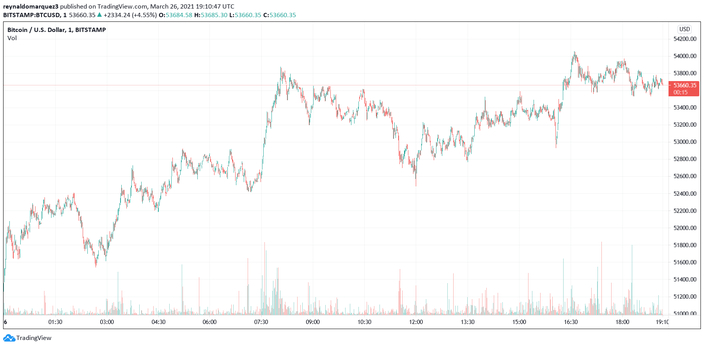
Bitcoin is trading at $53,657 with gains of 3.4% on the last day. Although the monthly chart shows gains of 10.1%, the weekly chart is in the red with losses of 7.5%. The market capitalization stands at $1.01 trillion.

Bitcoin BTC
BTC picking bullish momentum in the 24-hour chart. Source: BTCUSD Tradingview

Massive Coinbase Outflows Suggest Bitcoin Price Is Ready To Bounce

Bitcoin price is reeling from a strong rejection from above $60,000 that has sent the leading cryptocurrency by market cap tumbling back down by more than $10,000 per coin. However, massive ongoing outflows of BTC continue to leave popular cryptocurrency exchange Coinbase Pro at an alarming rate.

The overall lack of BTC supply that only shrinks further by the day, will once again be dominated by demand, potentially causing the previously trending cryptocurrency to bounce. Could that bounce develop into a resumption of the historic uptrend? Here’s what fundamentals are saying about further continuation or correction for Bitcoin price ahead.

Coinbase BTC Outflows Continue, What Corporations Are Potentially Buying The Dip?

Bitcoin price is down more than $10,000 from its current all-time high, yet still more than double the previous peak set back in 2017.

The leading cryptocurrency has now spent more than 100 days above the former high, and likely will never return to levels near or below it.

Related Reading | Stablecoin Supply Rising, Diminishing Bitcoin Reserves Ready To Fuel Next Leg Up

In fact, Bitcoin price action might not deviate much lower than current levels, thanks to massive Coinbase Pro outflows.

Thousands of BTC leaving the popular cryptocurrency exchange catering to institutional investors has been called the most bullish signal “ever” and that was hundreds of thousands of BTC ago.

Technical factors are overheated in the cryptocurrency after such a sizable price increase, but soon, fundamentals could take over leading to a strong bounce.

Bitcoin Price To Bounce As Supply Shock Expected To Overpower Bearish Technicals

Thus far, the presence of institutions and corporations with deep wallets and cash reserves with dwindling buying power has left very little room for corrections.

Dips are being bought up long before retracements reach to past bull market totals, but that doesn’t mean momentum can’t finally turn down for even a brief time.

bitcoin coinbase corproations

Institutions and corporations buying each dip is preventing any serious corrections | Source: BTCUSD on TradingView.com

But eventually, regardless of any technical factors, no BTC left to buy could cause a supply shock that drives prices to hundreds of thousands of dollars per coin before demand begins to wane again, and available supply returns to exchanges for investors to take profit.

Related Reading | Coinbase Bitcoin Outflows Are The Strongest Bullish Signal “Ever”

At that point, the top will be in. For now, the ongoing massive outflows suggest the top is nowhere near in sight, and that bigger players are currently buying the blood in the streets.

The line in the sand drawn between bears and bulls moving higher lies at $60,000. Another move beyond that level could be an all-clear sign that the rally is ready to continue higher.

Featured image from Deposit Photos, Charts from TradingView.com

TA: Bitcoin Steadies Above $50K, Why BTC Could Recover To $55K

Bitcoin price extended its decline and traded close to $50,000 against the US Dollar. BTC is now consolidating losses and it is likely to start a recovery towards $55,000.

  • Bitcoin extended its decline below $52,500 and $51,200 support levels.
  • The price is now trading well below $55,000 and the 100 hourly simple moving average.
  • There is a key contracting triangle forming with resistance near $52,500 on the hourly chart of the BTC/USD pair (data feed from Kraken).
  • The pair is likely to correct higher towards $54,500 or even $55,000 if it clears $53,150.

Bitcoin Price Extends Losses

After a break below $53,000, bitcoin extended its decline. BTC broke the $52,500 and $51,200 support levels to move further into a bearish zone.

The bears even aimed a test of $50,000. However, the price remained stable above $50,500. A low is formed near $50,400 and the price is now consolidating losses. It is trading well below $55,000 and the 100 hourly simple moving average.

Recently, there was a correction above the $51,500 level. The price climbed above the 23.6% Fib retracement level of the recent decline from the $57,234 high to $50,400 low.

Bitcoin Price

Source: BTCUSD on TradingView.com

There is also a key contracting triangle forming with resistance near $52,500 on the hourly chart of the BTC/USD pair. If there is an upside break above the triangle resistance, the price could even break $53,150. The next key resistance is near the $53,800 level.

The 50% Fib retracement level of the recent decline from the $57,234 high to $50,400 low is also near $53,800. A successful break above $53,800 is likely to open the doors for a move towards $54,500 or $55,000.

Fresh Drop in BTC?

If bitcoin fails to correct higher above $52,500 and $53,150, there are chances of more downsides in the near term. An initial support is near the $51,000 level and the triangle lower trend line.

The first key support is now near the $50,500 level, below which the price is likely to test the $50,000 support zone. Any more losses might push the price towards the $48,000 support zone in the near term.

Technical indicators:

Hourly MACD – The MACD is slowly gaining momentum in the bullish zone.

Hourly RSI (Relative Strength Index) – The RSI for BTC/USD is now just above the 50 level.

Major Support Levels – $51,000, followed by $50,500.

Major Resistance Levels – $52,500, $53,150 and $54,500.

Crypto Analyst Claims MicroStrategy Is “On The Ropes” Amidst Bitcoin Selloff

MicroStrategy and its head honcho Michael Saylor have become synonymous with Bitcoin, responsible for kicking off the corporate treasury reserve trend that’s transpired ever since.

As a result of the innovative, albeit risky move, company shares skyrocketed to revisit dot com-bubble resistance levels. The rejection, has left MicroStrategy “on the ropes” amidst the recent Bitcoin selloff, suggesting things could potentially get a lot deeper.

Michael Saylor Keeps Buying Bitcoin As Prices Plummet

Raging Bitcoin bull Michael Saylor has spent the last several months being the mouthpiece of the top cryptocurrency by market cap, essentially acting as its CEO, marketing department, corporate business development manager, and social media manager all-in-one.

He uses his platform as a way to spread the word about the cryptocurrency’s value, which he has repeatedly double, and tripled down on, and then some.

Related Reading | This Bitcoin Metric Says The Bull Market Might Soon Be Over

At the rate he’s going, the guy will have a wallet containing more BTC than Satoshi another year or so from now. Up until recently, this has been paying off dramatically for Saylor and anyone he influenced and bought BTC, as the price per coin has been rising substantially.

microstrategy Bitcoin btc saylor

MicroStrategy shares went parabolic like Bitcoin | Source: NASDAQ-MSTR on TradingView.com

In tandem, the price per share of MicroStrategy (MSTR) also went parabolic, mimicking the current Bitcoin price chart.

The recent selloff and potential peak in the leading cryptocurrency by market cap, is following a similar trajectory downward after doing the same on the way up.

MicroStrategy Shares On The Ropes, Here’s Why Investors Could Be Uneasy

MicroStrategy shares are now “on the ropes,” according to one top crypto analyst.  A potential retest could be in progress, and if the attempt fails, it could be a technical knock out for the corporation’s crypto-fueled rally.

But could this also mean that sentiment is shifting enough in Bitcoin for MicroStrategy to be affected this negatively? That same theory vice versa doesn’t make sense.

Whatever the case may be, there is a chance that Saylor’s bet on Bitcoin will be right, but was still a little too soon for the cryptocurrency.

microstrategy Bitcoin btc saylor bitcoin

Michael Saylor's company shares were hit hard post dot com era | Source: NASDAQ-MSTR on TradingView.com

Where the recent MicroStrategy rally topped out, was at resistance dating back to the dot com bubble. When that popped, Saylor was reportedly left as one of that era’s biggest losers financially, according to Fortune Magazine. Saylor had lost a total of $13.5 billion.

Related Reading | Why March Is The Bloodiest Month In Bitcoin History

Once again, Saylor could end up losing out big due to his commitment to being a pioneer in the cryptocurrency. The bold bet in Bitcoin has paid off, but his continued push has made many investors question his speculative bet – which could be behind the correction in MicroStrategy shares in the first place.

Featured image from Deposit Photos, Charts from TradingView.com

Now Or Never: Litecoin Plummets To Bottom Of Top Ten Crypto Assets

Litecoin is often called the silver to Bitcoin as digital gold, and strangely, the two cryptocurrencies and two precious metals are exhibiting the same behavior where one is lagging behind the other.

The lack of momentum in the digital and physical forms of silver have kept the price of both assets at bay for the entire recent bull market in each class. With no growth in Litecoin compared to other cryptocurrencies, the altcoin is only a billion dollars away from losing the top ten cryptocurrency by market cap status – something its held pretty much since its inception.

“Digital Silver” Is The Altcoin That Simply Won’t Shine

Litecoin is an offshoot of the original Bitcoin code, created in 2011 by former Google and Coinbase engineer Charlie Lee.

Much like how on a per ounce basis gold is more both more scarce and valuable than silver is, there are four times as many total LTC compared to Bitcoin’s 21 million BTC.

Related Reading | Digital Silver: Why Litecoin Is Poised To Bounce Versus Bitcoin

In addition, there’s faster transactions, among other benefits. Outside of the few differences, there’s mostly similarities between them – including a hard-coded halving recurring every four years or so.

litecoin versus bitcoin ethereum Litecoin is severely lagging behind the rest of crypto | Source: LTCUSD on TradingView.com

But unlike Bitcoin, that halving amounted to very little in terms of sustainable returns for investors of the altcoin. The cryptocurrency is lagging far behind Bitcoin, Ethereum, and most other cryptocurrencies in the market.

Also unlike Bitcoin or Ethereum and several other altcoins, Litecoin has failed to set a new all-time high since the bull market began.

Even gold has set a new price record, while silver still trades well below its. It is bizarre that the asset dubbed digital silver, is following the path of physical silver so well, versus the rest of the crypto world.

Litecoin At Risk Of Losing Top Ten Crypto Status

The continued underperformance of Litecoin compared to there rest of the market, however, could knock the cryptocurrency out of the top ten assets ranked by market cap, according to price aggregator CoinMarketCap.

The animated GIF above is a look back at the past decade or so the historical snapshots will go back, taken from the first ever date, then annually each March closest to the end of the month.

Every single snapshot, Litecoin is ranked anywhere from number two to ten, and every rank in between. It’s never had the number one spot, but it’s also never lost the top ten.

Related Reading | Five Signs Litecoin Has Bottomed, Next In Line For New ATH

But the likes of Chainlink, Stellar, and Bitcoin Cash are all right on its tail, some within a $1 billion striking distance for making history for unseating Litecoin. Each of the three assets have also had a stint in the top ten themselves.

There’s also a rising stablecoin – USD Coin – right on its tail, and with more stablecoins being created monthly, the chances of it taking out the altcoin are also high.

Could a fall out of the top ten and from grace be a fatal blow for the coin, or is sentiment reaching this deep of a low in the coin a sign that capitulation is setting in and things might finally turn around?

Given how far behind Litecoin is, the low supply, several bullish technicals, and more, the altcoin could end up shocking the world when it finally does.

Featured image from Deposit Photos, Charts from TradingView.com

Microsoft deploys solution on Bitcoin, calls it the most secure network

Senior Product Manager for Decentralized Identity at Microsoft, Daniel Buchner, has confirmed the release of ION. Deployed on the Bitcoin mainnet, this solution is a permissionless public network for Decentralized Identifiers (DIDs).

Implemented on Bitcoin’s blockchain, it operates as a second-layer solution to support a DIDs/DPKI (Decentralized Public Key Infrastructure) at scale, according to its Github repository.

This project began four years ago, its purpose is to give individuals, organizations and others control over digital exchanges with DIDs. The ION uses a Sidetree protocol to anchor DID/DPKI transactions interacting on the network.

Each transaction is encoded with a hash that allows ION nodes to categorize, store, process, and fetch the transactions associated with a specific DID. Buchner stated in the official release:

We are excited to share that v1 of ION is complete and has been launched on Bitcoin mainnet. We have deployed an ION node to our production infrastructure and are working together with other companies and organizations to do so as well. ION does not rely on centralized entities, trusted validators, or special protocol tokens – ION answers to no one but you, the community. Because ION is an open, permissionless system, anyone can run an ION node, in fact the more nodes in operation, the stronger the network becomes.

Why did Microsoft decide to use Bitcoin’s blockchain?

The ION network is connected to Bitcoin with the InterPlanetary File System (IPFS) and does not require an additional consensus mechanism.  Its nodes can process “tens of thousands of transactions per second.” Interested users can start generating their DIDs without having to use BTC or run an ION node on their own.

In the project’s FAQ section, the ION team rates Bitcoin as the most secure blockchain on two metrics: production of a single, independent, immutable record with no way to reverse it; inexpensive cost of attacking the system. Microsoft’s ION team stated:

Bitcoin is so far beyond all other options, it isn’t even close – Bitcoin is the most secure option by an absurdly large margin.

In terms of cost, Buchner said the solution’s protocol “It’s skewed toward bandwidth and storage.” Thus, it can support 40 billion DIDs in 2 TB of memory space with a lightweight configuration for the nodes. Buchner said the following via his Twitter handle:

This is the culmination of 10 years of work, beginning in 2011 when a few of us at Mozilla set aside some of our time to explore the core concepts of Decentralized Identity. Microsoft ultimately provided the opportunity to realize this dream, and for that I am eternally grateful.

MicroStrategy’s CEO Michael Saylor welcomed the announcement and predicted that similar second-layer solutions will be released more frequently on Bitcoin. Their use cases will be broad and applied in people’s daily lives.

Bitcoin trades at $52,347 showing a slight recovery in the 1-hour chart with 1.5% gains. On the 24-hour chart, losses are at 5.6% following an 11.1% correction on the 7-day chart.

Bitcoin BTC
Bitcoin registers slight gains in the 1-hour chart. Source: BTCUSD Tradingview

TA: Bitcoin Breaks $53K, Why BTC Could Soon Revisit $50K

Bitcoin price attempted a recovery above $56,000 against the US Dollar, but it struggled above $57,000. BTC trimmed gains and it even broke the $53,200 support zone.

  • Bitcoin extended its decline below $53,200 and $53,000 support levels.
  • The price is now trading well below $54,000 and the 100 hourly simple moving average.
  • There was a break below a key bullish trend line with support near $54,220 on the hourly chart of the BTC/USD pair (data feed from Kraken).
  • The pair is likely to continue lower towards the $51,000 and $50,000 levels in the near term.

Bitcoin Price Extends Losses

Yesterday, bitcoin started a decent recovery above the $55,500 and $56,000 levels. BTC even spiked above the $57,000 resistance and the 100 hourly simple moving average.

However, the price struggled to continue higher and it started a fresh decline from the $57,235 high. It broke a few important supports near the $56,000 and $55,500 levels. There was also a break below a key bullish trend line with support near $54,220 on the hourly chart of the BTC/USD pair.

The price even declined below the $54,000 support level and the $53,200 pivot level. It traded to a new weekly low at $51,634 and it is now consolidating losses. An initial resistance is near the $53,000 level. It is close to the 23.6% Fib retracement level of the recent decline from the $57,235 high to $51,634 low.

Bitcoin Price

Source: BTCUSD on TradingView.com

The first major resistance is near the $53,200 pivot level. If there is a fresh increase above $53,200, the price could recover towards the $54,500 level. The 50% Fib retracement level of the recent decline from the $57,235 high to $51,634 low is also close to $54,500.

More Losses in BTC?

If bitcoin fails to correct higher above $53,200 and $54,500, there are chances of more downsides in the near term. An initial support is near the $51,500 level.

The first key support is now near the $51,000 level, below which the price is likely to test the $50,000 support zone. Any more losses might call for a move towards the $48,000 level.

Technical indicators:

Hourly MACD – The MACD is now gaining momentum in the bearish zone.

Hourly RSI (Relative Strength Index) – The RSI for BTC/USD is now well below the 40 level.

Major Support Levels – $51,000, followed by $50,000.

Major Resistance Levels – $53,200, $54,500 and $55,000.

Internet Celebrities Lead $5M Investment In Bitcoin Reward Program Lolli

Lolli, a BTC-back Bitcoin rewards program, has just completed a a $5M pre-Series A funding round, backed by a variety of popular internet celebrities and influencers.

Here’s more on what names are behind the $5 million in investment, and how Lolli has grown since its inception.

Internet Celebrities, Alex Ohanian and Serena Williams, Invest $5M In Bitcoin Rewards Firm

Bitcoin rewards company Lolli just revealed it has successfully raised $5 million in funding as part of a pre-Series A funding round with a notable list of investors.

Of those involved are several internet celebrities, including Reddit co-founder Alexis Ohanian, popular YouTuber Jimmy “MrBeast” Donaldson, Casey Neistat, Philip DeFranco, and CodyKo. Other notable figures include Serena Williams, who join other early investors such as Ashton Kutcher and Michelle Phan.

Related Reading | This Bitcoin Metric Says The Top Is Still 350% Away

These investors have become involved through their respective firms, Serena Ventures, her husband’s Seven Seven Six, and Mr. Beast management company Night Media, who are building into the future of Lolli alongside Digital Currency Group and others.

Lolli co-founder Alex Adelman says the company has issued more than $3 million in Bitcoin rewards to date, ranging around an average of 7% BTC-back rewards at a growing list of major retailers.

bitcoin lolli

Bitcoin has grown significantly, but these bullish factors could fuel another leg higher | Source: BTCUSD on TradingView.com

Top Lolli Users Earn 2 BTC, More Than $3 Million In Rewards Combined

Lolli boasts more than 250,000 users who can earn BTC back on purchases at retailers like Macy’s, Best Buy, Sephora, Foot Locker, and hundreds of others. These 250,000 users have collectively earned more than $3 million in Bitcoin rewards since the program’s inception.

Related Reading | Bitcoin Technicals Overheated, But Bullish Fundamentals Remain Unfazed

Top users, says the company, have earned as much as 2 BTC. Most have generated enough returns on the BTC they’ve earned, to pay for the original purchases they made in the first place.

The rewards program works through a browser extension for Chrome, Firefox, Brave, and others, letting users know when they’ve landed on a partner that they can earn rewards with. Once Lolli is enabled in-browser, simply complete the transaction, and BTC will eventually be credited to your account.

https://twitter.com/CircaDiem/status/1374714223570

That same account can also be tied to a smartphone app that lets users open a “loot box” for a daily stack of Bitcoin. Granted, these are typically tiny stacks of satoshi – the smallest unit of account of BTC – but there’s an occasional chance to win much larger cryptocurrency surprises.

The company will use the recent funding to build out the mobile app into a full shopping experience, and expand outside of the United States United States. Lolli is free to use, and at only 250,000 users globally, has enormous room to grow.

Featured image from Lolli, Charts from TradingView.com

Goldman Sachs files for a ETF with option to invest in Bitcoin

According to a document filed with the U.S. Securities and Exchange Commission (SEC), banking giant Goldman Sachs has petition approval for a new Exchange Tradable Fund (ETF) with the option to add exposure to Bitcoin.

With an ARK innovation structure and a March 19, 2021 filing date, the financial product would be called Autocallable Contingent Coupon Coupon ETF-Linked Notes. Maturing on March 26, 2026, the product proposed by Goldman Sachs contemplates:

The ETF is an actively managed exchange-traded fund that will invest under normal circumstances primarily (at least 65% of its assets) in domestic and foreign equity securities of companies that are relevant to the ETF’s investment theme of disruptive innovation.

The fund’s primary investment strategy considers “companies” or disruptive technologies to be those that rely on and benefit from “products or services under development”. In addition, these “companies” may belong to multiple sectors (energy, transportation, genomics, among others) with scientific research that supports them. The document states:

The ETF may have exposure to cryptocurrency, such as bitcoin, indirectly through an investment in a grantor trust. The ETF’s exposure to cryptocurrency may change over time and, accordingly, such exposure may not always be represented in the ETF’s portfolio.

In addition to Bitcoin, the bank’s proposed product will invest in Fintech innovation companies, “next-generation” internet companies, artificial intelligence, energy transformation, and automation transformation entities. The ETF could also give exposure to Bitcoin to third parties, as the document indicates:

The ETF is permitted to lend its portfolio securities to brokers, dealers and other financial institutions desiring to borrow securities to complete transactions, in pursuing arbitrage opportunities or hedging strategies or for other similar purposes. In connection with such loans, the ETF receives liquid collateral equal to at least 102% of the value of the portfolio securities being lent. This collateral is marked to market on a daily basis.

Banking institutions continue to increase their stake in Bitcoin

Just a few days ago, Morgan Stanley announced that it will give exposure to Bitcoin to its clients. Interested investors must have more than $5 million in an account at the bank.

The exposure will be granted by giving access to three funds, in partnership with crypto firm Galaxy Digital and FS NYDIG will enable the product.

Bitcoin price records moderate losses on the one-day chart with 3.3%, trading at $54,257. In the last week, losses stand at 6.7% with 8% on the 30-day chart.

Bitcoin BTC
Bitcoin registers moderate losses on the 24-hour chart. Source: BTCUSD Tradingview

Stablecoin Supply Rising, Diminishing Bitcoin Reserves Ready To Fuel Next Leg Up

Bitcoin price is back in the mid-$50,000 range, unable to push any lower despite bears best efforts and overheated technical indicators pointing to a potential trend reversal. However, several fundamental factors are proving to be too strong, and are setting the stage for the next leg up in the ongoing cryptocurrency bull trend instead.

Here’s what rising stablecoin supply says in the face of diminishing BTC reserves on exchanges, and what it could mean for all of crypto.

Fundamental Factors Have Fueled The Cryptocurrency’s Recent Rise To Stardom

Cryptocurrencies, like all free markets, are driven by the dynamic forces of supply and demand. Other factors, such as regulatory, political, environmental, and economical issues can also have a dramatic impact.

Related Reading | Bitcoin Technicals Overheated, But Bullish Fundamentals Remain Unfazed

Two examples of one extreme or another, include the Black Thursday market crash due to pandemic panic, and the polar opposite move to the upside due to a BTC supply shock.

bitcoin btc stablecoins reserve

Bitcoin has grown significantly, driven by bullish fundamentals | Source: BTCUSD on TradingView.com

A shift in avalaible supply and increasing demand for Bitcoin, has brought the price per coin to more than $60,000 at the high. Technicals have been mostly overheated the entire way up, and are reaching a boiling point.

Yet prices still aren’t falling any deeper than the mid-to-low $50,000 range, and it could be due to just how strong fundamental factors are currently.

The Bullish Factors Keeping Bitcoin Afloat, Another Leg Up Possible

Among the factors keeping Bitcoin price action afloat despite technical momentum indicators turning sharply down, is the continued lack of BTC on crypto exchanges. The liquidity crisis that has driven up prices so far, remains a vital factor in the buoyancy.

Related Reading | This Bitcoin Metric Says The Top Is Still 350% Away

Next, stablecoin supply has been steadily rising again, one of the primary factors behind each bullish impulse on the way up. Quant analysts have said that fresh USD was necessary to push higher, however, an increase in stablecoins could shift more capital into Bitcoin, and have a similar impact.

bitcoin btc stablecoins

Stablecoin reserves continue to rise while BTC held on exchanges drops further | Source: CryptoQuant

If the leading cryptocurrency by market cap can sustain the current support levels and keep several bearish technicals at bay, then another leg up is the only way ahead. A continued rise could squeeze shorts at current all-time highs, causing prices to return to their parabolic trajectory.

If not, however, technicals will have outweighed fundamentals for the first time during the bull market, and it could result in the first more sizable correction since it all first began.

Will the increasing supply of stablecoins and low BTC reserve be enough to shake off momentum flipping bearish?

Featured image from Deposit Photos, Charts from TradingView.com

Why Cardano’s Hoskinson is referring to a bug that forced a Bitcoin fork?

Input-Output Global CEO Charles Hoskinson announced that he has prepared his segment for the highly anticipated Cardano 360 event. In the mysterious post, Hoskinson hinted at a bug that allowed a hacker to mint 184 billion Bitcoin.

Known as the “Value Overflow Incident”, the bug was recorded in August 2010 and forced Bitcoin creator Satoshi Nakamoto to fork Bitcoin’s blockchain to “delete” the generated BTC. These were sent to two separate addresses.

A few hours after the event, a new version of the Bitcoin client was released and the chain considered “good” overtook the “bug blockchain” at block height 74691. The BTCs created by the bad actor ceased to exist.

In the image presented by Hoskinson, other tabs are also visible in his browser. This refers to smart contracts and the platform that will support them on Cardano’s blockchain, Plutus. Some users speculate that the reference to the “Value Overflow Incident” is a nod to the “double-spending” accusation that “Cardano never had” a few days ago.

In an earlier post, Hoskinson told “Cardano fans” that the event would be full of important announcements:

Cardano Fans, you’re really going to want to tune in to March’s Cardano 360 Episode. It’s going to be action-packed!

Agenda for Cardano 360

Led by IOHK’s Director of Marketing and Communications, Tim Harrison, and Aparna Jue, Product Director at IOHK, Cardano 360 is a monthly event where they give news on the development of the ecosystem.

Bring yer own cushion and don’t worry. If you can’t stick around, we’ll be dicing and slicing it and serving it up throughout next week in bite-size chunks.

In the comments section, the majority of the community asked for more news on the deployment of Alonso and Plutus. Harrison also announced the conclusion of his segment for the event, and stated: “that there will be lots coming down the line”. He also confirmed that there will be updates on Cardano’s DeFi capabilities.

The event will start at 17:30 UTC, Input-Output Global further confirmed that partners, team members, and the community will participate. In addition, it is expected that there will be an update on everything that has happened since the deployment of Hard Fork Combinator “Mary”.

ADA’s price is showing losses of 1.8% on the last day chart. In the last month, Cardano’s native cryptocurrency only registers gains of 1.6%, showing little reaction to its Coinbase listing and the hype of the event happening tomorrow.

Why these analysts predict a Bitcoin’s price at $80,000 by April?

With Bitcoin’s price barely holding above its support level, indicators are turning more bullish. After this period of sideways movement, BTC could be poised for a big upside move soon.

Glassnode co-founders Yann Allemann and Jan Happel have shared data from the firm that points to a high appreciation in BTC price. This is due to the expiration of $6 billion in options contracts set to mature this Friday. Allemann and Happel stated:

Bitcoin price expectations for April are high with lots of investors placing their new bets on $80k.

Bitcoin BTC
Source: Glassnode

As the image above shows, a large portion of investors on Deribit’s platform are confident that the cryptocurrency’s price will settle at those levels. Similarly, there is also a high volume of calls for a Bitcoin price at $120,000 for the same date, April 30th.

Does Elon Musk influence Bitcoin’s price?

In support of the bull case, Glassnode’s Reserve Risk metrics indicate “strong long-term holder conviction” in the current price. The firm stated in a recent report, pointing at big support for BTC’s to take a big jump:

The current risk/reward ratio to invest and hodl is still attractive compared to previous $BTC cycle tops. Current level: 0.008, Precious tops: > 0.02

Earlier, Tesla’s CEO Elon Musk announced that his company began accepting payments in BTC. The entrepreneur made two additional major disclosures: the company runs its own Bitcoin nodes, profits will be held in Bitcoin. Musk stated:

Tesla is using only internal & open-source software & operates Bitcoin nodes directly. Bitcoin paid to Tesla will be retained as Bitcoin, not converted to fiat currency.

Analyst William Clemente believes Musk’s announcement strategically coincides with the $6 billion of options set to expire in a few days. Clemente believes that many investors will see their contracts expire worthlessly and on platforms that back their options with physical Bitcoin, bearish investors could buy more BTC “to cover their losses.” Clemente added:

It is worth mentioning that some of these puts are just hedging downside risk, more so referring to positions solely on the short end of the trade that don’t get rolled over.

Bitcoin price is at $56,904 with slight gains of 1.4% in the last day. On the 7-day chart, the cryptocurrency shows losses of 1.4%. The market capitalization stands at $1.4 trillion.

Bitcoin with slight gains in the 24-hour chart. Source: BTCUSD Tradingview

TA: Why Bitcoin Price Remains At Risk of More Losses Below $53K

Bitcoin price failed to correct above the $55,750 zone against the US Dollar. BTC is showing bearish signs and it remains at a risk of more losses below $54,000.

  • Bitcoin failed to correct higher and it struggled to settle above $55,500.
  • The price is now trading well below $55,500 and the 100 hourly simple moving average.
  • There is a key bearish trend line forming with resistance near $56,000 on the hourly chart of the BTC/USD pair (data feed from Kraken).
  • The pair is likely to decline heavily if it fails to stay above $54,000 and $53,750.

Bitcoin Price Signaling Bearish Signs

Yesterday, we saw a crucial decline in bitcoin below the $55,500 support zone. BTC even broke the $54,000 level before starting an upside correction.

There was a recovery above the $55,000 resistance. The price even climbed above $55,500, but there was no follow up move. A high was formed near $55,757 before the price declined again. It broke the $55,000 support zone.

It is now trading well below $55,500 and the 100 hourly simple moving average. There is also a key bearish trend line forming with resistance near $56,000 on the hourly chart of the BTC/USD pair.

Bitcoin Price

Source: BTCUSD on TradingView.com

An initial resistance on the upside is near the $54,650 level. It is near the 50% Fib retracement level of the recent drop from the $55,757 high to $53,504 low. The first major resistance is near the $54,850 and $55,000 levels.

The 61.8% Fib retracement level of the recent drop from the $55,757 high to $53,504 low is also near $54,850. To start a steady recovery, the price must settle above $55,000 and $55,500. The next major resistance for the bulls could be near the $57,000 region.

More Losses in BTC?

If bitcoin fails to correct higher above $55,000 and $55,500, there are chances of more downsides in the near term. An initial support is near the $54,000 level.

The key support is now near the $53,150 level, below which the bears might aim a test of the $50,000 support zone in the near term.

Technical indicators:

Hourly MACD – The MACD is now gaining momentum in the bearish zone.

Hourly RSI (Relative Strength Index) – The RSI for BTC/USD is now well below the 50 level.

Major Support Levels – $53,000, followed by $51,750.

Major Resistance Levels – $54,850, $55,000 and $55,500.

Five Signs Litecoin Has Bottomed, Next In Line For New ATH

Litecoin during the last cycle was as popular and hyped as other top cryptocurrencies Bitcoin and Ethereum. This time around, however, the coin called digital silver isn’t performing anywhere nearly as well as its digital gold counterpart or even other altcoins.

Whatever has been causing the lag behind the rest of the market, there are several signs that the altcoin has bottomed and is the next cryptocurrency in line to set a new all-time high.

Five Technical Signs That Point To A Bullish Litecoin Revival

This bull market has been dominated primarily by Bitcoin, Ethereum, and innovative new blockchain-based technologies like DeFi and NFTs.

Among the year’s top performers, nowhere to be found on that list would be Litecoin – an altcoin that during the last bull market rose as furiously as Bitcoin, and peaked weeks ahead of Ethereum.

Related Reading | Digital Silver: Why Litecoin Is Poised To Bounce Versus Bitcoin

During this cycle, Litecoin is lagging well behind these other top ten assets with serious longevity. Although Litecoin has maintained its position within the top ten, it is finally at risk of falling out of it and is currently ranked in ninth place overall.

But before that could happen, the altcoin could finally see a strong bounce according to several technicals.

ltcusd Adam and Eve bottom

A textbook example of an Adam and Eve bottom formation | Source: LTCUSD on TradingView.com

First and foremost, on the rarely used six-week timeframe on LTCUSD the trading pair, Litecoin has completed one of the technically cleanest Adam and Eve bottom formations in crypto.

The projected target based on the measure rule should send Litecoin to nearly double its previous all-time high within weeks once things do turn around.

ltcbtc td 13

A TD 13 typically suggests a trend is reaching the maximum point of exhaustion | Source: LTCBTC on TradingView.com

Switching to the LTCBTC trading pair, quarterly timeframes are signaling that the brutal downtrend could be completely exhausted with a TD 13 and a sweep of former lows.

Related Reading | Altcoin Season 2021: Why Litecoin Could Teleport Like Dogecoin Did

A quarterly candle has never traded below the current level, making a reversal at this zone all the more likely.

Did you know? RSI can also act as support and resistance for price action | Source: LTCBTC on TradingView.com

On monthly timeframes, the altcoin has been trading against Bitcoin in a falling wedge pattern, and after four years of a bear market, finally touched down on RSI support.

At the same time, Litecoin has fallen to support dating back to the 2017 bottom, just before the altcoin began its extended, four-year descent against the top cryptocurrency.

Is this the bullish signal Litecoin bag holders have been waiting for? | Source: LTCBTC on TradingView.com

Zoomed in further to weekly timeframes, a bullish divergence on the Relative Strength Index has been building since around mid-2020.

If the bullish divergence fails, Litecoin will set new lows against Bitcoin. If confirmed, the reversal should begin well into 2021 before the total cryptocurrency market tops out once again.

litecoin versus bitcoin ethereum Litecoin is severely lagging behind Ethereum and Bitcoin | Source: LTCUSD on TradingView.com

The fact that Litecoin remains so far behind Bitcoin and Ethereum, despite reaching its all-time high before the other two during the last cycle, could indicate that the peak of the crypto market is nowhere near.

Related Reading | This Litecoin Fractal Says Time Is Running Out To Accumulate At Low Prices

When Litecoin does break out against Bitcoin, it is historically one of the largest and most profitable plays in crypto. But as price action has recently shown, history doesn’t always repeat.

When will Litecoin finally shine again?

Featured image from Deposit Photos, Charts from TradingView.com

Bitcoin miners stop selling, why it is bullish for BTC?

Bitcoin is wobbling in a critical support zone. New indicators are bullish and point to a continuation in the rally.

Moskovski Capital CIO Lex Moskovski shared data from Glassnode showing that a trend in Bitcoin miners has reversed. Since the beginning of March, this sector began to increase its level of Bitcoin sales.

According to the chart shown by Moskovski, when miners’ BTC selling levels have risen, Bitcoin has moved sideways. The December 28 rally was preceded by high BTC buying by this sector. Although buying levels still remain low, Moskovski said:

Miners have stopped selling and began accumulating once again, on average. It seems they expect the price to go higher.

Bitcoin supply on exchanges continues to decrease

A change in miner sentiment coincides with an increase in the amount of Bitcoin that has left exchanges. Moskovski also records 9,077 BTC pulled from Coinbase’s platform. Analyst Willy Woo believes that institutions are responsible for the outflow of BTC from exchanges:

coins being scooped off exchanges (it’s mainly Coinbase, meaning a US entity, and at the scale of the withdrawal it’s likely an institutional yet to be announced buyer). (…) coins moving to strong hands with minimal history of selling.

Adding that Bitcoin traders shorting BTC have gone “cray-cray”. In support of the above, Glassnode records a decline in BTC supply on exchanges, analyst William Clemente said:

This is what absolute scarcity looks like. It doesn’t take a genius to see what’s happening. Supply/Demand 101.

The above events coincide with an estimated $6 billion in Bitcoin options to be expired on Friday. With a high accumulation on Deribit’s platform, the Chicago Mercantile Exchange, and FTX, among others. The last time $4 billion of Bitcoin options expired, the price of the cryptocurrency rose by 80%.

In the long term, the macroeconomic outlook still favors the cryptocurrency with a possible issuance of $3 trillion in debt by the U.S. Government. On miners activity MicroStrategy CEO Michael Saylor stated:

It is rational for publicly traded Bitcoin miners to become net purchasers of BTC rather than sellers.

Bitcoin trades at $54,747 with slight gains in the last day of 0.2%. On the 7-day chart, BTC records losses of 2.0% and 3.0% in the last month.

Bitcoin BTC
Bitcoin showing slight gains in the 24-hour chart. Source: BTCUSD Tradingview

Bitcoin Technicals Overheated, But Bullish Fundamentals Remain Unfazed

Bitcoin price is currently reeling due to a series of rejections above $60,000. After such a powerful impulse upward, technicals are severely overheated and beginning to turn down.

But regardless of any technical-driven selloff that might result, such continued bullish fundamentals in the leading cryptocurrency by market cap could keep prices from going too low, and rebounding quickly even if they do.

Bearish Bitcoin Technicals Hint At First Serious Correction Ahead

After six full months of green candles and growth of nearly $10,000 per month during that bullish stretch, the top cryptocurrency is finally starting to pull back from record highs.

With the critical quarterly close just a week away, Bitcoin would need to pump by more than $30,000 to avoid the first ever bearish divergence. Most timeframes below it down to the weekly, are also starting to signal a downturn ahead.

bitcoin bearish technicals

Several technical indicators suggest that Bitcoin should see a correction ahead | Source: BTCUSD on TradingView.com

The MACD – a momentum measuring indicator has flipped bearish for the first time in months, while the Stochastic indicator is running out of room within an ascending trendline after spending all of 2021 so far in zone that leaves the cryptocurrency exposed to the risk of a reversal.

Related Reading | Coinbase Bitcoin Outflows Are The Strongest Bullish Signal “Ever”

The weekly Relative Strength Index also lost the uptrend line, and has since confirmed it as resistance, matching the pattern from the 2019 peak.

This is just the tip of the iceberg in terms of bearish signals, but fundamentals are here to save the day.

Why Fundamentals Will Keep The Crypto Bull Market Running Strong

There’s no denying that by most technical indicator’s standards, things should be bearish for Bitcoin and could be in terms of price action in the near term. However, fundamentals are simply so strong, that even this heated of technical signals won’t stay that way very long with a decent reset in price action.

Any corrections in Bitcoin are likely to be bought up extremely fast due to the ongoing secular shift, and limited supply.

BTC reserves

On-chain metrics show BTC reserves remain low, and fundamentals are healthy | Source: glassnode

The amount of BTC held on exchanges continues to diminish, with more than ten thousand of what little coins remain leaving Coinbase at a weekly rate.

There’s already a supply shock due to the cryptocurrency’s halving last year, and the sudden demand from institutions and corporations with deep wallets.

bitcoin hodl waves

Holders have very little interest in selling at current levels. Will it pay off? | Source: glassnode

Bitcoin investors during this cycle, have mostly been unwilling to sell and haven’t reached the peaks that are reminiscent of past bull market tops.

Bitcoin miners have also reduced the sell pressure they were putting on the market, leaving only large sized whales left to help push overheated technicals along.

Related Reading | Bullish Bitcoin Miners Cease Selling For The First Time Since 2020

These whales have indeed been selling, causing one of the largest reductions in wallets of whale size historically. With big sellers who bought coins long ago finally gone, all that’s left are an incoming wave of whales, ready to buy what’s available of the dwindling supply.

This could indicate, that any deeper selloff will be swift, violent, but lead back to higher prices ultimately, thanks to just how bullish Bitcoin fundamentals are.

Featured image from Deposit Photos, Charts from TradingView.com