Bitcoin price extended its decline below the $50,000 support against the US Dollar. BTC is now consolidating losses and it remains at a risk of more downside below $48,000.
- Bitcoin declined heavily below the $52,000 and $50,000 support levels.
- The price is now trading well below $52,000 and the 100 simple moving average (4-hours).
- There is a key bearish trend line forming with resistance near $52,800 on the 4-hours chart of the BTC/USD pair (data feed from Kraken).
- The pair could correct losses, but it might face resistance near $52,000 and $52,500.
Bitcoin Price Turns Red
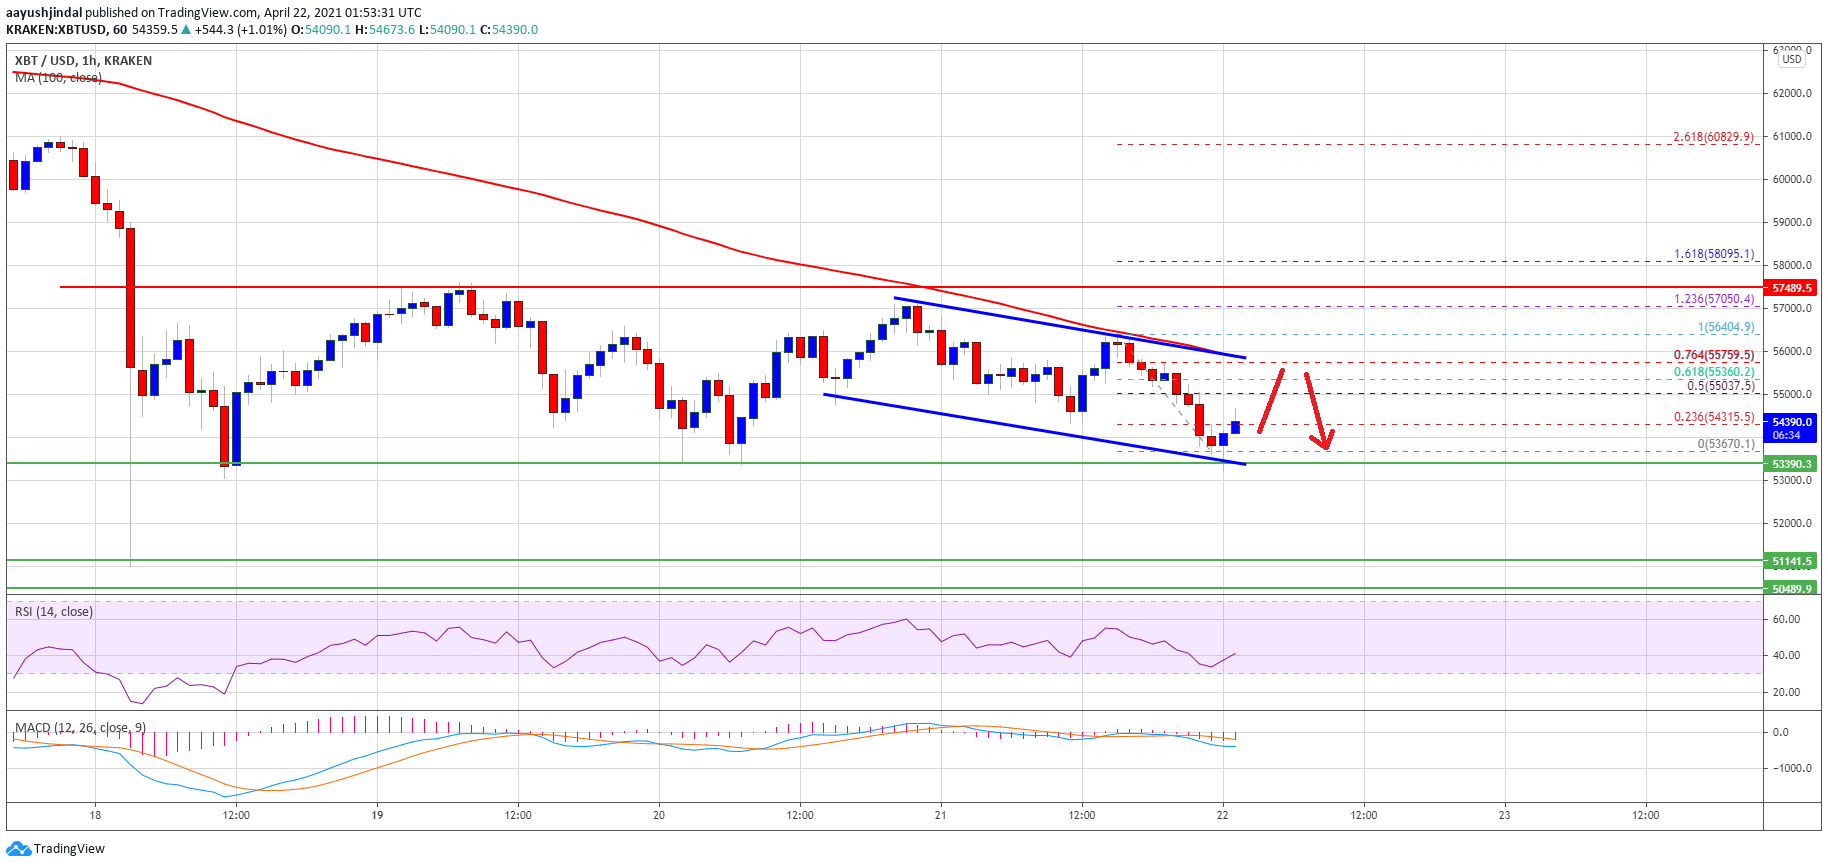
This past week, bitcoin price saw a steady decline from well above $60,000 against the US Dollar. The BTC/USD pair broke many important supports near $55,000 and $52,500 to move into a bearish zone.
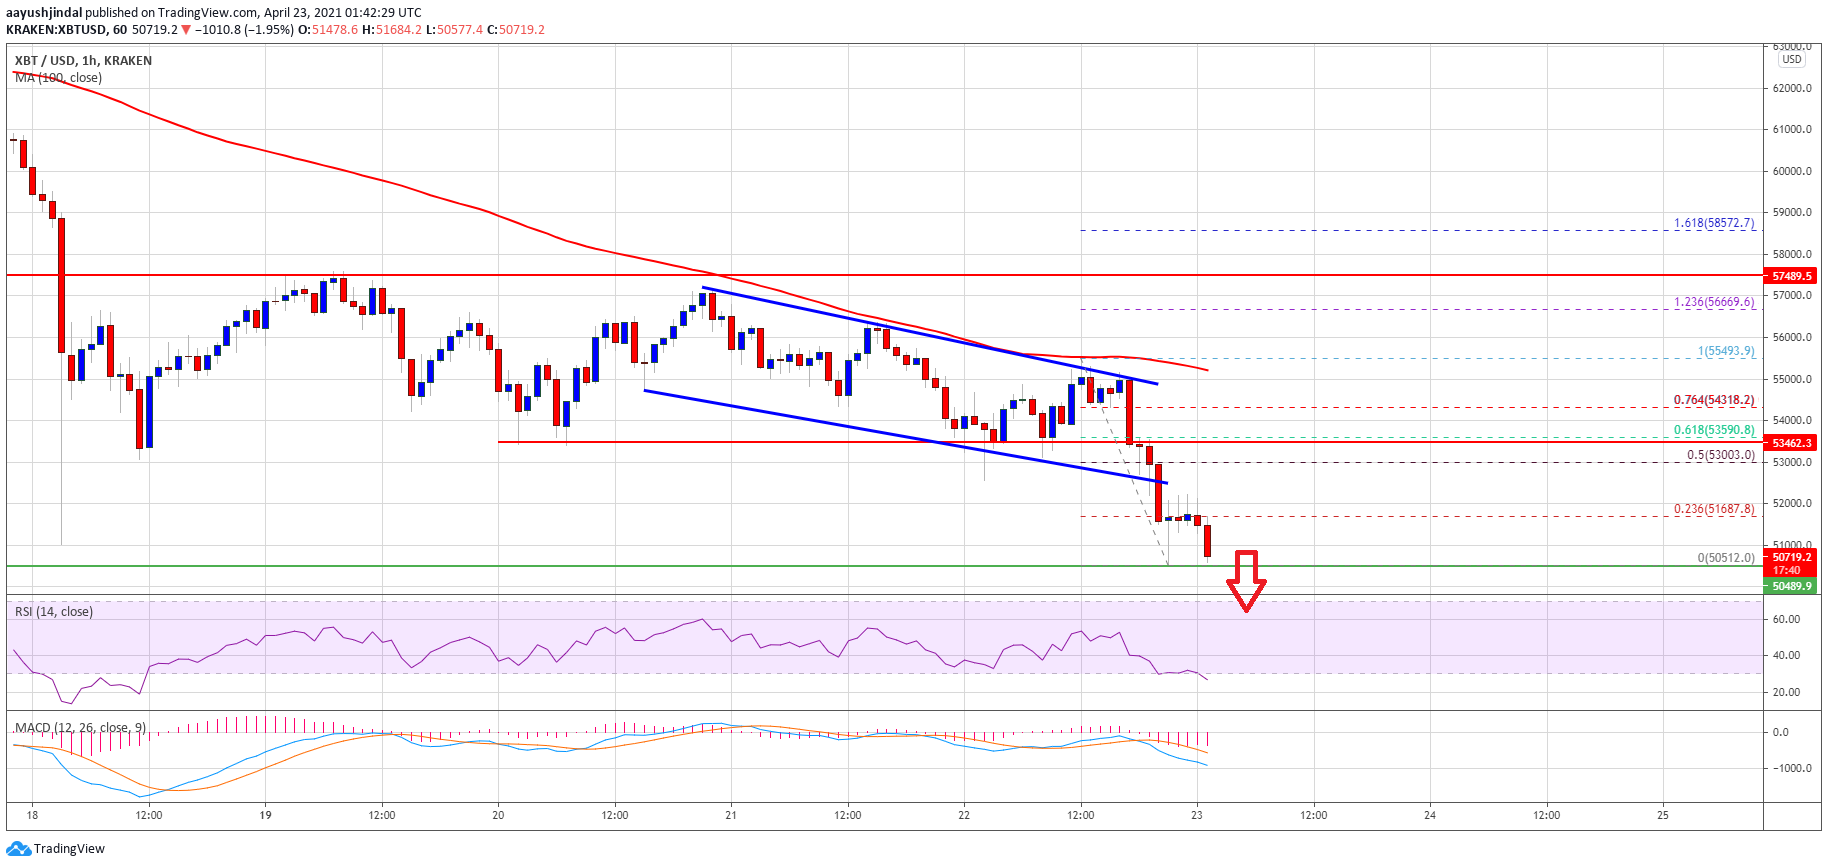
The price even broke the $50,000 level and it settled below the 100 simple moving average (4-hours). It traded to a new weekly low at $47,511 before it started consolidating losses. There was a minor recovery above the $48,000 and $48,500 levels.
There was a recovery above the 23.6% Fib retracement level of the recent decline from the $57,597 high to $47,511 low. It is now consolidating near the $50,000 level.
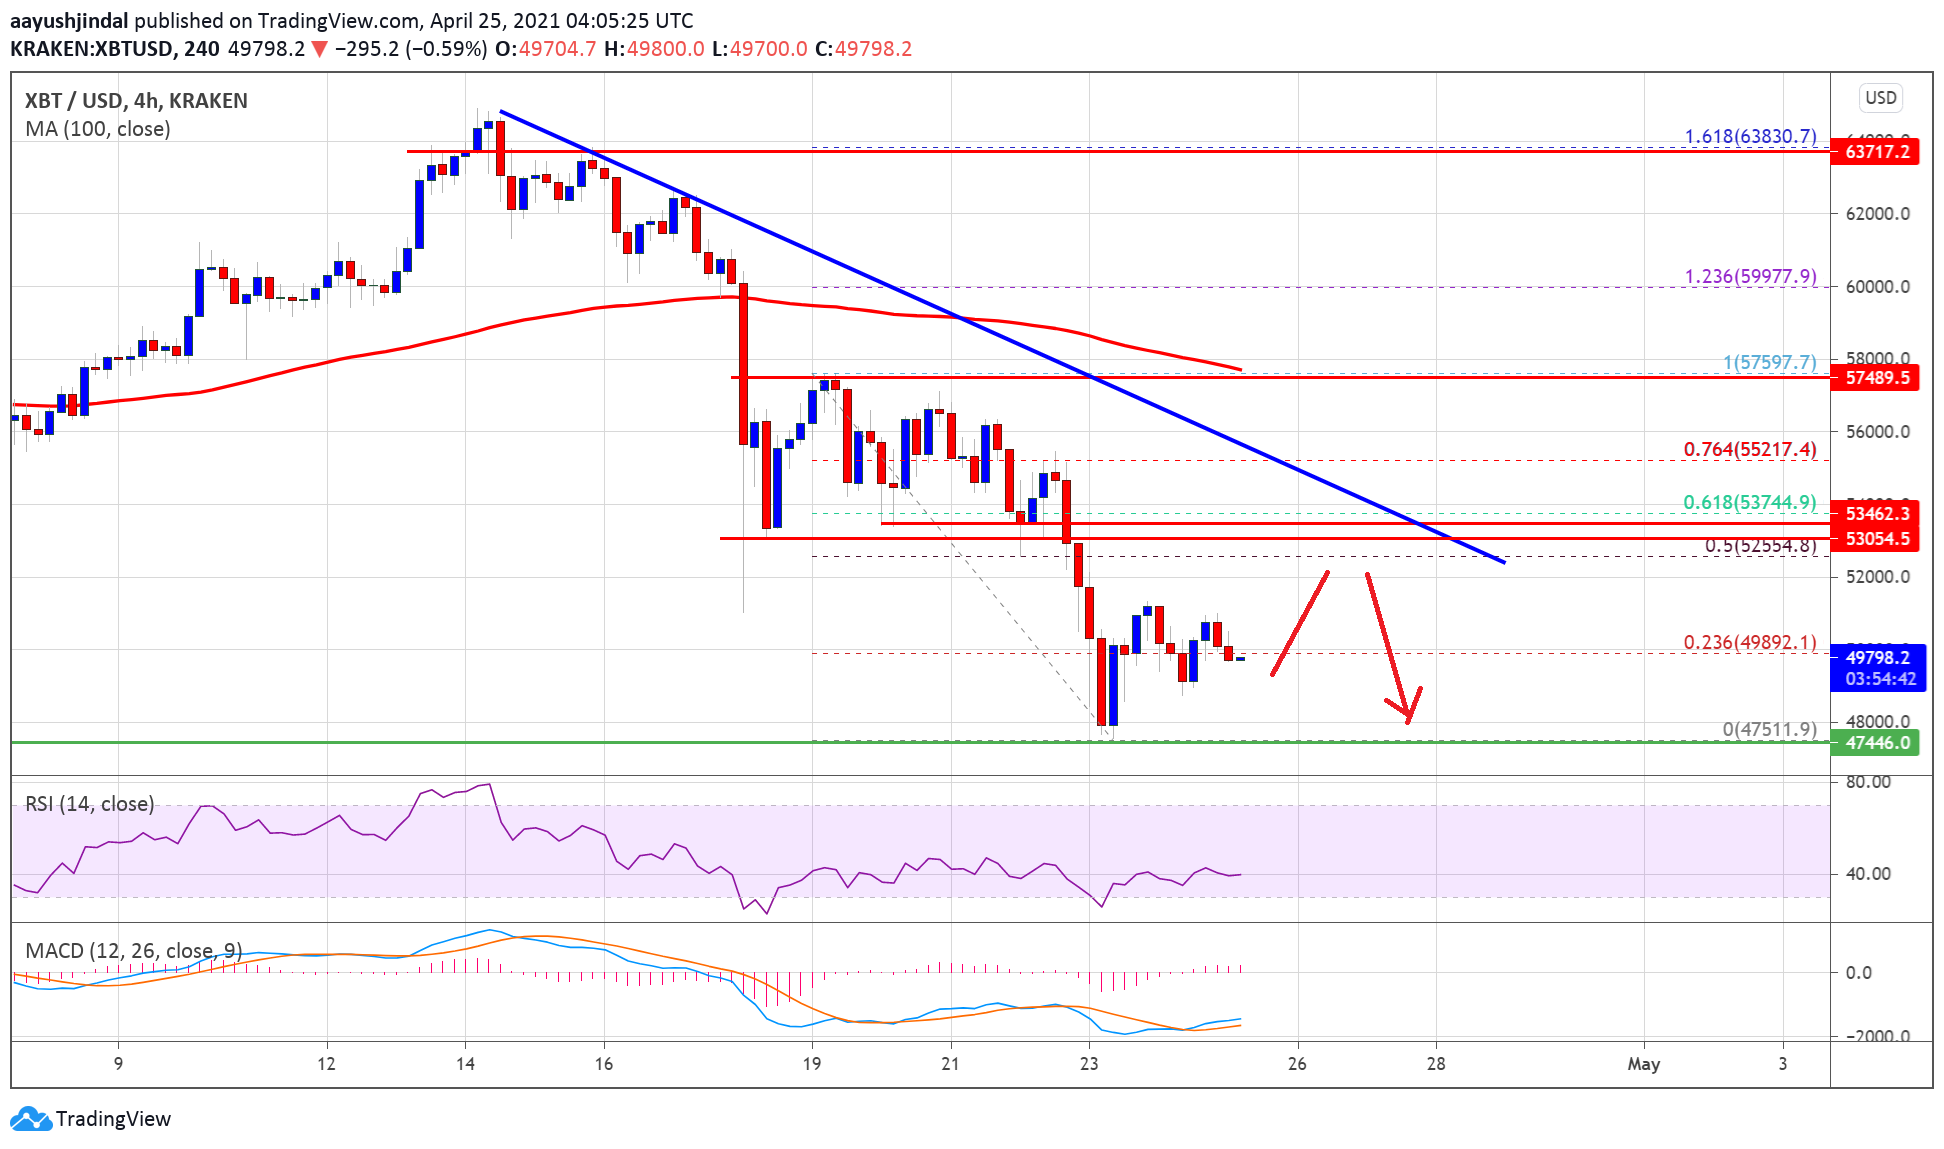
Source: BTCUSD on TradingView.com
On the upside, the price is facing a major resistance near the $52,000 and $52,500 levels. There is also a key bearish trend line forming with resistance near $52,800 on the 4-hours chart of the BTC/USD pair. The trend line is close to the 50% Fib retracement level of the recent decline from the $57,597 high to $47,511 low.
A successful close above the $52,000 and $52,500 resistance levels could open the doors for a fresh increase in the coming sessions.
More Losses in BTC?
If bitcoin fails above the $52,000 level, there is a risk of more losses. The first major support is near the $48,200 and $58,000 levels.
The next major support is near the $57,500 level. Any more losses might call for a fresh drop towards the $46,000 support level. In the stated case, there are even chances of a drop towards the key $45,000 support zone in the near term.
Technical indicators
4 hours MACD – The MACD for BTC/USD is losing momentum in the bearish zone.
4 hours RSI (Relative Strength Index) – The RSI for BTC/USD is now well below the 50 level.
Major Support Level – $47,500
Major Resistance Level – $52,500