Render (RNDR), the cloud-based rendering network, is stirring excitement in the crypto market with technical indicators and analyst predictions hinting at a substantial price surge in the coming weeks or months.
Render Breaks Free From Technical Chains
Technical analysis paints a bullish picture for RNDR. The token has recently broken out of a bullish technical pattern known as the Dragon Pattern, also referred to as the supply line. This breakout historically signifies a potential shift in momentum, with prices likely to trend upwards.
Adding fuel to the fire, analysts are observing the formation of Three Rising Valleys on RNDR’s chart. This pattern suggests a potential market bottom has been established, indicating a reversal from previous downward trends.
Furthermore, a bullish divergence on the four-hour chart hints at weakening selling pressure. In simpler terms, sellers are struggling to push prices down, failing to break below previous lows.
$RENDER – It’s looking bullish in my opinion.
Here is why
• Dragon pattern aka the supply line which broke out already.
• Potential 3 rising valleys in the making while we established a potential bottom.
• 4 hour bullish divergence which means that sellers had a hard… pic.twitter.com/jMBzXWyG81
— Doji
(@SatsDoji) April 25, 2024

DoJi, a prominent crypto analyst, sees these technical indicators as a recipe for a price surge. Based on his analysis of the Three Rising Valleys, DoJi has set a price target of around $13 for RNDR. He even goes as far as suggesting a price explosion beyond $20 if historical price movements repeat themselves.
According to DoJi, surpassing a key resistance level of $9.20 could be the catalyst that ignites this bullish momentum.
RNDR Up 250% In 6 Months – But Can It Break Resistance?
In the previous half-year, RNDR’s value rose by an astounding 250%. The pattern of impulsive and corrective moves in the price fluctuation points to a turbulent market.
Forecasting the price trajectory of RNDR in the future offers both cautious and optimistic options. There is expected to be resistance at $10.90 and a larger barrier at $13.30.
If the price drops, $6.18 or even lower, $3.79, may provide support. RNDR network adoption rate and general market trends could drive price fluctuations, but long-term indications like the 100-day average point to a possible stabilization around $8.92.
Analyst Chimes In With Optimistic Predictions
Meanwhile, DoJi isn’t the only crypto expert bullish on RNDR. Inspector Crypto, another well-respected analyst, has identified a bullish Inverse Head and Shoulders Pattern on RNDR’s chart. This pattern typically precedes a price increase, and Inspector Crypto has projected a target range of $14-$16 for RNDR based on this pattern.
$RNDR | Inverse Head and Shoulders pattern target: $14-$16#RENDER #Solana #Bitcoin #AltCoinSeason2024 #Bullrun2024 #ADA #Xrp #AKT pic.twitter.com/VRO8gcTAiH
— Inspector Crypto
(@1nspector_G) April 26, 2024

The combined optimism from DoJi and Inspector Crypto reflects a broader sentiment of anticipation surrounding RNDR. While the token has experienced a slight dip in price recently, many analysts are closely monitoring its performance, waiting for the upswing signal.
Featured image from Pexels, chart from TradingView

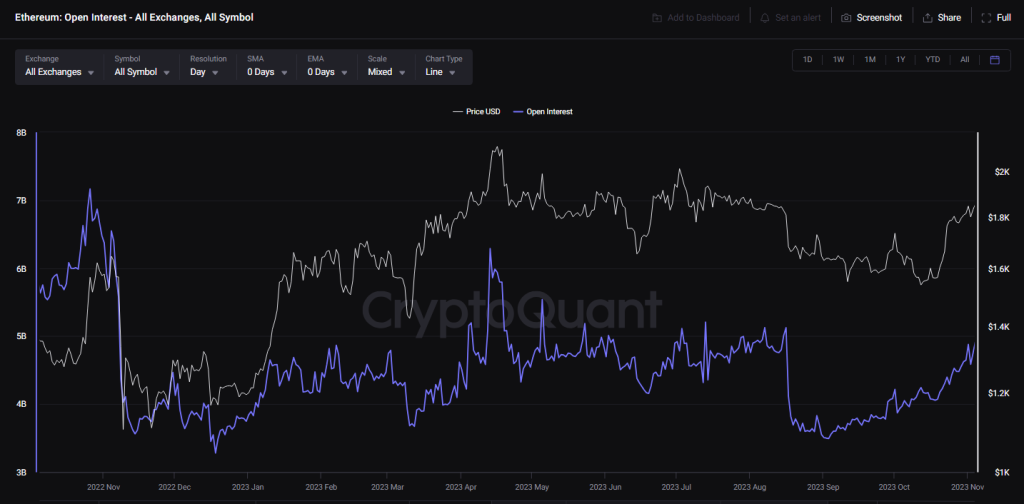
 Blue Section: The current trajectory suggests a possible reach of $1.4 by June-July, a key target. The price range between ($1.2 – $1.8) is a plausible target.
 Yellow Section: Aiming for $4 is feasible if we follow a similar path to 2021.…
 1/ SHIBARMY, we are on the brink of a transformative upgrade for Shibarium.


 The price of
  Crypto (@MikybullCrypto)
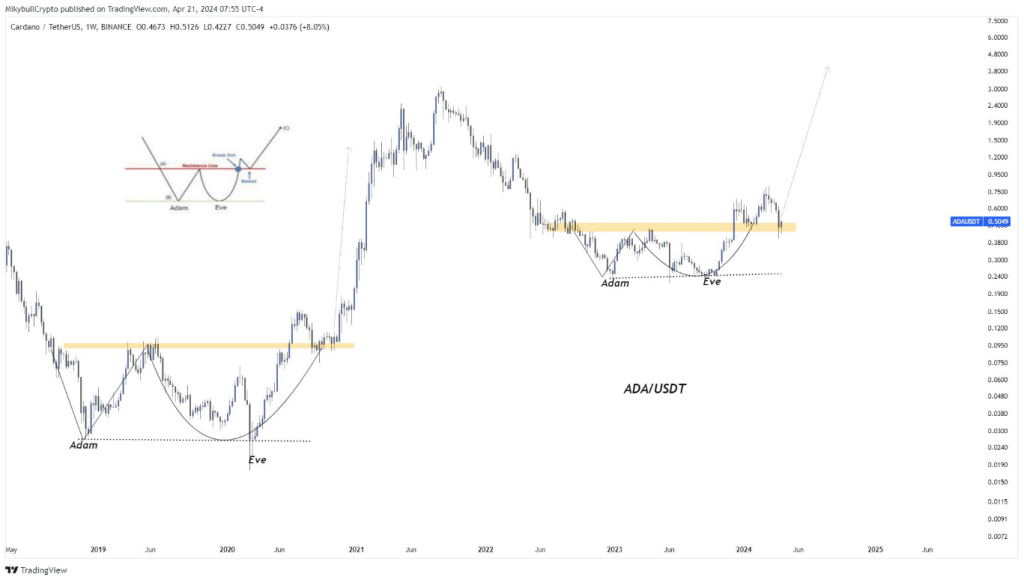


