Ethereum Withdrawals From Exchanges Top 260,000 ETH – What This Means For Price

Ethereum withdraws from centralized exchanges have ramped up over the last week, suggesting a direction for investor sentiment during this time. Given the sheer volume of ETH withdrawn from these exchanges, it is prudent to try to understand what this could mean for the crypto’s price.

260,000 ETH Leaves Exchanges

Amid the uncertainty that has plagued the crypto market, Ethereum investors are making moves to secure their positions for better price prospects. Pseudonymous crypto technical analyst Titan of Crypto took to X (formerly Twitter) to share what Ethereum investors are doing about their holdings right.

Related Reading: Bitcoin Bears Risk Losing $7.2 Billion If BTC Price Reaches This Level

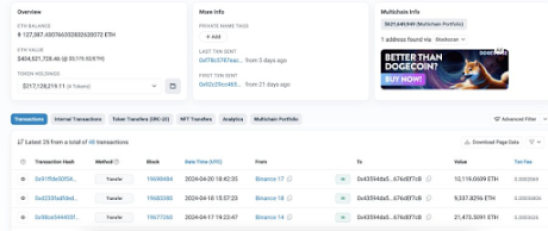
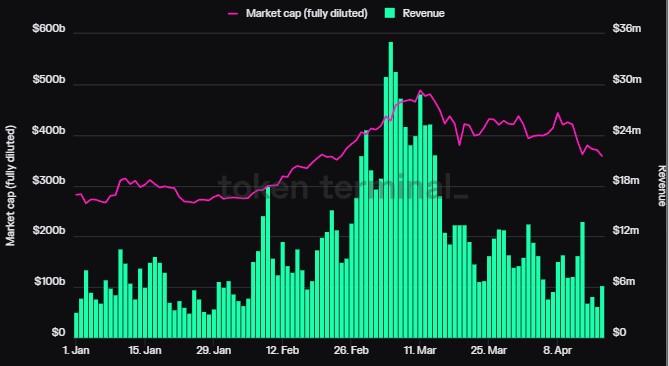
The post revealed that these investors have been withdrawing large amounts of ETH from centralized exchanges. In the one week period that was tracked, the report found that a total of 260,000 ETH were withdrawn from exchanges, which was worth almost $800 million at the time.

Now, exchange deposits and withdrawals are important for any cryptocurrency because it can often tell how investors are looking at that coin and what they are doing with their holdings. In the case of large deposits to centralized exchanges, it can be very bearish for the price because investors often deposit their coins in order to sell them as exchanges provide deep liquidity.

In contrast, withdrawals from exchanges suggest that investors are not looking to sell their ETH. Rather, they are accumulating the coins to wait for better prices before selling. Naturally, this is bullish for the Ethereum price as a diminished selling pressure gives room for the price to recover.

In this case, the withdrawals are bullish or the Ethereum price, as investors continue to accumulate. It also signals that investors are expecting a price breakout, and as the withdrawals ramp up, demand could surpass supply, leading to a surge in price.

Ethereum Headwinds Still Negative

Ethereum, while currently seeing some positive activity from investors, has still not turned completely bullish. For one, there has been a significant decline in its daily trading volume. According to data from Coinmarketcap, Ethereum’s trading volume is down approximately 20% in the last day.

This decline in volume suggests a declining interest from investors to actually trade the coin. As such, its price may be negatively affected as attention begins to shift elsewhere, with investors looking for better prospects.

Nevertheless, the cryptocurrency still looks bullish for the long term. Ethereum continues to closely mirror the price performance of Bitcoin, which is expected to go on a bull run following the successful completion of its fourth halving event.

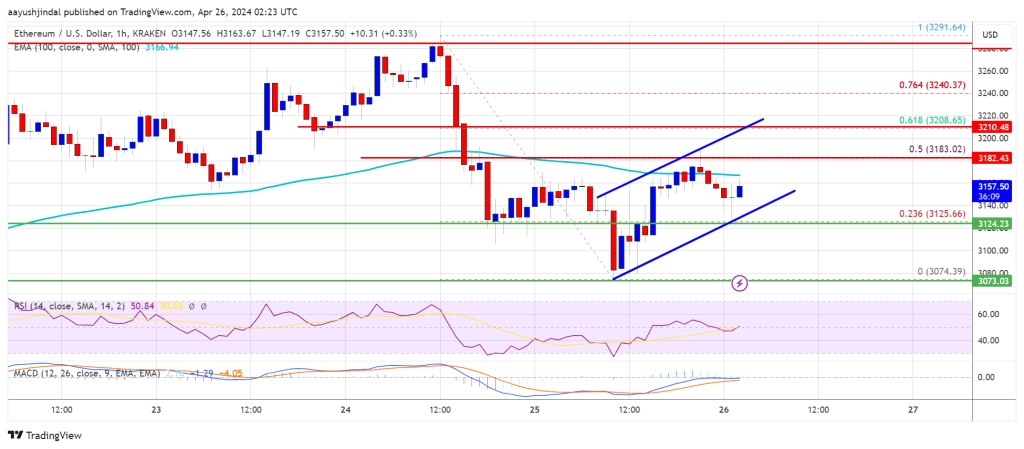
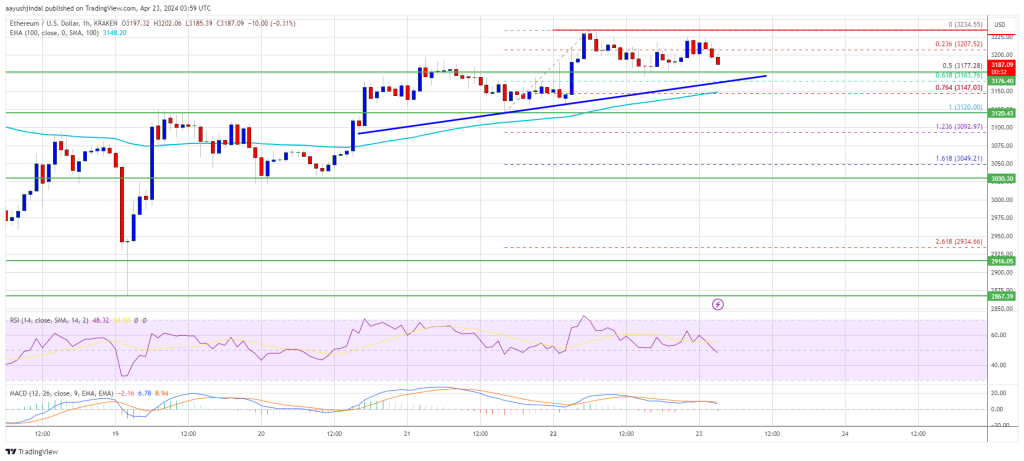
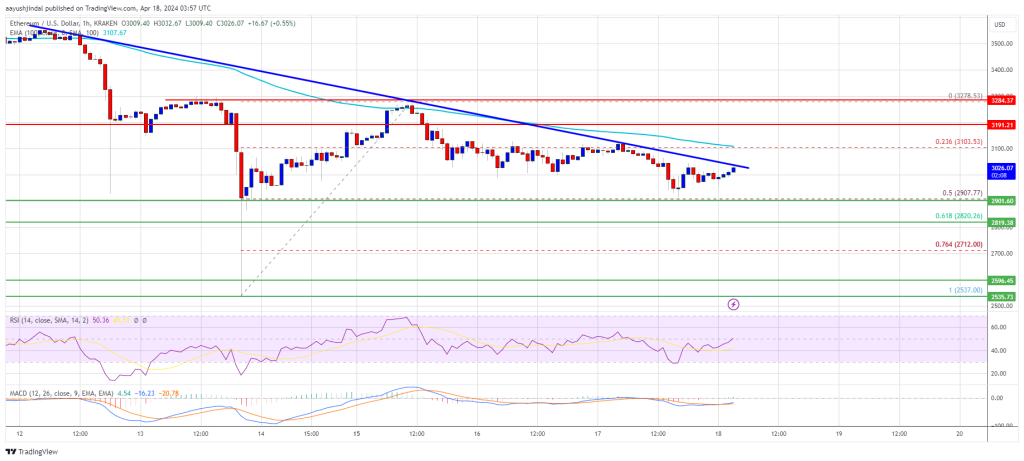
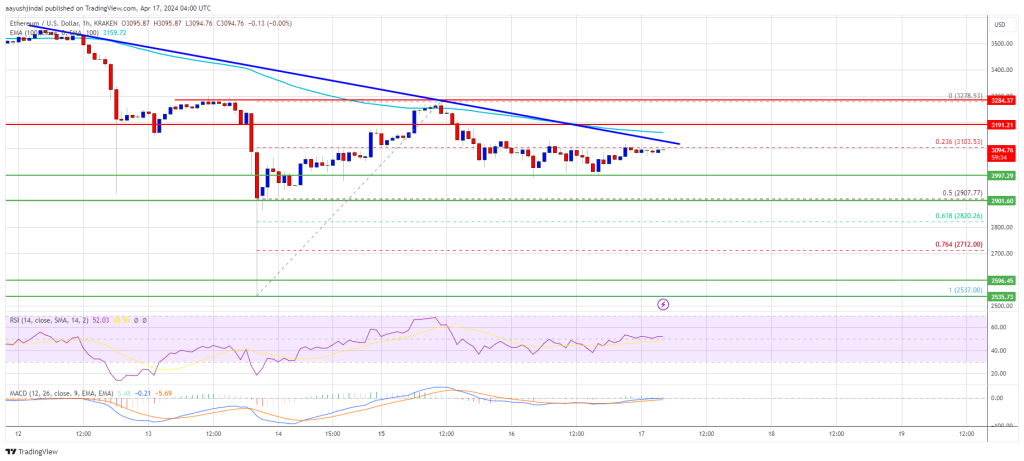
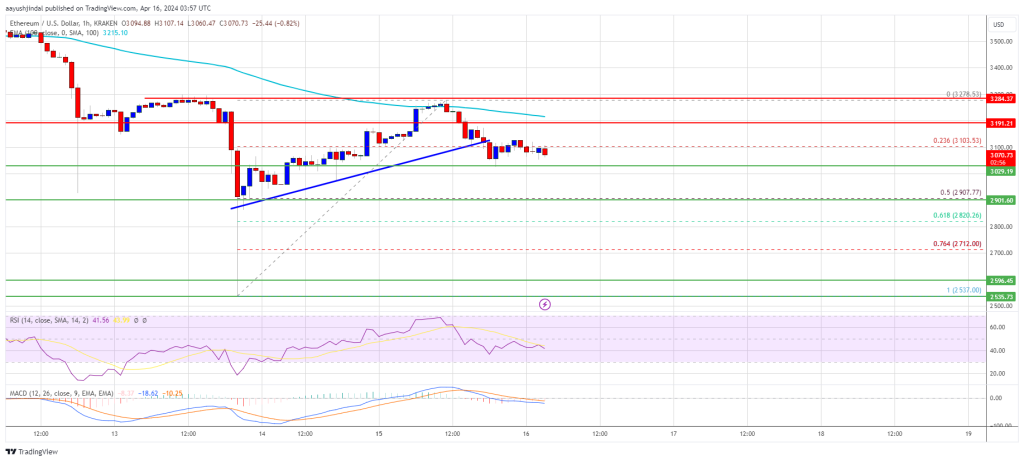
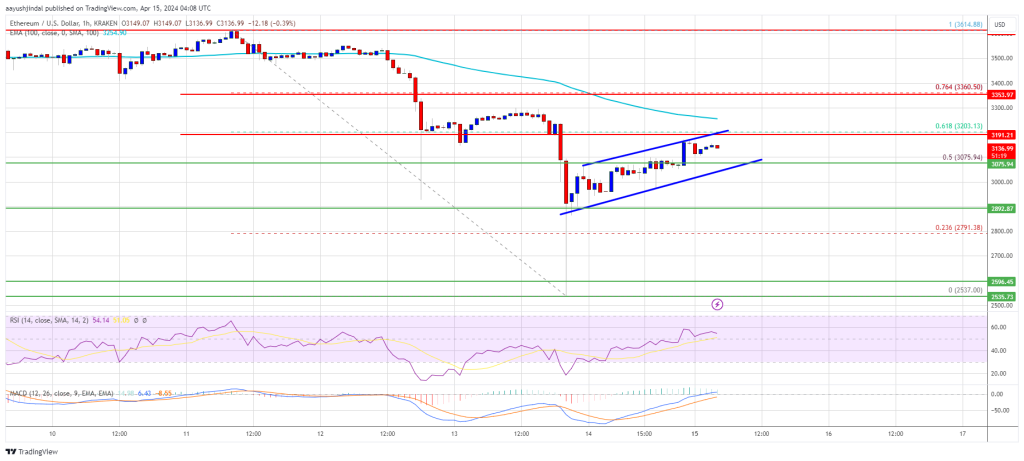
For now, Ethereum continues to struggle to hold above $3,100 with small gains of 0.18% in the last day. Over the last month, it has suffered multiple crashes, registering a 12.36% loss in the last 30 days.

Ethereum price chart from Tradingview.com

Ethereum Price Faces Crucial Test: Will $3,200 Withstand The Pressure?

Ethereum price is attempting a recovery wave above the $3,125 zone. ETH must clear the $3,200 resistance to continue higher in the near term.

  • Ethereum extended losses and tested the $3,075 support zone.
  • The price is trading below $3,180 and the 100-hourly Simple Moving Average.
  • There is a key rising channel forming with support at $3,140 on the hourly chart of ETH/USD (data feed via Kraken).
  • The pair could continue to move down if it trades below the $3,125 support.

Ethereum Price Faces Resistance

Ethereum price struggled to recover and extended losses below the $3,100 level. ETH traded as low as $3,074 and is currently attempting another recovery wave, like Bitcoin.

There was a minor increase above the $3,125 resistance. The price climbed above the 23.6% Fib retracement level of the recent drop from the $3,292 swing high to the $3,074 low. However, the bears are active near the $3,200 resistance zone.

Ethereum is now trading below $3,180 and the 100-hourly Simple Moving Average. There is also a key rising channel forming with support at $3,140 on the hourly chart of ETH/USD. Immediate resistance is near the $3,180 level and the 100-hourly Simple Moving Average.

The first major resistance is near the $3,200 level or the 61.8% Fib retracement level of the recent drop from the $3,292 swing high to the $3,074 low.

Ethereum Price

Source: ETHUSD on TradingView.com

The next key resistance sits at $3,240, above which the price might gain traction and rise toward the $3,280 level. A close above the $3,280 resistance could send the price toward the $3,350 resistance. If there is a move above the $3,350 resistance, Ethereum could even test the $3,500 resistance. Any more gains could send Ether toward the $3,550 resistance zone.

More Downsides In ETH?

If Ethereum fails to clear the $3,180 resistance, it could continue to move down. Initial support on the downside is near the $3,125 level. The first major support is near the $3,075 zone.

The main support is near the $3,030 level. A clear move below the $3,030 support might set the pace for more losses and send the price toward $2,880. Any more losses might send the price toward the $2,750 level in the near term.

Technical Indicators

Hourly MACDThe MACD for ETH/USD is losing momentum in the bearish zone.

Hourly RSIThe RSI for ETH/USD is now below the 50 level.

Major Support Level – $3,125

Major Resistance Level – $3,200

SEC Anticipated To Reject Spot Ethereum ETFs In Upcoming Decision, ETH Price Takes 5% Hit

Over the past 24 hours, Ethereum (ETH), the second-largest cryptocurrency by market capitalization, has experienced a significant 5% price drop. This drop comes amid growing speculation that the highly anticipated Ethereum ETFs will likely be rejected by the US Securities and Exchange Commission (SEC) in the upcoming May deadline.

US Bitcoin ETF Issuers Brace For SEC’s Expected Denial

According to a recent Reuters report, various US Bitcoin ETF issuers and firms anticipate the SEC’s denial of their applications to launch ETFs tied to the price of ETH. 

These expectations have been fueled by “discouraging meetings” between the applicants and the regulatory agency in recent weeks, as disclosed by four individuals familiar with the matter.

Prominent investment firms such as VanEck, ARK Investment Management, and seven other issuers have submitted filings with the SEC to list ETFs that would track the spot price of Ethereum. 

As the first in line, VanEck’s and ARK’s applications are subject to the SEC’s decisions by May 23 and May 24, respectively.

The sources involved in the meetings between Bitcoin ETF issuers and the SEC have reported that the discussions have been primarily “one-sided,” with agency staff not engaging in substantive details about the proposed products. 

This starkly contrasts the intensive and detailed discussions between issuers and the agency before the SEC’s landmark approval of spot Bitcoin ETFs in January. 

The issuers argued during the meetings that the approval of spot Bitcoin ETFs and Ethereum futures-based ETFs by the SEC in October set a precedent for the spot ETH products. They also made efforts to address potential regulatory concerns. 

Despite their arguments, the report notes that the SEC staff did not clarify specific concerns or engage in meaningful dialogue, further indicating a possible denial of the requests.

Setback For Crypto Industry

If these expectations materialize, it would be a setback for the cryptocurrency industry, which had hoped that the approval of spot Bitcoin ETFs would pave the way for similar products and contribute to the mainstream adoption of cryptocurrencies. 

According to Todd Rosenbluth, head of ETF analysis at data firm VettaFi, the likely delay in approval or rejection until later in 2024 or beyond has left the regulatory landscape uncertain.

While some issuers have expressed their intention to submit additional disclosure paperwork to continue the conversation with the SEC, the overall sentiment indicates a growing belief that the applications will be rejected.

VanEck CEO Jan van Eck has already stated that the company’s application will likely be rejected, while ARK Investment Management has yet to comment.

Rejected Ethereum ETFs Could Spark Potential Court Battles

Several applicants expect the SEC to cite broader issues, such as the nature and depth of statistical data on the underlying ETH market, as reasons for their decision in the event of ETF rejections. 

Matt Hougan, chief investment officer at Bitwise Asset Management, which has filed for a spot in Ethereum ETF, believes that the SEC may require more time to observe Ethereum futures and gather additional data.

Industry insiders further speculate that rejecting Ethereum ETFs could potentially lead to legal action, with one source suggesting that the courts may get involved before Ethereum ETFs eventually become a reality.

The anticipated rejection has already influenced the price of Ethereum, with Hong Fang, president of the crypto exchange OKX, stating that the cryptocurrency is experiencing downward pressure as market participants factor in the likelihood of a negative outcome.

Ethereum ETFs

Currently, ETH is trading at $3,100, further highlighting the cryptocurrency’s persistent downtrend over broader time frames. Over the past fourteen and thirty days, the token has experienced significant declines of 12% and 14%, respectively.

Featured image from Shutterstock, chart from TradingView.com

Ethereum Price Faces Rejection, Is This A Fresh Bearish Signal?

Ethereum price failed to clear the $3,280 resistance zone. ETH declined below the $3,200 support and is now consolidating losses above $3,100.

  • Ethereum struggled to clear the $3,250 and $3,280 resistance levels.
  • The price is trading below $3,200 and the 100-hourly Simple Moving Average.
  • There was a break below a key bullish trend line with support at $3,190 on the hourly chart of ETH/USD (data feed via Kraken).
  • The pair could continue to move down if it trades below the $3,100 support.

Ethereum Price Trims Gains

Ethereum price struggled to clear the $3,250 and $3,280 resistance levels. ETH started a fresh decline and traded below the $3,200 support to enter a short-term bearish zone, like Bitcoin.

Besides, there was a break below a key bullish trend line with support at $3,190 on the hourly chart of ETH/USD. The pair even declined below $3,150 and tested $3,100. A low has formed at $3,105 and the price is now consolidating losses.

Ethereum is now trading below $3,200 and the 100-hourly Simple Moving Average. It is testing the 23.6% Fib retracement level of the recent decline from the $3,291 swing high to the $3,105 low.

Immediate resistance is near the $3,180 level and the 100-hourly Simple Moving Average. The first major resistance is near the $3,200 level or the 50% Fib retracement level of the recent decline from the $3,291 swing high to the $3,105 low.

Ethereum Price

Source: ETHUSD on TradingView.com

The next key resistance sits at $3,220, above which the price might gain traction and rise toward the $3,250 level. A close above the $3,250 resistance could send the price toward the $3,280 resistance. If there is a move above the $3,280 resistance, Ethereum could even test the $3,350 resistance. Any more gains could send Ether toward the $3,500 resistance zone.

More Losses In ETH?

If Ethereum fails to clear the $3,200 resistance, it could continue to move down. Initial support on the downside is near the $3,120 level. The first major support is near the $3,100 zone.

The main support is near the $3,030 level. A clear move below the $3,030 support might increase selling pressure and send the price toward $2,850. Any more losses might send the price toward the $2,650 level in the near term.

Technical Indicators

Hourly MACDThe MACD for ETH/USD is losing momentum in the bearish zone.

Hourly RSIThe RSI for ETH/USD is now below the 50 level.

Major Support Level – $3,100

Major Resistance Level – $3,200

Ethereum Price Holds Support – Why ETH Could Soon Rally 5%

Ethereum price is holding gains above the $3,120 resistance zone. ETH could soon rally if it clears the $3,280 resistance zone.

  • Ethereum extended its increase above the $3,220 resistance zone.
  • The price is trading above $3,165 and the 100-hourly Simple Moving Average.
  • There is a key bullish trend line forming with support at $3,170 on the hourly chart of ETH/USD (data feed via Kraken).
  • The pair could continue to move up if it clears the $3,280 resistance zone.

Ethereum Price Aims Higher

Ethereum price remained in a positive zone above the $3,000 level, like Bitcoin. ETH extended its increase above the $3,150 and $3,165 resistance levels. It even spiked above the $3,250 resistance.

It traded to a new weekly high at $3,263 and recently corrected lower. There was a minor decline below the $3,220 level. Ether dipped below the 50% Fib retracement level of the recent wave from the $3,154 swing low to the $3,263 high.

However, the bulls were active above the $3,200 level. The 61.8% Fib retracement level of the recent wave from the $3,154 swing low to the $3,263 high acted as a support.

Ethereum is now trading above $3,200 and the 100-hourly Simple Moving Average. There is also a key bullish trend line forming with support at $3,170 on the hourly chart of ETH/USD. Immediate resistance is near the $3,250 level. The first major resistance is near the $3,280 level.

Ethereum Price

Source: ETHUSD on TradingView.com

The next key resistance sits at $3,350, above which the price might gain traction and rise toward the $3,500 level. A close above the $3,500 resistance could send the price toward the $3,550 resistance. If there is a move above the $3,550 resistance, Ethereum could even test the $3,750 resistance. Any more gains could send Ether toward the $3,880 resistance zone in the coming days.

Another Drop In ETH?

If Ethereum fails to clear the $3,280 resistance, it could start a downside correction. Initial support on the downside is near the $3,200 level. The first major support is near the $3,180 zone and the trend line.

The main support is near the $3,120 level. A clear move below the $3,120 support might increase selling pressure and send the price toward $3,030. Any more losses might send the price toward the $2,850 level in the near term.

Technical Indicators

Hourly MACDThe MACD for ETH/USD is gaining momentum in the bullish zone.

Hourly RSIThe RSI for ETH/USD is now above the 50 level.

Major Support Level – $3,120

Major Resistance Level – $3,280

Ethereum Resurgence: TRON Founder Justin Sun Goes On 127,388 ETH Buying Spree

The second-largest crypto token by market cap, Ethereum (ETH), looks set to make a massive market recovery following recent buys suspected to be made by Tron’s founder, Justin Sun. Sun’s accumulation spree again highlights crypto whales’ recent bullishness on Ethereum despite fluctuating prices. 

Sun Allegedly Buys $405 Million Worth Of ETH

In an X (formerly Twitter) post, the on-chain analytics platform Lookonchain drew the crypto community’s attention to a mysterious wallet suspected to belong to Justin Sun. This wallet is said to have bought 127,388 ETH ($405.19 million) from Binance and decentralized exchanges (DEXs) since April 8 at an average price of $3,127.  

Ethereum Justin Sun Tron

Meanwhile, Lookonchain tried to prove further its theory that this wallet likely belonged to Justin Sun. The platform alluded to a previous tweet mentioning that a suspected Justin Sun wallet bought 168,369 ETH at $2,894 from Binance and a DEX between February 12 and 24. It noted that the “transaction behavior” of both wallets was similar, which suggests that they are both likely owned by Justin Sun. 

If indeed both wallets are owned by Justin Sun, that means the Tron founder has accumulated 295,757 ETH ($891 million) at an average price of $3,014 since February 12. Like every whale activity, Sun’s alleged transactions have caught the crypto community’s attention, with many wondering why he is gaining so much exposure to the second-largest crypto token. 

Ethereum Whales Are Bullish

Sun’s actions highlighted the bullish sentiment that Ethereum whales have towards the crypto token despite its recent unimpressive price action. Bitcoinist recently reported about an Ethereum whale who, despite already losing $4.5 million, opened another long position on the second-largest crypto token. 

This whale also borrowed 17.3 million USDT just to increase their exposure to the crypto token. In a recent X post, Lookonchain again highlighted how Ethereum whales are still making bullish moves in the market. On-chain data shows a fresh wallet (0x9EB0) that withdrew 7,182 ETH ($23.06 million) from Binance, which suggests long-term holding by this whale. 

Another wallet (0x1958) withdrew 5,181 ETH ($16.28 million) from Binance and put their ETH holdings to work by staking it into Bedrock and Pendle while anticipating further price gains in the crypto token.

Such bullish sentiment towards Ethereum could be good for ETH’s price as whales are known to have a significant impact on a token’s price discovery. It could also prove crucial during this period when Ethereum is experiencing declining network growth, which means that the rate at which new users come into the ecosystem has slowed. 

At the time of writing, Ethereum is trading at around $3,170, down over 1% in the last 24 hours, according to data from CoinMarketCap. 

Ethereum price chart from Tradingview.com (Justin Sun Tron)

Ethereum Price Signals Reversal and $3,400 Is Imminent, Here’s Why

Ethereum price is gaining pace above the $3,120 resistance zone. ETH could continue to move up unless there is a daily close below the $3,030 level.

  • Ethereum extended its increase above the $3,150 resistance zone.
  • The price is trading above $3,150 and the 100-hourly Simple Moving Average.
  • There is a connecting bullish trend line forming with support at $3,160 on the hourly chart of ETH/USD (data feed via Kraken).
  • The pair could continue to move up unless the bears push it below the $3,030 zone.

Ethereum Price Extends Increase

Ethereum price started a recovery wave and was able to clear the $3,000 resistance, like Bitcoin. ETH even climbed above the $3,050 and $3,120 resistance levels to move into a positive zone.

It traded to a new weekly high at $3,234 and is currently consolidating gains. There was a minor decline below the $3,200 level. Ether dipped below the 23.6% Fib retracement level of the recent increase from the $3,120 swing low to the $3,234 high.

Ethereum is now trading above $3,150 and the 100-hourly Simple Moving Average. There is also a connecting bullish trend line forming with support at $3,160 on the hourly chart of ETH/USD. The trend line is close to the 61.8% Fib retracement level of the recent increase from the $3,120 swing low to the $3,234 high.

Immediate resistance is near the $3,210 level. The first major resistance is near the $3,235 level. The next key resistance sits at $3,280, above which the price might gain traction and rise toward the $3,350 level.

Ethereum Price

Source: ETHUSD on TradingView.com

A close above the $3,350 resistance could send the price toward the $3,500 resistance. If there is a move above the $3,500 resistance, Ethereum could even test the $3,550 resistance. Any more gains could send Ether toward the $3,720 resistance zone in the coming days.

Downside Correction In ETH?

If Ethereum fails to clear the $3,235 resistance, it could start a downside correction. Initial support on the downside is near the $3,175 level. The first major support is near the $3,160 zone and the trend line.

The main support is near the $3,150 level and the 100-hourly Simple Moving Average. A clear move below the $3,150 support might increase selling pressure and send the price toward $3,030. Any more losses might send the price toward the $2,850 level in the near term.

Technical Indicators

Hourly MACDThe MACD for ETH/USD is losing momentum in the bullish zone.

Hourly RSIThe RSI for ETH/USD is now below the 50 level.

Major Support Level – $3,150

Major Resistance Level – $3,235

Ethereum Whale Goes On 127,000 ETH Buying Spree, Was It Justin Sun Again?

Reports show that a new Ethereum (ETH) whale has been on a buying spree recently. This whale bought over $405 million worth of ETH since March 31 and is suspected to be Tron founder Justin Sun. Sun is also linked to another address that made massive ETH moves this year.

A New Whale On The Horizon, Is It Justin Sun?

The blockchain research platform Lookonchain revealed that a whale has gone on an Ethereum buying frenzy over the past few weeks. The newly created account started buying ETH from crypto exchanges on March 31.

According to the post, the mysterious wallet first withdrew $96.8 million stablecoins from the crypto exchange Binance. Then, the whale started buying Ethereum from Binance and Decentralized Exchanges (DEX).

From April 8 to April 20, the address bought 127,388 ETH, worth around $405.19 million, at an average price of $3,172 per token. According to the research platform, the activity from this new address is similar to that of the alleged Justin Sun address.

Although the possibility of a coincidence is not ruled out, the activity between the two addressed seems to suggest otherwise. On March 31, the address Sun was suspected of owning made a significant deposit of 787 million USDT to Binance on Tron, which coincided with the withdrawal made by the mysterious new address.

As reported by NewsBTC, Justin Sun’s alleged wallet also went on a similar buying spree from February 12 to February 24. At the time, the address acquired 168,396 ETH, worth around $580.5 million, for an average price of $2,894.

Lookonchain considers that the similarities hint that these addresses are likely owned by Sun. If so, Justin Sun has bought 295,757 ETH, worth $891 million, in the past two months.

Ethereum Price Recovers Amid Whale Accumulation

X users expressed concern over Sun’s alleged movements. At the time of the first report, some considered the transaction suspicious.

One user affirmed that Sun would be “the reason of the next market crash.” Others believe it was time to question whether Sun would dump his ETH bag. However, the possibility of him accumulating for the approval of spot Ethereum exchange-traded funds (ETF) was brought up.

The latest news of Sun’s alleged buying spree received a more positive response. A user considered it a bullish signal for the second-largest cryptocurrency, as the token could benefit from whale accumulation.

On Friday, Ether’s price dipped to $2,865, a level not seen since late February. Over the weekend, however, ETH began to recover from its recent fall as the whale buying spree occurred.

Since then, the “king of altcoins” regained the $3,100 support level, currently trading at $3,192. The recovery represents a 2% increase from its price 24 hours ago and a 1.5% surge in the weekly timeframe.

Moreover, ETH’s daily trading activity has increased by 8.7%, with a daily trading volume of $11.42 billion. Similarly, the second-largest cryptocurrency has seen a 1.78% rise in market capitalization during the last day.

ETH, ETHUSDT, Ethereum

3 Major Metrics To Watch Out For That Can Impact Ethereum Prices

The crypto market has been plagued with increased volatility lately, with the second largest crypto token by market cap, Ethereum (ETH), not exempt. This has made it harder to determine Ethereum’s future trajectory. However, certain metrics indicate what direction ETH’s price could head in when this volatility subsides. 

Ethereum Investors Are Bullish

Data from Coinglass shows that most Ethereum investors and traders are still bullish on the crypto token despite recent fluctuating prices. Specifically, most of these traders have continued to open long positions on Ethereum, meaning they are betting on it experiencing significant moves to the upside in the long run. 

The bullish sentiment towards Ethereum is highlighted by a trader who, having lost $4.5 million while longing ETH, still opened another long position on the second-largest crypto token. This crypto whale went as far as borrowing 17.3 million USDT from Compound just to increase their position on Ethereum. 

These investors’ bullishness on Ethereum is even more commendable, considering that the bulls have suffered the most from ETH’s high volatility. Data from Coinglass shows that over $16 million in long positions have been liquidated in the last 24 hours, compared to the $10 million short positions that have liquidated during this period. 

Meanwhile, data from the market intelligence platform IntoTheBlock shows that Ethereum’s Market Value to Realized Value (MVRV) ratio has dropped, indicating that many Ethereum holders are not yet in profit. This could be bullish for ETH’s price as these holders will likely hold in anticipation of further upward price action, thereby providing support against any potential price declines. 

Making A Case For The Bears

While the activity in the derivates market and Ethereum’s MVRV ratio paint a bullish outlook for the crypto token, Ethereum’s network growth suggests that ETH could still experience further price declines. Data from Santiment shows that the rate at which new users enter the Ethereum ecosystem has slowed recently. 

This declining network growth is also evident in a recent Bitcoinist report, which noted that Ethereum fees have dropped to their lowest since January. Ethereum fees are known to skyrocket when there is increased activity on the network. Therefore, low fees mean fewer new users are currently transacting on the network or even holding the ETH token at all. 

However, the silver lining is that data from Santiment also shows an increase in velocity, which suggests that existing users on the network are actively trading and injecting more liquidity into the Ethereum ecosystem. This factor could also contribute to potential price surges for the ETH token. 

At the time of writing, Ethereum is trading at around $3,200, which is up in the last 24 hours, according to data from CoinMarketCap. 

Ethereum price chart from Tradingview.com

Ethereum Spot ETFs Approval Skepticism Persists, As ETH Recovers

Ethereum Spot Exchange-Traded Funds (ETFs) approval odds continue to witness notable pessimism as the cryptocurrency space awaits the United States Securities and Exchange Commission’s (SEC) decision on the products scheduled for May.

The expectation surrounding the SEC’s decision highlights how important ETF approval is in terms of giving conventional investors more convenient access to Ethereum’s spot market. Presently, data from Polymarket, the world’s largest prediction market, shows that ETH ETF approval odds have fallen to a mere 11%.

Pessimism Deepens As Ethereum ETFs Remain Uncertain

As the May deadline draws near, doubt and skepticism loom large on the horizon, casting a dark shadow for the products. One of the most recent figures to voice doubts about the SEC’s willingness to approve the exchange-traded products this May is Nate Geraci, the president of ETF Store.

According to Geraci, the regulatory watchdog is eerily silent on Ethereum spot ETFs. He further suggested that the products might not be approved due to the SEC’s significantly lower level of engagement with ETF issuers than in previous interactions.

“Logic says that is correct, but also wonder if SEC learned a lesson from clown show with spot Bitcoin ETFs,” he added. Thus, he has pointed out two possible options for the products, which are either an approval or lawsuit from the Commission.

Commenting on the president’s insights, a pseudonymous X user questioned if there is a possibility that activities are taking place behind closed doors in order to avoid disrupting the pre-launch market. Geraci responded, saying he believes that could be possible, drawing attention to Van Eck CEO Jan Van Eck’s review, which might prove otherwise.

It is worth noting that Van Eck is one of the earliest firms to submit its application for an Ethereum exchange product. Even though the company was the first to file for an application, Jan Van Eck is pessimistic about the approval of the ETPs, saying they will probably be rejected in May.

He stated:

The way the legal process goes is the regulators will give you comments on your application, and that happened for weeks and weeks before the Bitcoin ETFs. And right now, pins are dropping as far as Ethereum is concerned.

In light of this, investors prepare for an unpredictable result while managing market swings and modifying their investment plans in the face of changing regulations.

ETH Price Sees Positive Movement

While Ethereum ETFs might be experiencing negative sentiment, ETH, on the other hand, has witnessed a positive uptick lately. ETH has revisited the $3,000 level again after falling as low as $2,888 during the weekend.

Today, ETH price rose by over 4%, reaching around $3,234, indicating potential for further price recovery. At the time of writing, Ethereum was trading at $3,215, demonstrating an increase of 1.40% in the past day.

Also, the asset’s market cap and trading volume are up by 1.40% and 5.96% in the last 24 hours. Given the anticipated impact of the recently concluded Bitcoin Halving on cryptocurrencies, ETH could be poised for noteworthy moves in the coming months.

Ethereum

Ethereum Price Hints At Potential Fresh Rally, Buy The Dip?

Ethereum price is moving higher above the $3,120 resistance zone. ETH could start a fresh rally if it clears the $3,280 resistance zone.

  • Ethereum is recovering higher and approaching the $3,280 resistance zone.
  • The price is trading above $3,100 and the 100-hourly Simple Moving Average.
  • There was a break above two connecting bearish trend lines with resistance at $3,070 and $3,150 on the hourly chart of ETH/USD (data feed via Kraken).
  • The pair could gain bullish momentum if it closes above the $3,250 zone.

Ethereum Price Regains Strength

Ethereum price formed a base above the $2,850 level and started a recovery wave, like Bitcoin. ETH cleared a few key hurdles near $3,000 to enter a positive zone.

There was a break above two connecting bearish trend lines with resistance at $3,070 and $3,150 on the hourly chart of ETH/USD. The pair surpassed the 50% Fib retracement level of the downward move from the $3,278 swing high to the $2,867 low.

Ethereum is now trading above $3,120 and the 100-hourly Simple Moving Average. It is also consolidating above the 76.4% Fib retracement level of the downward move from the $3,278 swing high to the $2,867 low. Immediate resistance is near the $3,200 level.

The first major resistance is near the $3,250 level. The next key resistance sits at $3,280, above which the price might gain traction and rise toward the $3,350 level.

Ethereum Price

Source: ETHUSD on TradingView.com

A close above the $3,350 resistance could send the price toward the $3,420 pivot level. If there is a move above the $3,420 resistance, Ethereum could even climb toward the $3,550 resistance. Any more gains could send Ether toward the $3,880 resistance zone in the coming days.

Another Decline In ETH?

If Ethereum fails to clear the $3,250 resistance, it could start another decline. Initial support on the downside is near the $3,150 level. The first major support is near the $3,120 zone and the 100-hourly Simple Moving Average.

A clear move below the $3,120 support might increase selling pressure and send the price toward $3,020. Any more losses might send the price toward the $2,965 level in the near term.

Technical Indicators

Hourly MACDThe MACD for ETH/USD is gaining momentum in the bullish zone.

Hourly RSIThe RSI for ETH/USD is now above the 50 level.

Major Support Level – $3,150

Major Resistance Level – $3,280

Ethereum Price Faces Crucial Test: Will $2,850 Withstand the Pressure?

Ethereum price is still consolidating near the $3,000 zone. ETH could start a steady increase if the bulls push the price above the $3,100 resistance.

  • Ethereum is still struggling to recover above the $3,100 resistance zone.
  • The price is trading below $3,100 and the 100-hourly Simple Moving Average.
  • There is a key bearish trend line forming with resistance at $3,070 on the hourly chart of ETH/USD (data feed via Kraken).
  • The pair could accelerate lower if there is a close below the $2,850 support zone.

Ethereum Price Consolidates

Ethereum price attempted another recovery wave and remained stable above the $3,000 level. However, the bears defended the $3,100 resistance zone, like Bitcoin.

There was another decline below $3,000. The price even spiked below the $2,900 support. A low was formed at $2,867 and the price is now recovering losses. It climbed above the 23.6% Fib retracement level of the downward move from the $3,278 swing high to the $2,867 low.

Ethereum is still trading below $3,100 and the 100-hourly Simple Moving Average. Immediate resistance is near the $3,020 level. The first major resistance is near the $3,070 level and the 100-hourly Simple Moving Average.

There is also a key bearish trend line forming with resistance at $3,070 on the hourly chart of ETH/USD. The trend line is close to the 50% Fib retracement level of the downward move from the $3,278 swing high to the $2,867 low. The next key resistance sits at $3,120, above which the price might rise toward the $3,200 level.

Ethereum Price

Source: ETHUSD on TradingView.com

The main downtrend resistance sits at $3,280. A close above the $3,280 resistance could send the price toward the $3,350 pivot level. If there is a move above the $3,350 resistance, Ethereum could even climb toward the $3,550 resistance.

More Losses In ETH?

If Ethereum fails to clear the $3,100 resistance, it could start another decline. Initial support on the downside is near the $2,920 level. The first major support is near the $2,850 zone.

A clear move below the $2,850 support might send the price toward $2,620. Any more losses might send the price toward the $2,550 level in the near term.

Technical Indicators

Hourly MACDThe MACD for ETH/USD is gaining momentum in the bearish zone.

Hourly RSIThe RSI for ETH/USD is now below the 50 level.

Major Support Level – $2,850

Major Resistance Level – $3,100

Ethereum Blockchain’s Q1 2024 Success: Unveiling The Factors Behind The $370M Profit Surge

Not only has Ethereum (ETH) seen an impressive rise of nearly 100% in the first quarter of 2024 in terms of price action, but the Ethereum blockchain has also generated substantial profits of up to $369 million during this period. This unexpected profitability has raised questions about how a blockchain like Ethereum can be profitable. 

Ethereum Revenue Potential

As noted in a recent analysis by the on-chain data platform Token Termina, the collection of transaction fees is a critical aspect of Ethereum’s business model. 

All network users are required to pay fees in ETH when interacting with applications on the blockchain, which serves as an important source of revenue for Ethereum.

Once transaction fees are paid, a portion of the ETH is burned and permanently removed from circulation. This process, commonly referred to as “ETH buyback,” benefits existing ETH holders, as the reduction in supply increases the scarcity and value of the remaining ETH tokens. Thus, the daily burning of ETH contributes to the economic benefit of those holding Ethereum.

In contrast to the burning of ETH, Ethereum also issues new ETH tokens as rewards to the network’s validators for each new block added to the blockchain

These rewards are similar to traditional stock-based compensation and are designed to incentivize validators to secure and maintain the network’s integrity. 

Nonetheless, it’s important to note that the issuance of new ETH tokens dilutes the holdings of existing ETH holders.

According to Token Terminal, the difference between the daily USD value of the burned ETH (revenue) and the newly issued ETH (expenses) represents the daily earnings for existing ETH holders, essentially the Ethereum blockchain owners. This calculation allows for the determination of Ethereum’s profitability on a day-to-day basis.

Reduced Transaction Costs Drive $3.3 Billion Growth

In addition to the overhauled revenue model implemented by the Ethereum blockchain, the launch of the much-anticipated Dencun upgrade to the Ethereum ecosystem at the end of the first quarter of 2024 brought significant changes, including the introduction of a revolutionary data storage system called blobs. 

This upgrade has reduced congestion on the Ethereum network and significantly reduced transaction costs on Layer 2 networks such as Arbitrum (ABR), Polygon (MATIC), and Coinbase’s Base. 

Implementing the Dencun upgrade, alongside the adoption of blobs and Layer 2 networks, has significantly impacted Ethereum’s revenue. 

According to Token Terminal data, the blockchain’s revenue has witnessed an 18% annualized increase, amounting to an impressive $3.3 billion. These revenue gains can be attributed to reduced transaction costs, making Ethereum a more attractive platform for users and developers.

Ethereum

Despite the positive revenue growth, it is essential to acknowledge the impact of market corrections and dampened investor interest in the second quarter of 2024. 

Over the past 30 days, Ethereum’s revenue has declined by over 52%. This downturn can be attributed to the broader market dynamics and the temporary decrease in investor enthusiasm. 

Examining the data over the past 30 days, Ethereum’s market cap (fully diluted) has decreased by 15.2% to $358.47 billion. Similarly, the circulating market cap has declined by 15.2% to reach the same value. 

Additionally, the token trading volume over the past 30 days has declined 18.6%, totaling $586.14 billion. 

Ethereum

ETH is trading at $3,042, up 0.4% in the last 24 hours. It remains to be seen whether these changes and the reduction in fees will have the same effect in the second quarter of the year, and how this, coupled with a potential increase in trading volume, can push the ETH price to higher levels. 

Featured image from Shutterstock, chart from TradingView.com 

Ethereum Price Holds Strong At $3K But Can Bulls Clear This Hurdle?

Ethereum price is consolidating near the $3,000 zone. ETH could start a decent recovery wave if it clears the $3,100 and $3,200 resistance levels.

  • Ethereum is struggling to recover above the $3,100 resistance zone.
  • The price is trading below $3,120 and the 100-hourly Simple Moving Average.
  • There is a major bearish trend line forming with resistance at $3,035 on the hourly chart of ETH/USD (data feed via Kraken).
  • The pair could start another decline if it stays below the $3,100 resistance zone.

Ethereum Price Holds Ground

Ethereum price slowly moved lower after it failed to clear the $3,200 resistance zone. ETH remained in a bearish zone below $3,100 and showed bearish signs, like Bitcoin.

Recently, the bears were able to push the price below the $3,000 support zone. However, the bulls were active near the 50% Fib retracement level of the upward wave from the $2,535 swing low to the $3,279 high. Ethereum is now trading below $3,120 and the 100-hourly Simple Moving Average.

Immediate resistance is near the $3,030 level. There is also a major bearish trend line forming with resistance at $3,035 on the hourly chart of ETH/USD. The first major resistance is near the $3,100 level and the 100-hourly Simple Moving Average.

Ethereum Price

Source: ETHUSD on TradingView.com

The next key resistance sits at $3,200, above which the price might rise toward the $3,280 level. A close above the $3,280 resistance could send the price toward the $3,500 pivot level. If there is a move above the $3,500 resistance, Ethereum could even climb toward the $3,650 resistance in the coming sessions.

More Losses In ETH?

If Ethereum fails to clear the $3,100 resistance, it could start another decline. Initial support on the downside is near the $3,000 level. The first major support is near the $2,900 zone.

The next key support could be the $2,820 zone or the 61.8% Fib retracement level of the upward wave from the $2,535 swing low to the $3,279 high. A clear move below the $2,820 support might send the price toward $2,600. Any more losses might send the price toward the $2,550 level in the near term.

Technical Indicators

Hourly MACDThe MACD for ETH/USD is gaining momentum in the bearish zone.

Hourly RSIThe RSI for ETH/USD is now below the 50 level.

Major Support Level – $2,900

Major Resistance Level – $3,100

Ethereum Price Stuck Near $3K, Indicators Show Risk of Downside Break

Ethereum price is still facing many hurdles near $3,200. ETH could start another major decline if the price stays below $3,200 and $3,280.

  • Ethereum is struggling to recover above the $3,200 resistance zone.
  • The price is trading below $3,200 and the 100-hourly Simple Moving Average.
  • There is a key bearish trend line forming with resistance at $3,120 on the hourly chart of ETH/USD (data feed via Kraken).
  • The pair could start another decline if there is a close below the $2,900 support zone.

Ethereum Price Consolidates

Ethereum price found support and attempted a recovery wave above the $3,000 resistance zone. ETH was able to climb above the $3,200 level. However, the bears were active near the $3,280 resistance zone.

A high was formed at $3,278 and the price reacted to the downside, like Bitcoin. It dipped below the 23.6% Fib retracement level of the upward move from the $2,536 swing low to the $3,278 high. Ethereum is now trading below $3,200 and the 100-hourly Simple Moving Average.

Immediate resistance is near the $3,100 level. There is also a key bearish trend line forming with resistance at $3,120 on the hourly chart of ETH/USD. The first major resistance is near the $3,200 level and the 100-hourly Simple Moving Average.

Ethereum Price

Source: ETHUSD on TradingView.com

The next key resistance sits at $3,280, above which the price might rise toward the $3,350 level. The key hurdle could be $3,500, above which Ether could gain bullish momentum. In the stated case, the price could rise toward the $3,620 zone. If there is a move above the $3,620 resistance, Ethereum could even climb toward the $3,750 resistance.

Another Decline In ETH?

If Ethereum fails to clear the $3,200 resistance, it could start another decline. Initial support on the downside is near the $3,000 level.

The first major support is near the $2,900 zone or the 50% Fib retracement level of the upward move from the $2,536 swing low to the $3,278 high. The next key support could be the $2,710 zone. A clear move below the $2,710 support might send the price toward $2,650. Any more losses might send the price toward the $2,550 level.

Technical Indicators

Hourly MACDThe MACD for ETH/USD is losing momentum in the bearish zone.

Hourly RSIThe RSI for ETH/USD is now above the 50 level.

Major Support Level – $2,900

Major Resistance Level – $3,200

Ethereum Price Recovery In Jeopardy? Decoding Key Hurdles To Fresh Increase

Ethereum price is facing many hurdles near $3,200. ETH could gain bearish momentum if the price stays below $3,200 and $3,280.

  • Ethereum is struggling to recover above the $3,200 resistance zone.
  • The price is trading below $3,200 and the 100-hourly Simple Moving Average.
  • There was a break below a connecting bullish trend line with support at $3,100 on the hourly chart of ETH/USD (data feed via Kraken).
  • The pair could start another decline if there is a close below the $3,000 support zone.

Ethereum Price Faces Hurdles

Ethereum price started a recovery wave above the $3,000 resistance zone. ETH was able to climb above the $3,120 level. However, the bears were active near the $3,280 resistance zone.

A high was formed at $3,278 and the price started a fresh decline, like Bitcoin. There was a move below the $3,200 support zone. The price declined below the 23.6% Fib retracement level of the recovery wave from the $2,537 swing low to the $3,278 high.

There was also a break below a connecting bullish trend line with support at $3,100 on the hourly chart of ETH/USD. Ethereum is now trading below $3,200 and the 100-hourly Simple Moving Average.

Immediate resistance is near the $3,200 level. The first major resistance is near the $3,250 level. The next key resistance sits at $3,280, above which the price might test the $3,350 level. The key hurdle could be $3,500, above which Ether could gain bullish momentum.

Ethereum Price

Source: ETHUSD on TradingView.com

In the stated case, the price could rise toward the $3,620 zone. If there is a move above the $3,620 resistance, Ethereum could even rise toward the $3,750 resistance.

More Losses In ETH?

If Ethereum fails to clear the $3,200 resistance, it could continue to move down. Initial support on the downside is near the $3,000 level.

The first major support is near the $2,900 zone or the 50% Fib retracement level of the recovery wave from the $2,537 swing low to the $3,278 high. The next key support could be the $2,820 zone. A clear move below the $2,820 support might send the price toward $2,650. Any more losses might send the price toward the $2,550 level.

Technical Indicators

Hourly MACDThe MACD for ETH/USD is gaining momentum in the bearish zone.

Hourly RSIThe RSI for ETH/USD is now below the 50 level.

Major Support Level – $3,000

Major Resistance Level – $3,200

Ethereum Price Reclaims $3K But Can ETH Continue Higher?

Ethereum price dived over 10% before the bulls appeared near $2,550. ETH is back above $3,000 and now faces many hurdles near $3,200.

  • Ethereum is attempting a recovery wave from the $2,550 support zone.
  • The price is trading below $3,250 and the 100-hourly Simple Moving Average.
  • There is a rising channel forming with resistance at $3,200 on the hourly chart of ETH/USD (data feed via Kraken).
  • The pair could gain bullish momentum if it stays above the $3,000 support zone.

Ethereum Price Eyes Recovery Wave

Ethereum price started a major decline from the $3,550 resistance. ETH declined over 10% and traded below the $3,000 support. It even spiked below $2,750 and tested $2,550.

A low was formed near $2,537 and the price is now attempting a recovery wave, like Bitcoin. The price climbed above the $2,800 and $3,000 resistance levels. It even surpassed the 50% Fib retracement level of the downward move from the $3,615 swing high to the $2,537 low.

Ethereum is now trading below $3,250 and the 100-hourly Simple Moving Average. Immediate resistance is near the $3,200 level or the 61.8% Fib retracement level of the downward move from the $3,615 swing high to the $2,537 low. There is also a rising channel forming with resistance at $3,200 on the hourly chart of ETH/USD.

Ethereum Price

Source: ETHUSD on TradingView.com

The first major resistance is near the $3,250 level. The next key resistance sits at $3,300, above which the price might test the $3,360 level. The key hurdle could be $3,500, above which Ether could gain bullish momentum. In the stated case, the price could rise toward the $3,620 zone. If there is a move above the $3,620 resistance, Ethereum could even rise toward the $3,750 resistance.

Another Decline In ETH?

If Ethereum fails to clear the $3,250 resistance, it could start another decline. Initial support on the downside is near the $3,080 level.

The first major support is near the $3,000 zone. The next key support could be the $2,880 zone. A clear move below the $2,880 support might send the price toward $2,750. Any more losses might send the price toward the $2,550 level.

Technical Indicators

Hourly MACDThe MACD for ETH/USD is losing momentum in the bearish zone.

Hourly RSIThe RSI for ETH/USD is now above the 50 level.

Major Support Level – $3,000

Major Resistance Level – $3,250

Ethereum Price Faces Crucial Test, Can ETH Clear This Hurdle To Kickstart Rally?

Ethereum price is consolidating above the $3,450 support zone. ETH must clear $3,560 and $3,620 to start a fresh increase in the near term.

  • Ethereum is trading in a range above the $3,450 support zone.
  • The price is trading above $3,500 and the 100-hourly Simple Moving Average.
  • There is a new connecting bearish trend line forming with resistance at $3,550 on the hourly chart of ETH/USD (data feed via Kraken).
  • The pair could gain bullish momentum if it stays above the $3,420 support zone.

Ethereum Price Eyes Upside Break

Ethereum price attempted another increase above the $3,550 resistance. ETH even climbed above $3,600, but the upsides were limited like Bitcoin. A high was formed at $3,614 before the price trimmed gains.

It declined below $3,500 and treaded as low as $3,476. The price is again recovering and moving above $3,500. There was a move above the 23.6% Fib retracement level of the recent decline from the $3,614 swing high to the $3,476 low.

Ethereum is now trading above $3,500 and the 100-hourly Simple Moving Average. Immediate resistance is near the $3,550 level or the 50% Fib retracement level of the recent decline from the $3,614 swing high to the $3,476 low. There is also a new connecting bearish trend line forming with resistance at $3,550 on the hourly chart of ETH/USD.

Ethereum Price

Source: ETHUSD on TradingView.com

The first major resistance is near the $3,620 level. The next key resistance sits at $3,650, above which the price might test the $3,720 level. The key hurdle could be $3,750, above which Ether could gain bullish momentum. In the stated case, the price could rise toward the $3,820 zone. If there is a move above the $3,820 resistance, Ethereum could even rise toward the $4,000 resistance.

Another Rejection In ETH?

If Ethereum fails to clear the $3,550 resistance, it could start another decline. Initial support on the downside is near the $3,500 level.

The first major support is near the $3,475 zone. The next key support could be the $3,420 zone. A clear move below the $3,420 support might send the price toward $3,320. Any more losses might send the price toward the $3,240 level.

Technical Indicators

Hourly MACDThe MACD for ETH/USD is losing momentum in the bearish zone.

Hourly RSIThe RSI for ETH/USD is now above the 50 level.

Major Support Level – $3,475

Major Resistance Level – $3,550

Ethereum Price Prints Bullish Pattern, Why Close Above $3,600 Is Critical

Ethereum price stayed above the $3,400 support zone. ETH is recovering losses, but it must clear $3,600 to continue higher in the near term.

  • Ethereum extended its decline and tested the $3,400 support zone.
  • The price is trading above $3,500 and the 100-hourly Simple Moving Average.
  • There was a break above a connecting bearish trend line with resistance at $3,500 on the hourly chart of ETH/USD (data feed via Kraken).
  • The pair could gain bullish momentum if it stays above the $3,500 support zone.

Ethereum Price Aims Higher

Ethereum price extended its decline below the $3,500 level. ETH even spiked below the $3,450 support before the bulls appeared. The price traded as low as $3,408 and recently started a recovery wave, like Bitcoin.

There was a move above the $3,500 resistance zone. The price climbed and tested the 50% Fib retracement level of the downward move from the $3,726 swing high to the $3,408 low. Besides, there was a break above a connecting bearish trend line with resistance at $3,500 on the hourly chart of ETH/USD.

Ethereum is now trading near $3,500 and the 100-hourly Simple Moving Average. Immediate resistance is near the $3,600 level or the 61.8% Fib retracement level of the downward move from the $3,726 swing high to the $3,408 low.

Ethereum Price

Source: ETHUSD on TradingView.com

The first major resistance is near the $3,650 level. The next key resistance sits at $3,725, above which the price might test the $3,780 level. The key hurdle could be $3,800, above which Ether could gain bullish momentum. In the stated case, the price could rise toward the $3,880 zone. If there is a move above the $3,880 resistance, Ethereum could even rise toward the $4,000 resistance.

Another Decline In ETH?

If Ethereum fails to clear the $3,600 resistance, it could start another decline. Initial support on the downside is near the $3,520 level.

The first major support is near the $3,500 zone. The next key support could be the $3,400 zone. A clear move below the $3,400 support might send the price toward $3,320. Any more losses might send the price toward the $3,240 level.

Technical Indicators

Hourly MACDThe MACD for ETH/USD is gaining momentum in the bullish zone.

Hourly RSIThe RSI for ETH/USD is now above the 50 level.

Major Support Level – $3,520

Major Resistance Level – $3,600

Changing Tides: Restaking Takes Center Stage In Ethereum (ETH) Staking Landscape

In recent months, the Ethereum staking landscape has witnessed significant transformations, prompting a shift in investor preferences and reshaping the sector’s dynamics. 

According to on-chain data researcher and strategist at 21Shares, Tom Wan, key metrics indicate a notable change in the approach towards Ethereum staking, with restaking gaining prominence as a preferred method.

Ethereum Restaking Landscape

Wan’s observations, shared on the social media platform X (formerly Twitter), highlight a steady increase in ETH staking deposits from restaking, rising from 10% to 60% since 2024. 

Restaking can be accomplished in two primary ways: through ETH natively restaked or by utilizing a liquid staking token (LST). By staking their ETH, users secure additional applications known as Actively Validated Services (AVS), which yield additional staking rewards.

A significant player in the staking landscape is EigenLayer, which has emerged as the second-largest decentralized finance (DeFi) protocol on the Ethereum network. 

EigenLayer has achieved a significant milestone with the release of EigenDA, its data availability Actively Validated Service (AVS), on the mainnet. 

According to a research report by Kairos, this launch marks the beginning of a new era in restaking, where liquid restaking tokens (LRTs) will become the dominant way for restakers to do business. 

Currently, 73% of all deposits on EigenLayer are made through liquid restaking tokens. The report highlights that the growth rate of LRT deposits has been significant, increasing by over 13,800% in less than four months, from approximately $71.74 million on December 1, 2023, to $10 billion on April 9, 2024, demonstrating the growing confidence in EigenLayer’s approach to restaking and contributing to the shifting tides in Ethereum’s staking landscape. 

According to Wan, the rise of liquid restaking protocols has also contributed to a decline in the dominance of Lido (LDO), a staking service solution for Solana (SOL), Ethereum, and Terra (LUNC). 

On the other hand, Etherfi has emerged as the second-largest stETH withdrawer, with 108,000 stETH withdrawn through the first quarter of 2024. This trend exemplifies the increasing popularity of liquid restaking protocols, allowing stakers to withdraw and actively utilize their staked assets while still earning rewards.

Ether.fi Set To Surpass Binance In ETH Staking

Data provided by Wan also shows a decline in the dominance of centralized exchanges (CEXs) in ETH staking. Since 2024, CEXs have seen their share of staking decline from 29.7% to 25.8%, a significant drop of 3.7%. 

As a result, the decentralized staking provider Kiln Finance has surpassed Binance and become the third-largest entity in terms of ETH staking. With Ether.fi poised to follow suit, it is expected to surpass Binance’s position shortly, according to the researcher. 

In short, these developments signify a paradigm shift in the Ethereum staking landscape, with re-staking methodologies gaining traction and decentralized protocols like EigenLayer and Ether.fi challenging the dominance of established players. 

Ethereum

As of this writing, ETH’s price stands at $3,500. It has been exhibiting a sideways trading pattern over the past 24 hours, remaining relatively stable compared to yesterday.

Featured image from Shutterstock, chart from TradingView.com