Ethereum remained in a positive zone and it traded to a new all-time high above $2,750 against the US Dollar. ETH price is correcting gains, but dips are likely to be limited below $2,650.
- Ethereum extended its rise above the $2,700 and $2,740 resistance levels.
- The price is now trading well above $2,650 and the 100 hourly simple moving average.
- There is a major rising channel forming with support near $2,640 on the hourly chart of ETH/USD (data feed via Kraken).
- The pair is likely to start a fresh increase above the $2,750 resistance zone in the near term.
Ethereum Price Eyes More Gains
Ethereum is following a bullish path above the $2,600 pivot level. ETH even cleared the $2,720 resistance and settled well above the 100 hourly simple moving average.
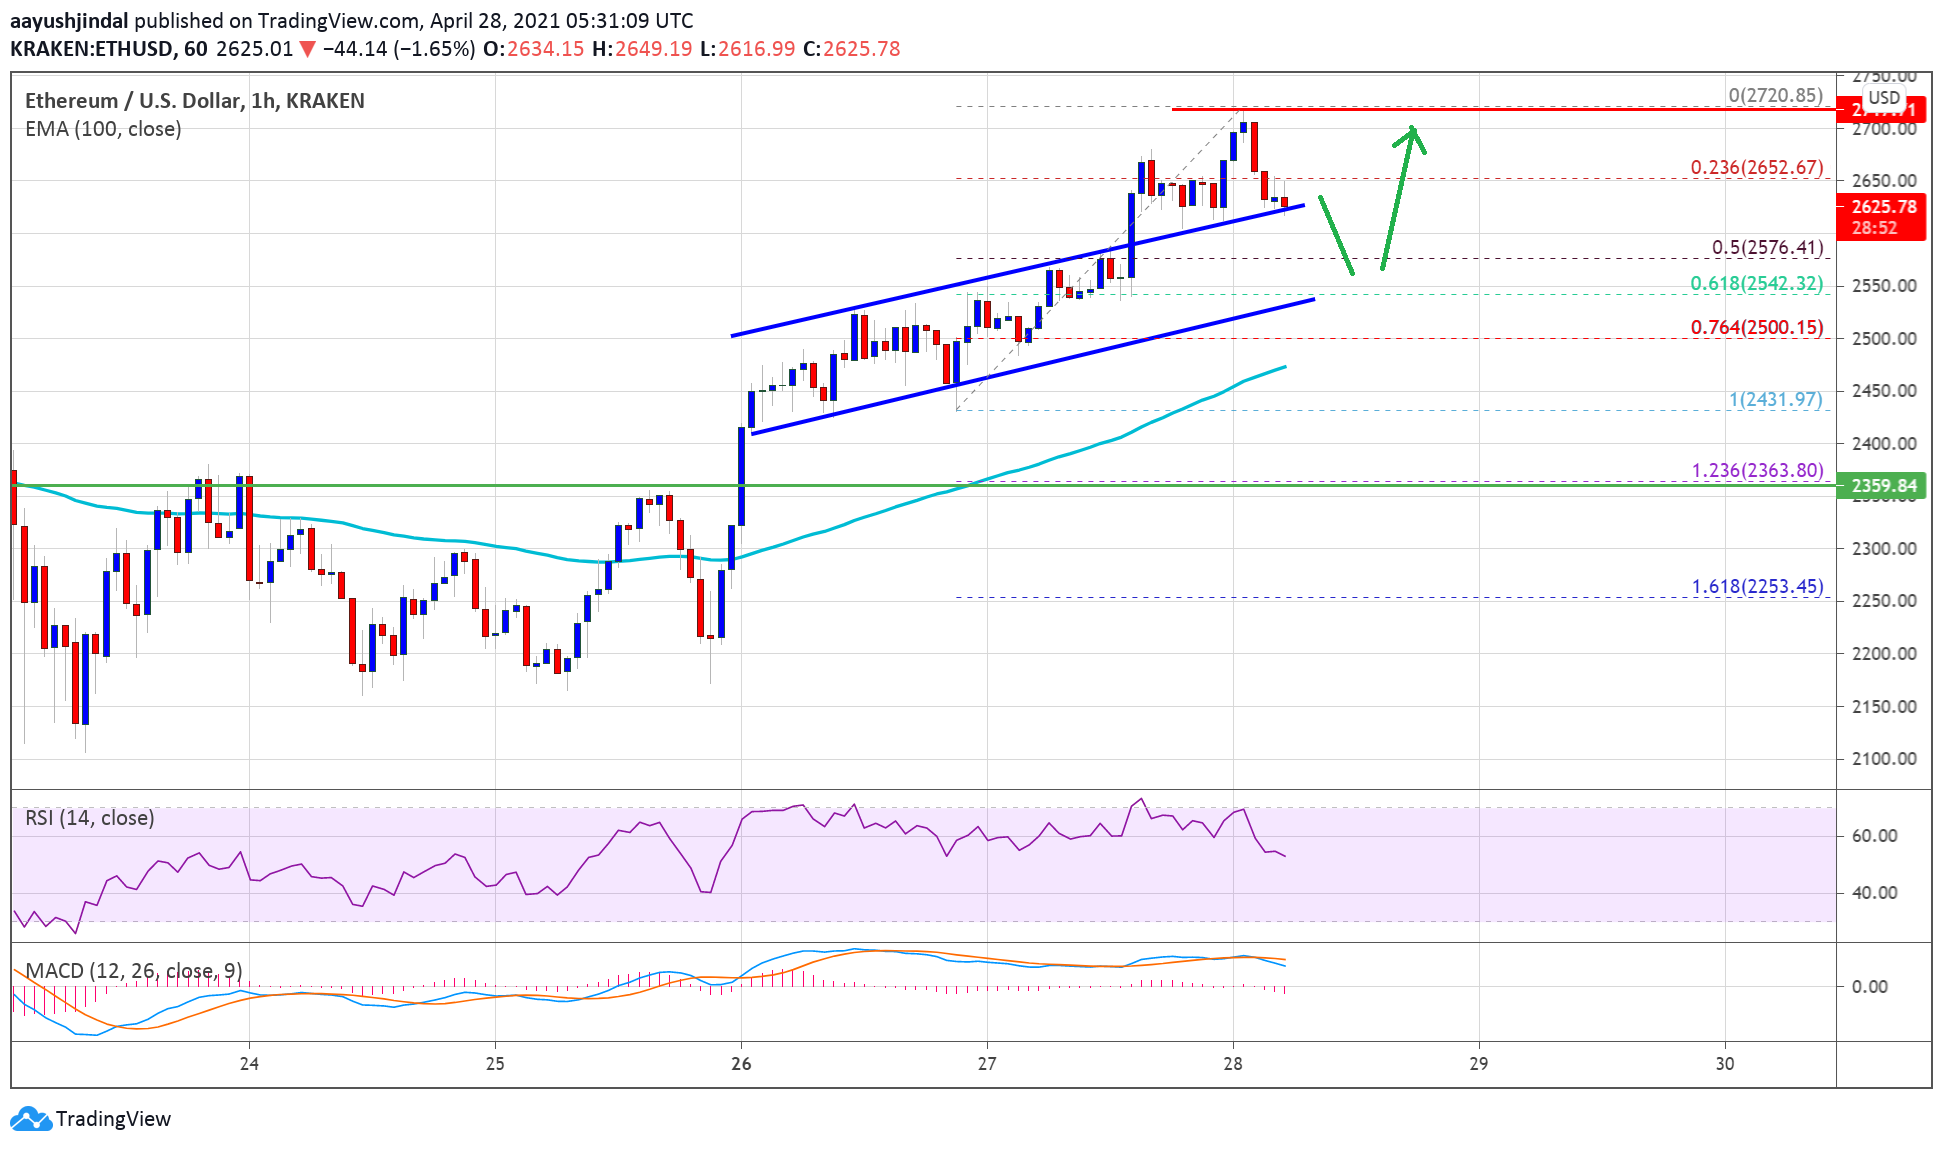
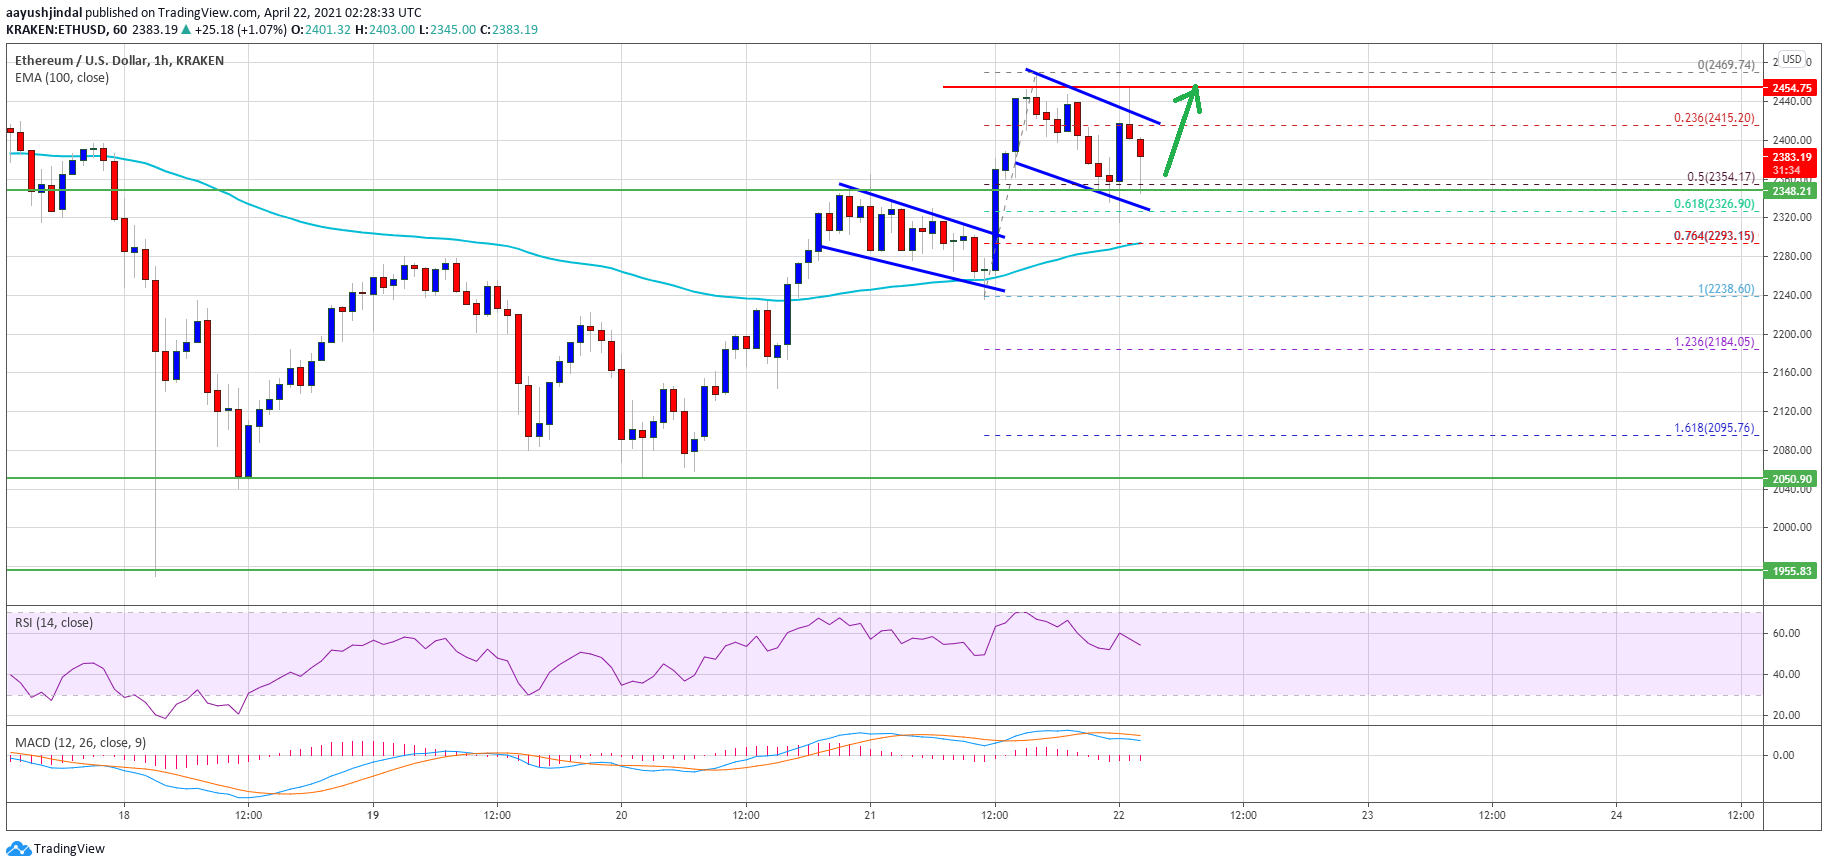
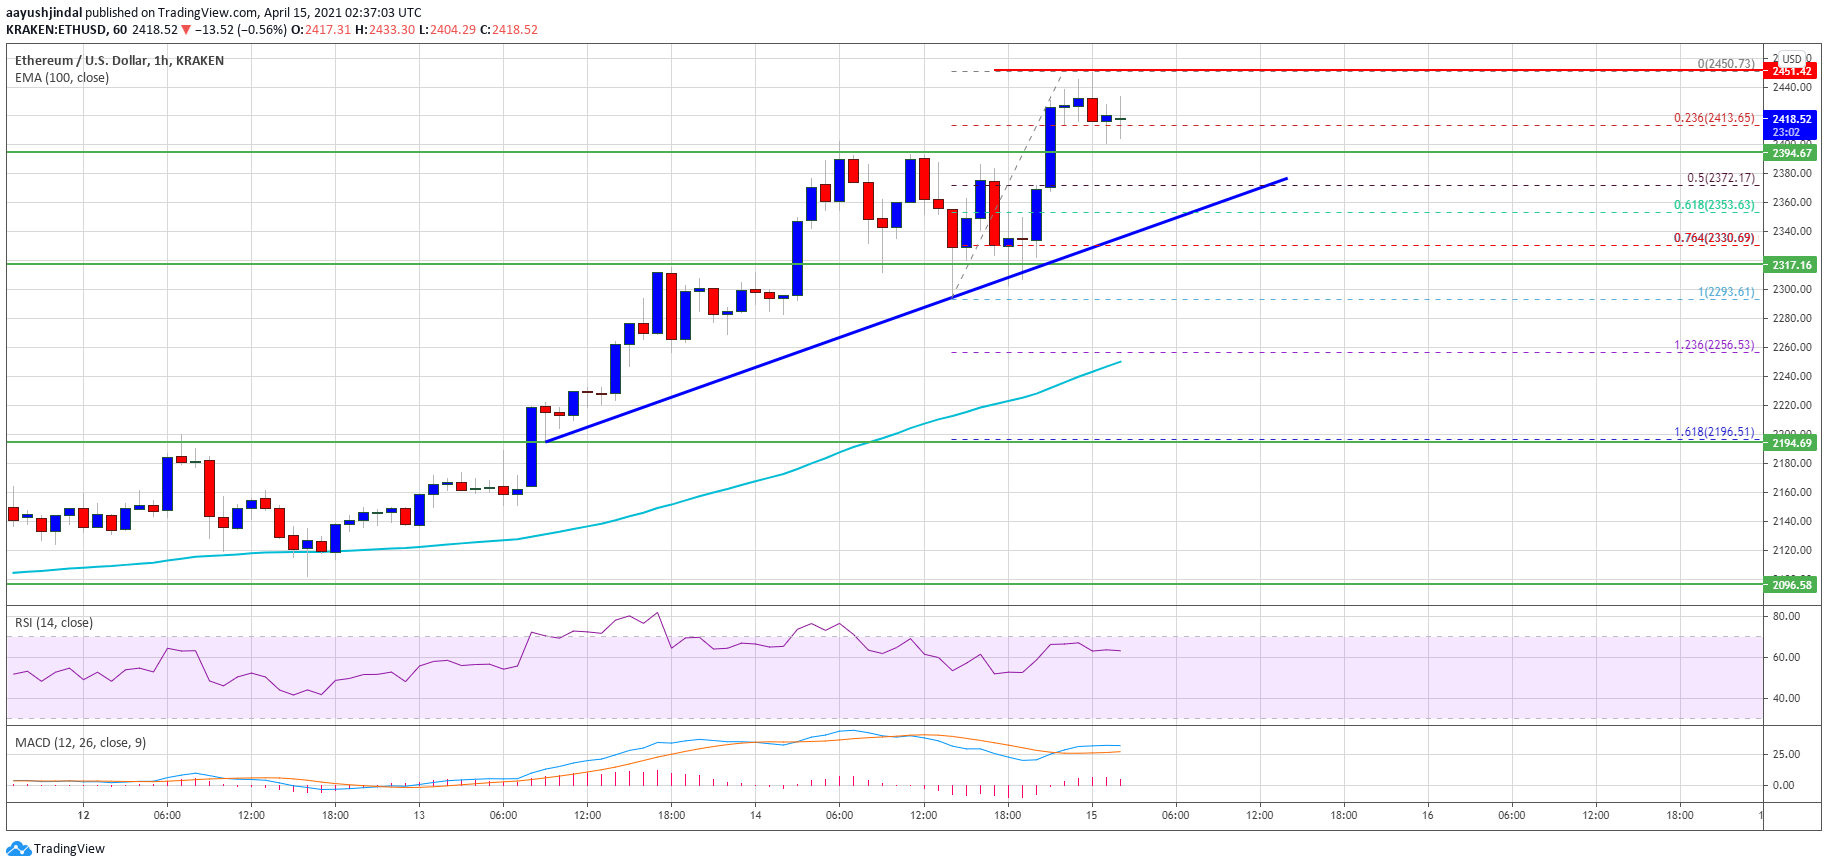
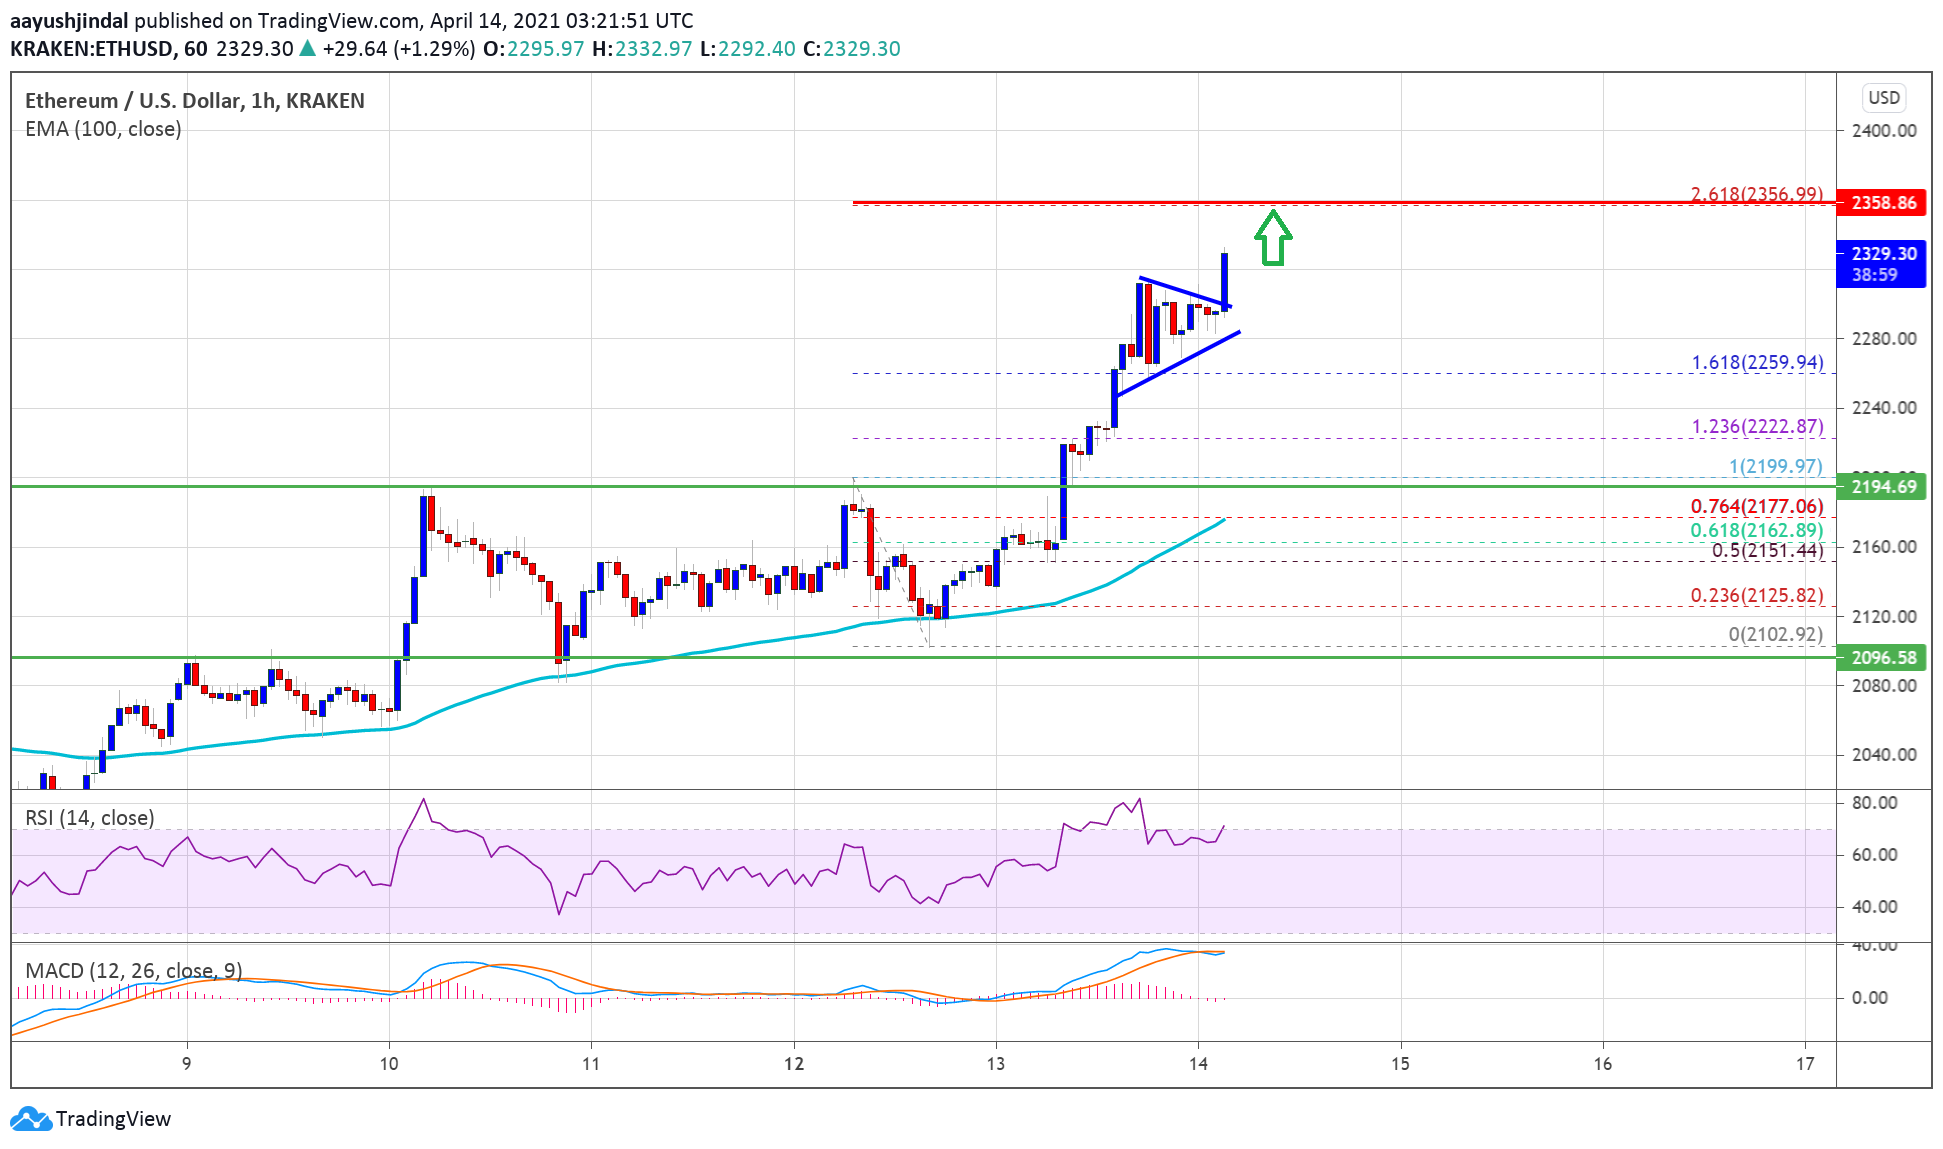
It traded to a new all-time high at $2,764 before it started a downside correction. There was a break below the $2,720 and $2,700 levels. Ether is now trading below the 23.6% Fib retracement level of the recent wave from the $2,560 swing low to $2,764 high.
It is still trading well above $2,650 and the 100 hourly simple moving average. There is also a major rising channel forming with support near $2,640 on the hourly chart of ETH/USD.
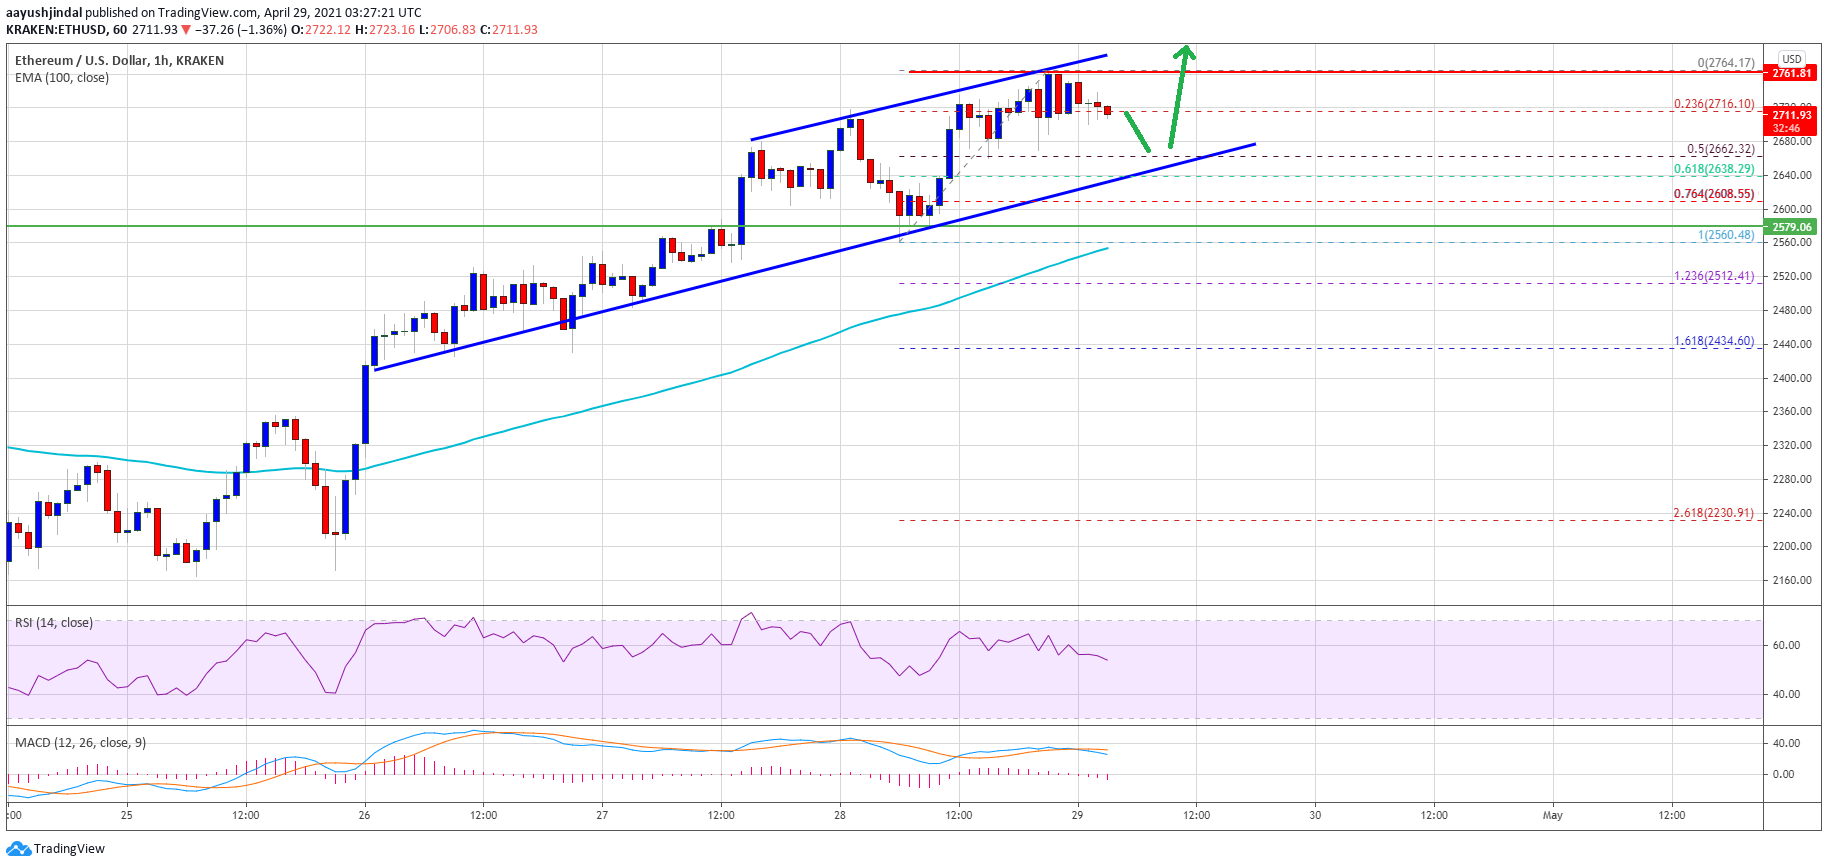
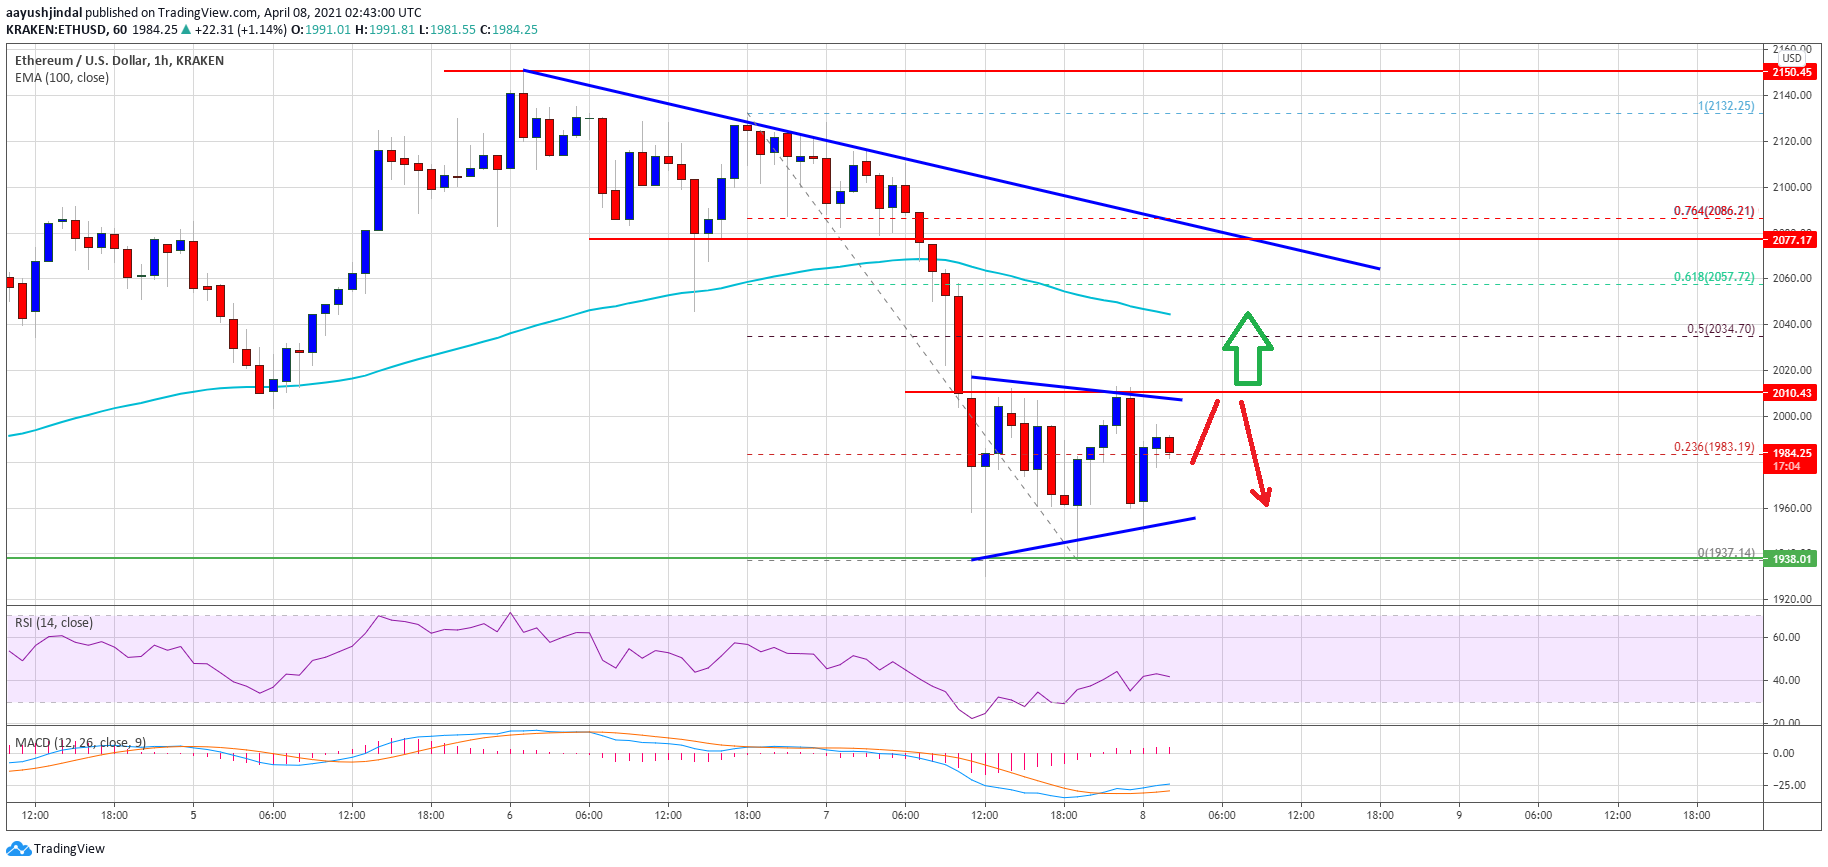
Source: ETHUSD on TradingView.com
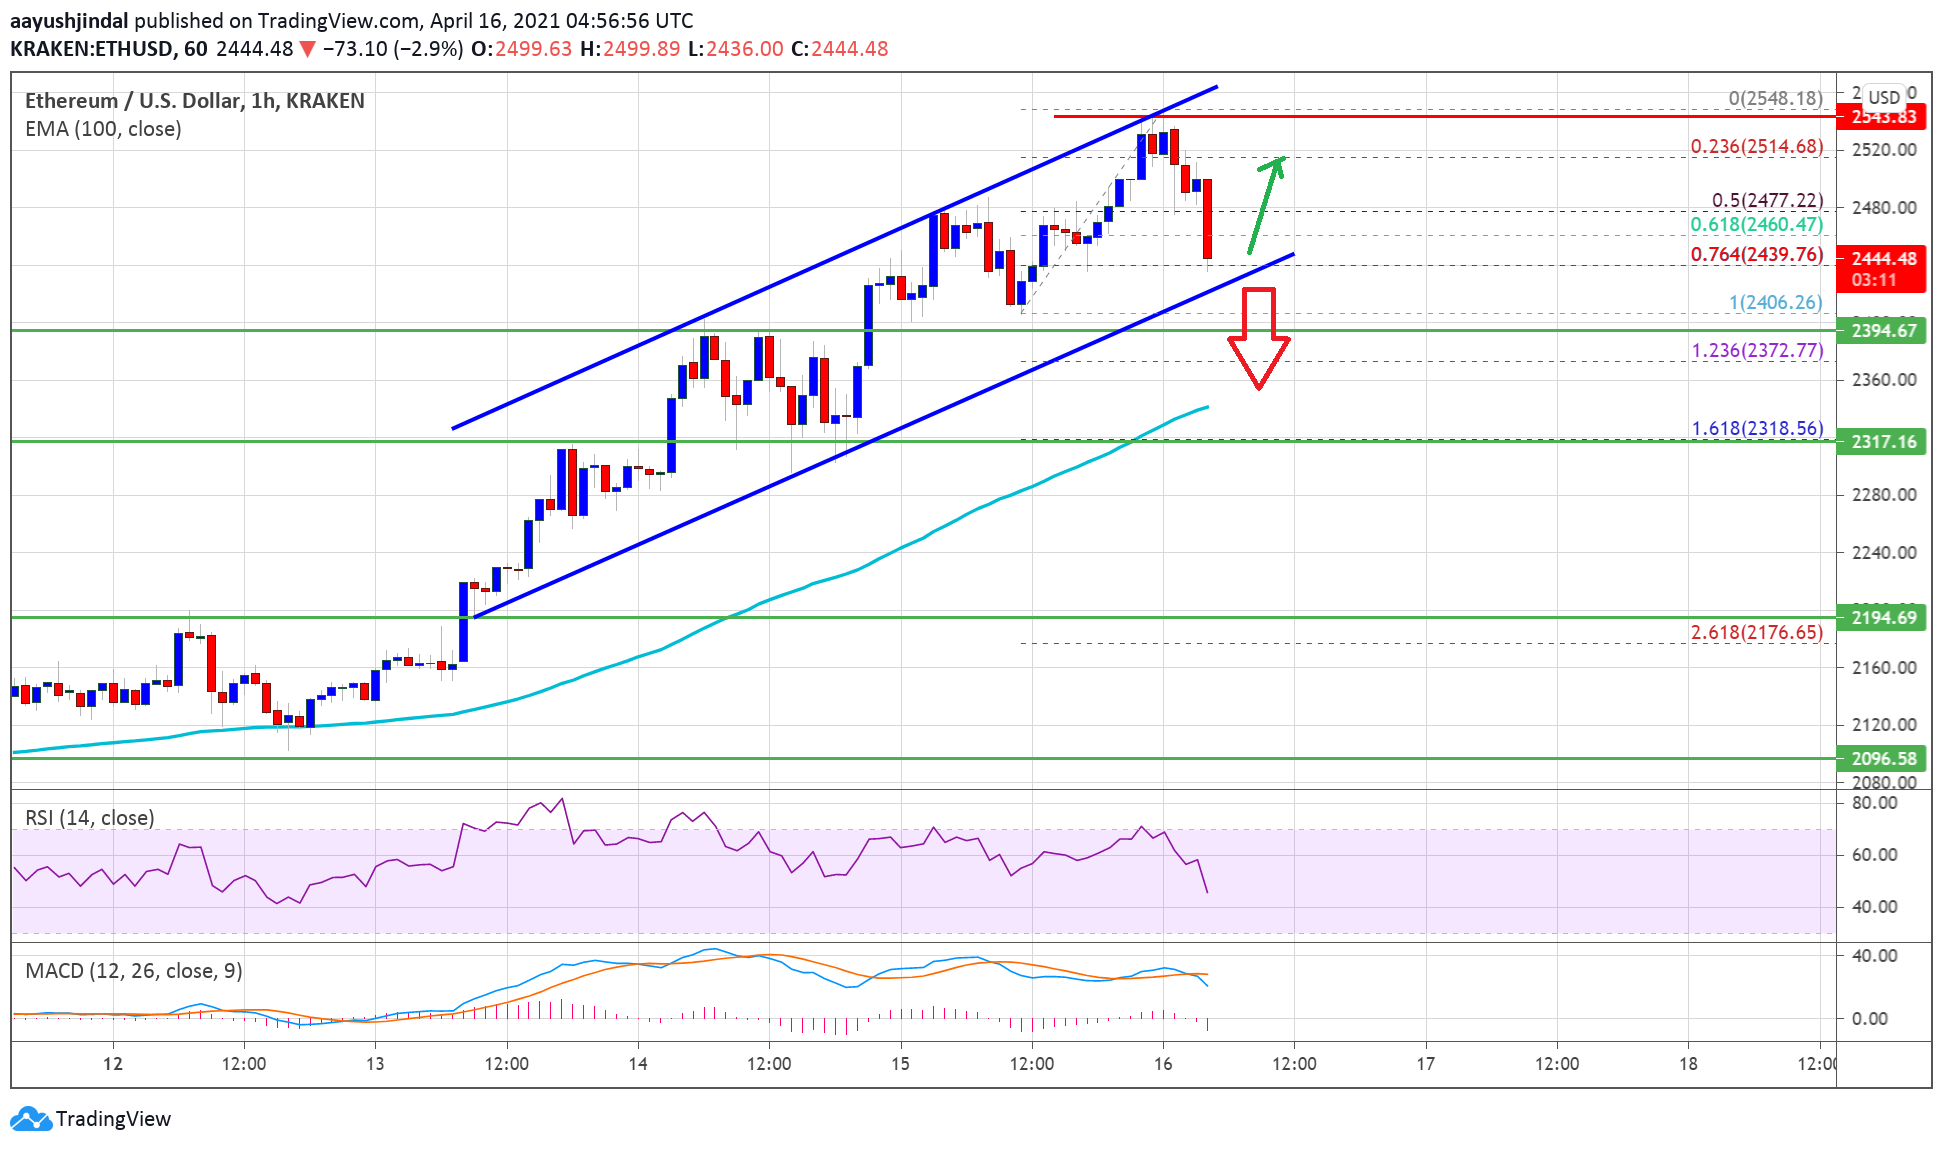
The channel support is close to the 50% Fib retracement level of the recent wave from the $2,560 swing low to $2,764 high. On the upside, the price is facing resistance near the $2,750 and $2,760 levels. A successful close above the $2,760 zone could set the pace for more gains.
The next major resistance is near the $2,800 level, above which the price could accelerate higher towards the $2,880 level. The main target for the bulls may possibly be near the $3,000 level.
Dips Limited in ETH?
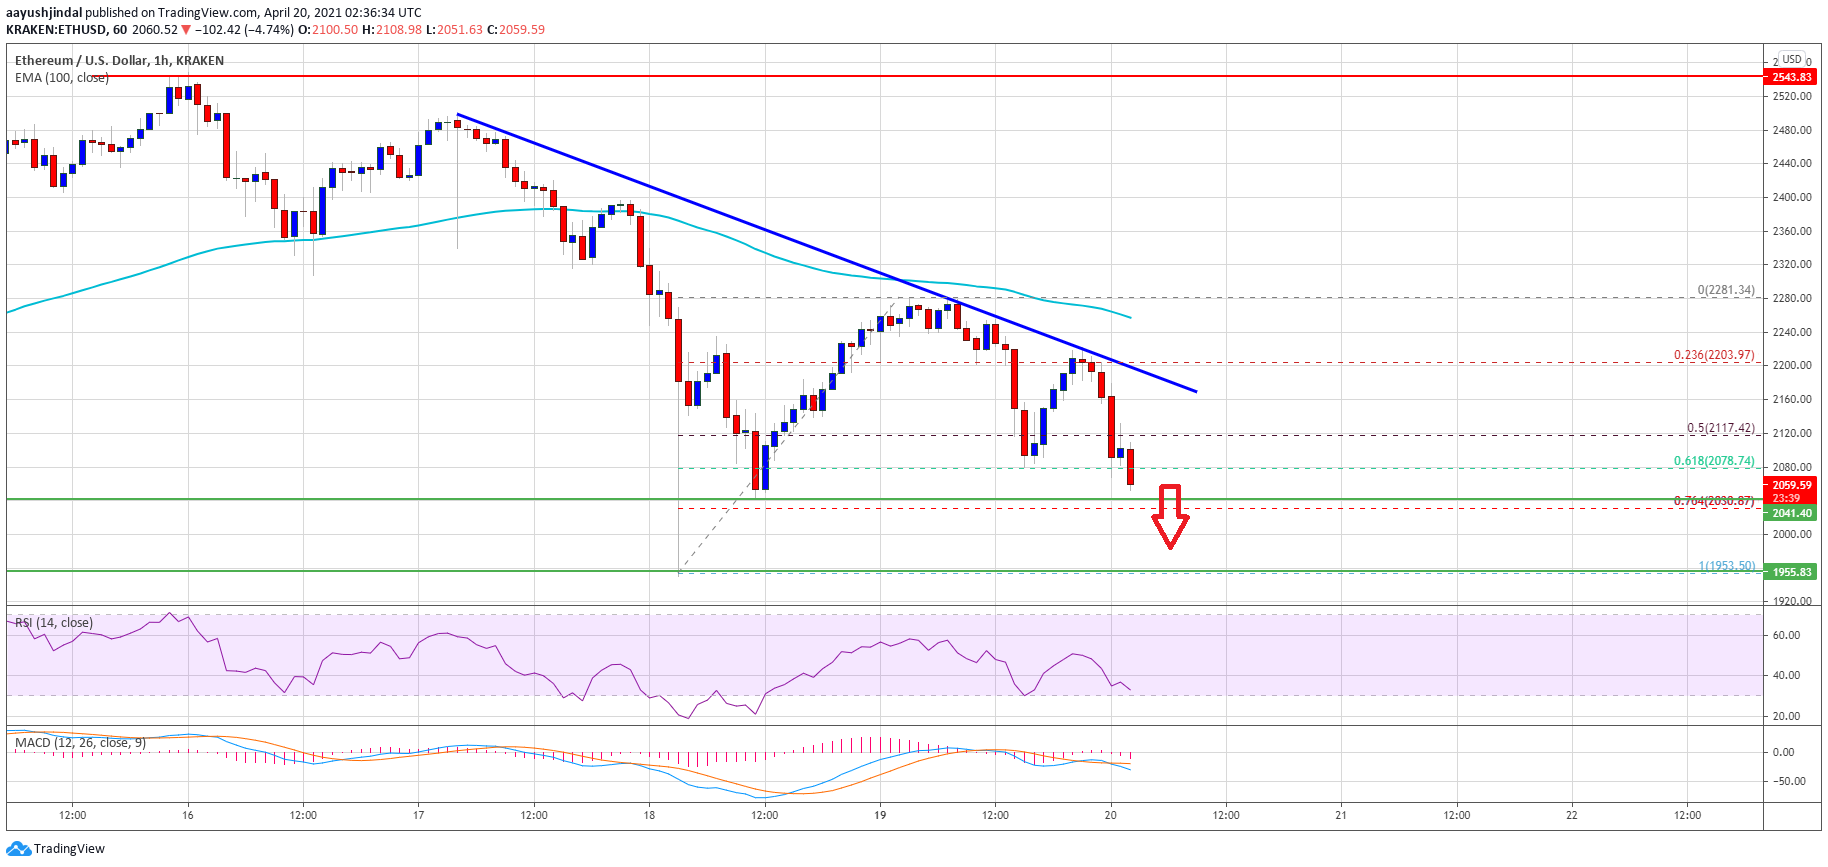
If Ethereum fails to extend gains above $2,750, there could be a downside correction. An immediate support is near the channel trend line or $2,650.
A downside break below the channel support could lead the price towards the $2,600 support. Any more losses might call for an extended decline towards the $2,550 support zone or the 100 hourly simple moving average in the near term.
Technical Indicators
Hourly MACD – The MACD for ETH/USD is now gaining momentum in the bearish zone.
Hourly RSI – The RSI for ETH/USD is now approaching the 50 level.
Major Support Level – $2,650
Major Resistance Level – $2,750