The Next Big Catalyst For Bitcoin? What Michael Saylor Predicts

In an interview with journalist Natalie Brunell, Michael Saylor, executive chairman and co-founder of MicroStrategy, laid out his vision for what could next propel the price of Bitcoin. His insights come at a time when the digital currency landscape is experiencing pivotal regulatory and institutional developments.

The Next Big Catalyst For Bitcoin Price

Saylor pinpointed the specific moment he believes heralded the onset of a new era for Bitcoin. “January of 2024 marked the beginning of the period of corporate adoption of Bitcoin,” he stated. The significance of this shift, according to Saylor, is tied closely to regulatory approvals and the distinctive path Bitcoin is carving for itself amidst a sea of digital assets.

The crux of Saylor’s argument is the US Securities and Exchange Commission’s (SEC) decision-making process regarding cryptocurrency spot Exchange-Traded Funds (ETFs). He described the SEC’s approval of Bitcoin spot ETFs as the “first big catalyst.” This regulatory nod not only legitimizes Bitcoin in the eyes of institutional investors but also enhances its appeal as a viable corporate treasury asset.

Now, Saylor argues that the next decisive moment will hinge on the SEC’s handling of other cryptocurrencies. “The second big catalyst will be the SEC’s denial of every other crypto application for spot ETFs,” Saylor explained. By denying these applications, the SEC would effectively position Bitcoin as the premier, unreplicated choice among cryptocurrencies, an outcome Saylor sees as critical for dispelling doubts about Bitcoin’s long-term viability and uniqueness.

“And when we actually see the regulators deny the applications of the copies of other crypto assets, then we will have checked the box. It won’t be banned, it won’t be copied,” Saylor remarked.

Expanding on the implications of such regulatory decisions, Saylor employed a metaphor involving the choice of materials in large-scale engineering projects. He compared the decision-making process in corporate investment in Bitcoin to choosing between steel or bronze for constructing a skyscraper.

“Once you realize there’s just steel and there is no second best metal for structural civil engineering, the project moves forward,” he noted. In this analogy, Bitcoin is likened to steel — the foundational material without substitute — clearing any hesitation about its adoption in corporate portfolios.

Notably, this narrative is timely as the crypto sector watches the SEC closely, particularly with regard to Ethereum, the second-largest cryptocurrency by market cap. The final deadline for the SEC to approve or deny the VanEck spot Ethereum ETF is May 23, 2024, a decision that has been postponed repeatedly.

Bloomberg’s senior ETF analyst, Eric Balchunas, noted a decrease in the likelihood of approval in March, citing a lack of communication between the SEC and ETF applicants, which he viewed as a negative signal for Ethereum’s immediate ETF prospects.

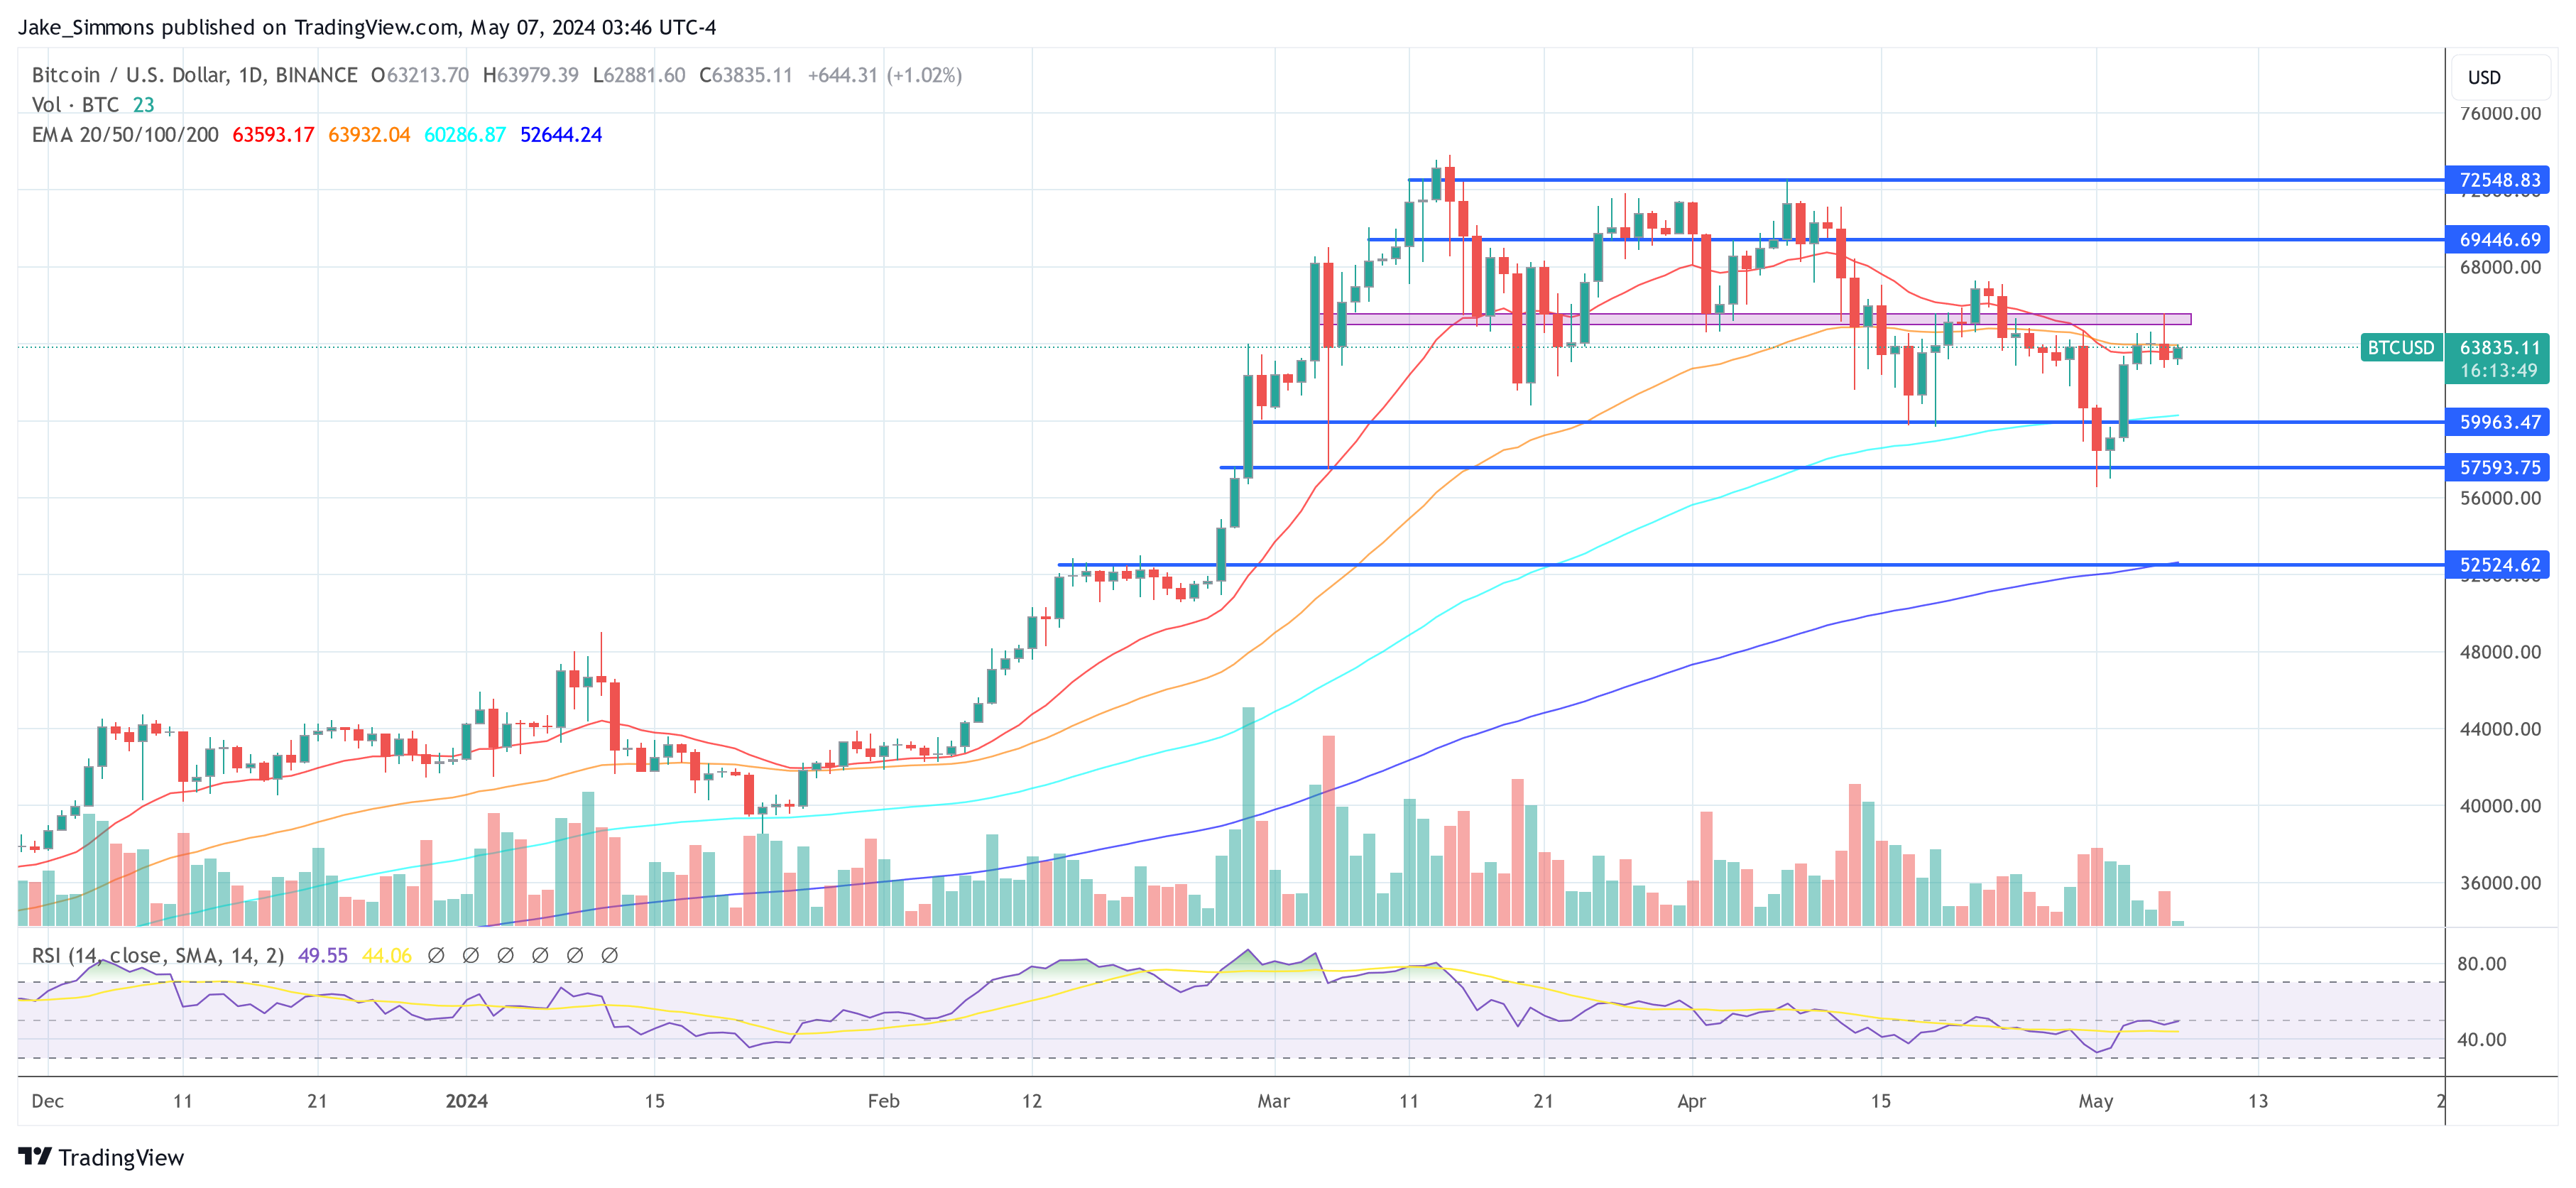
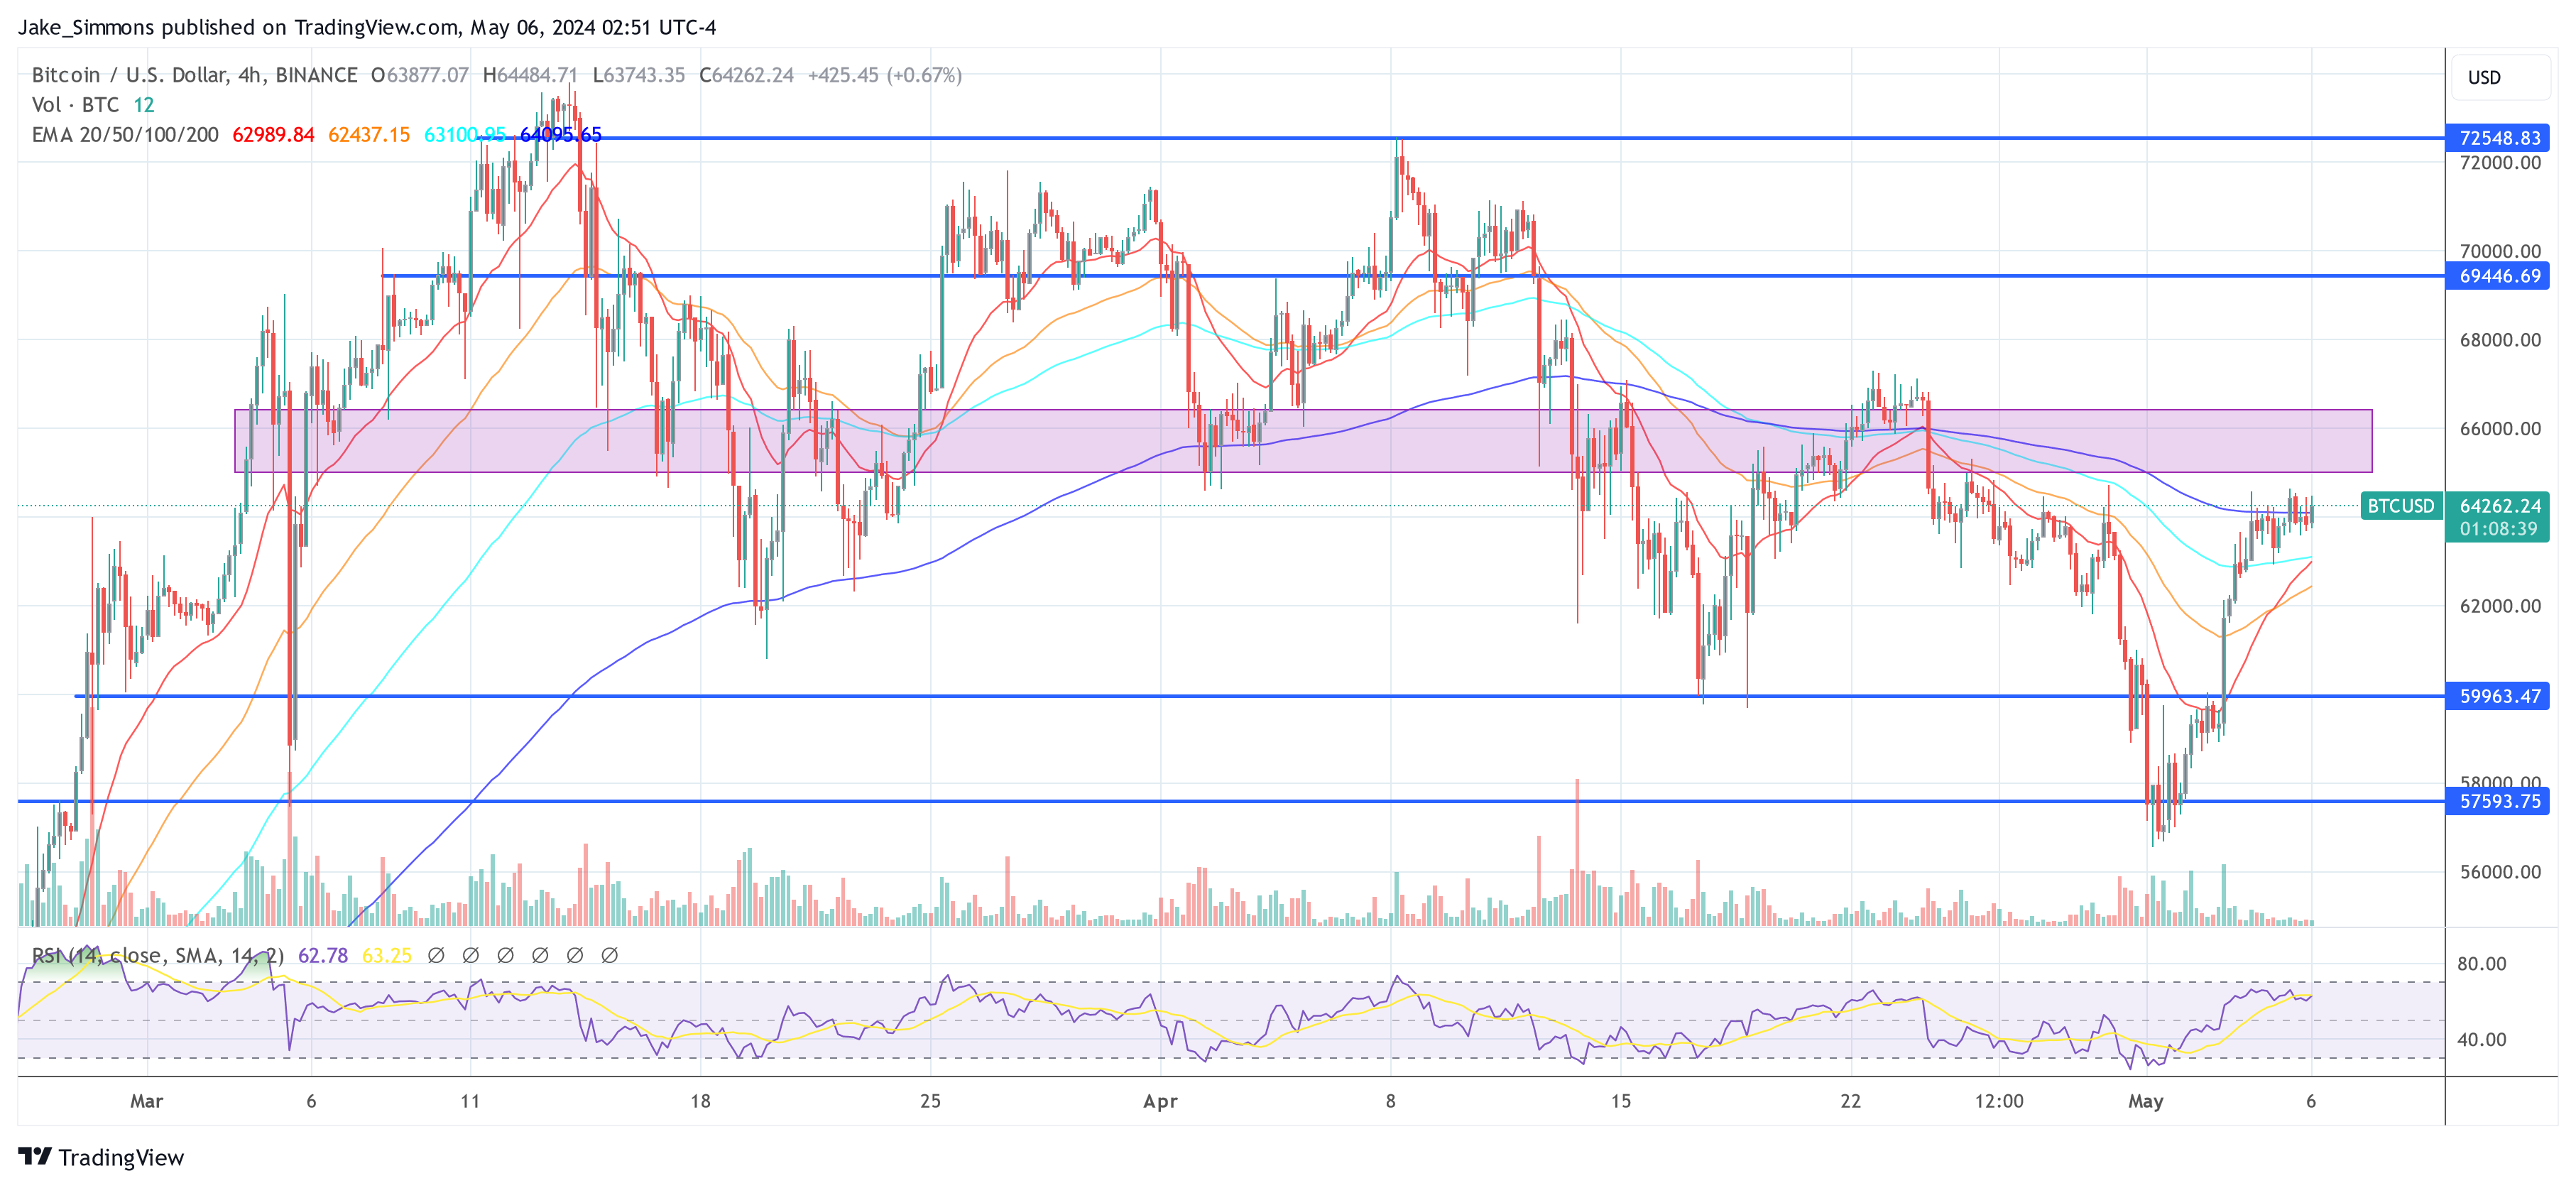
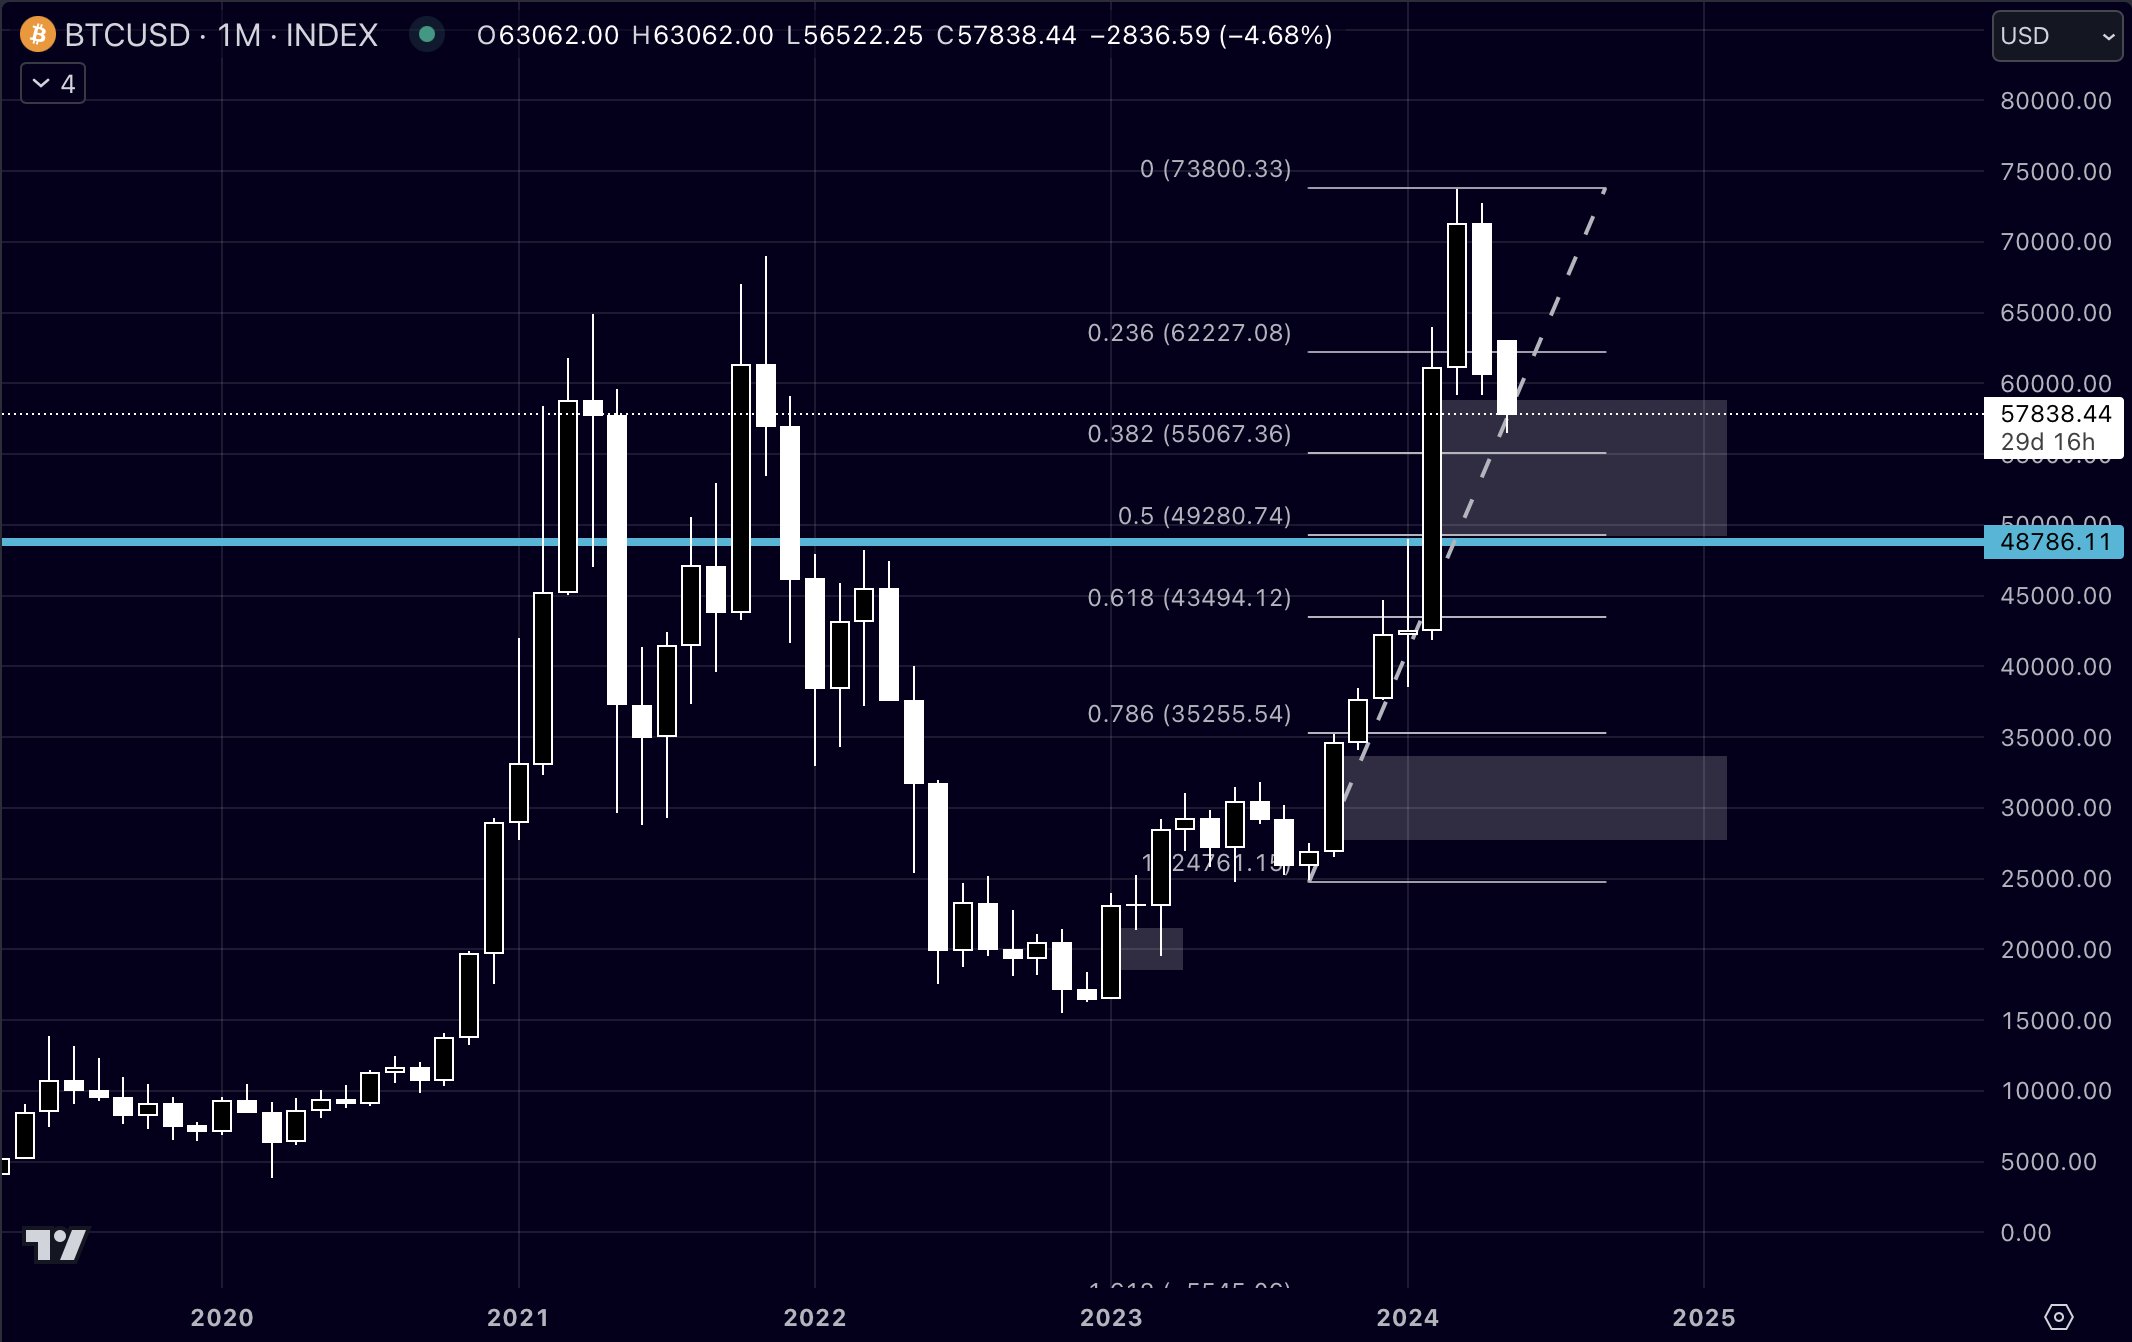
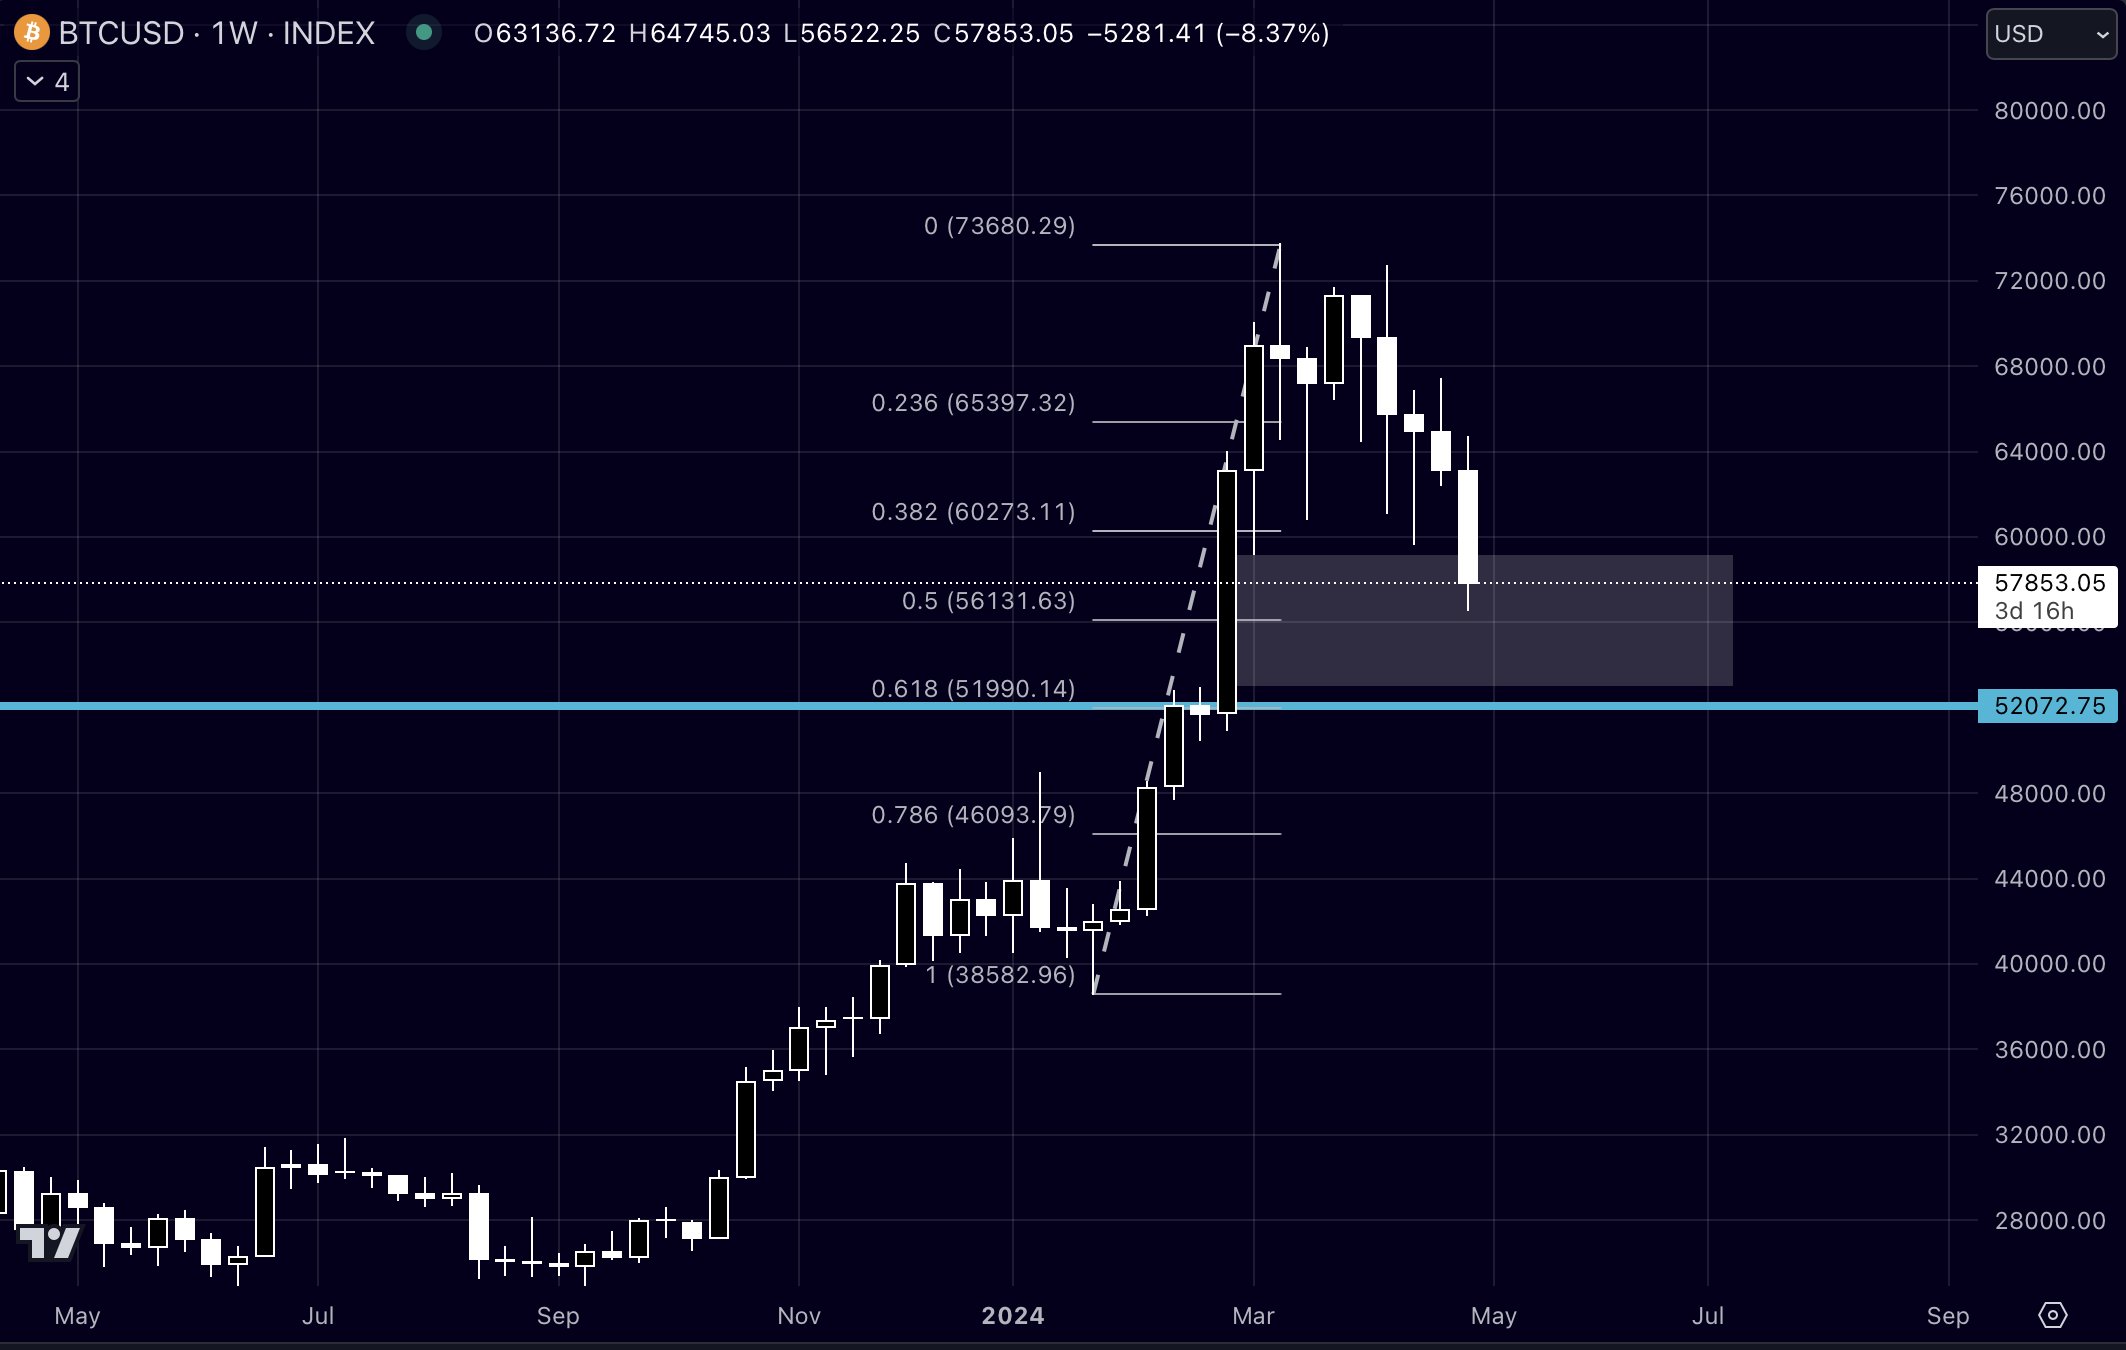
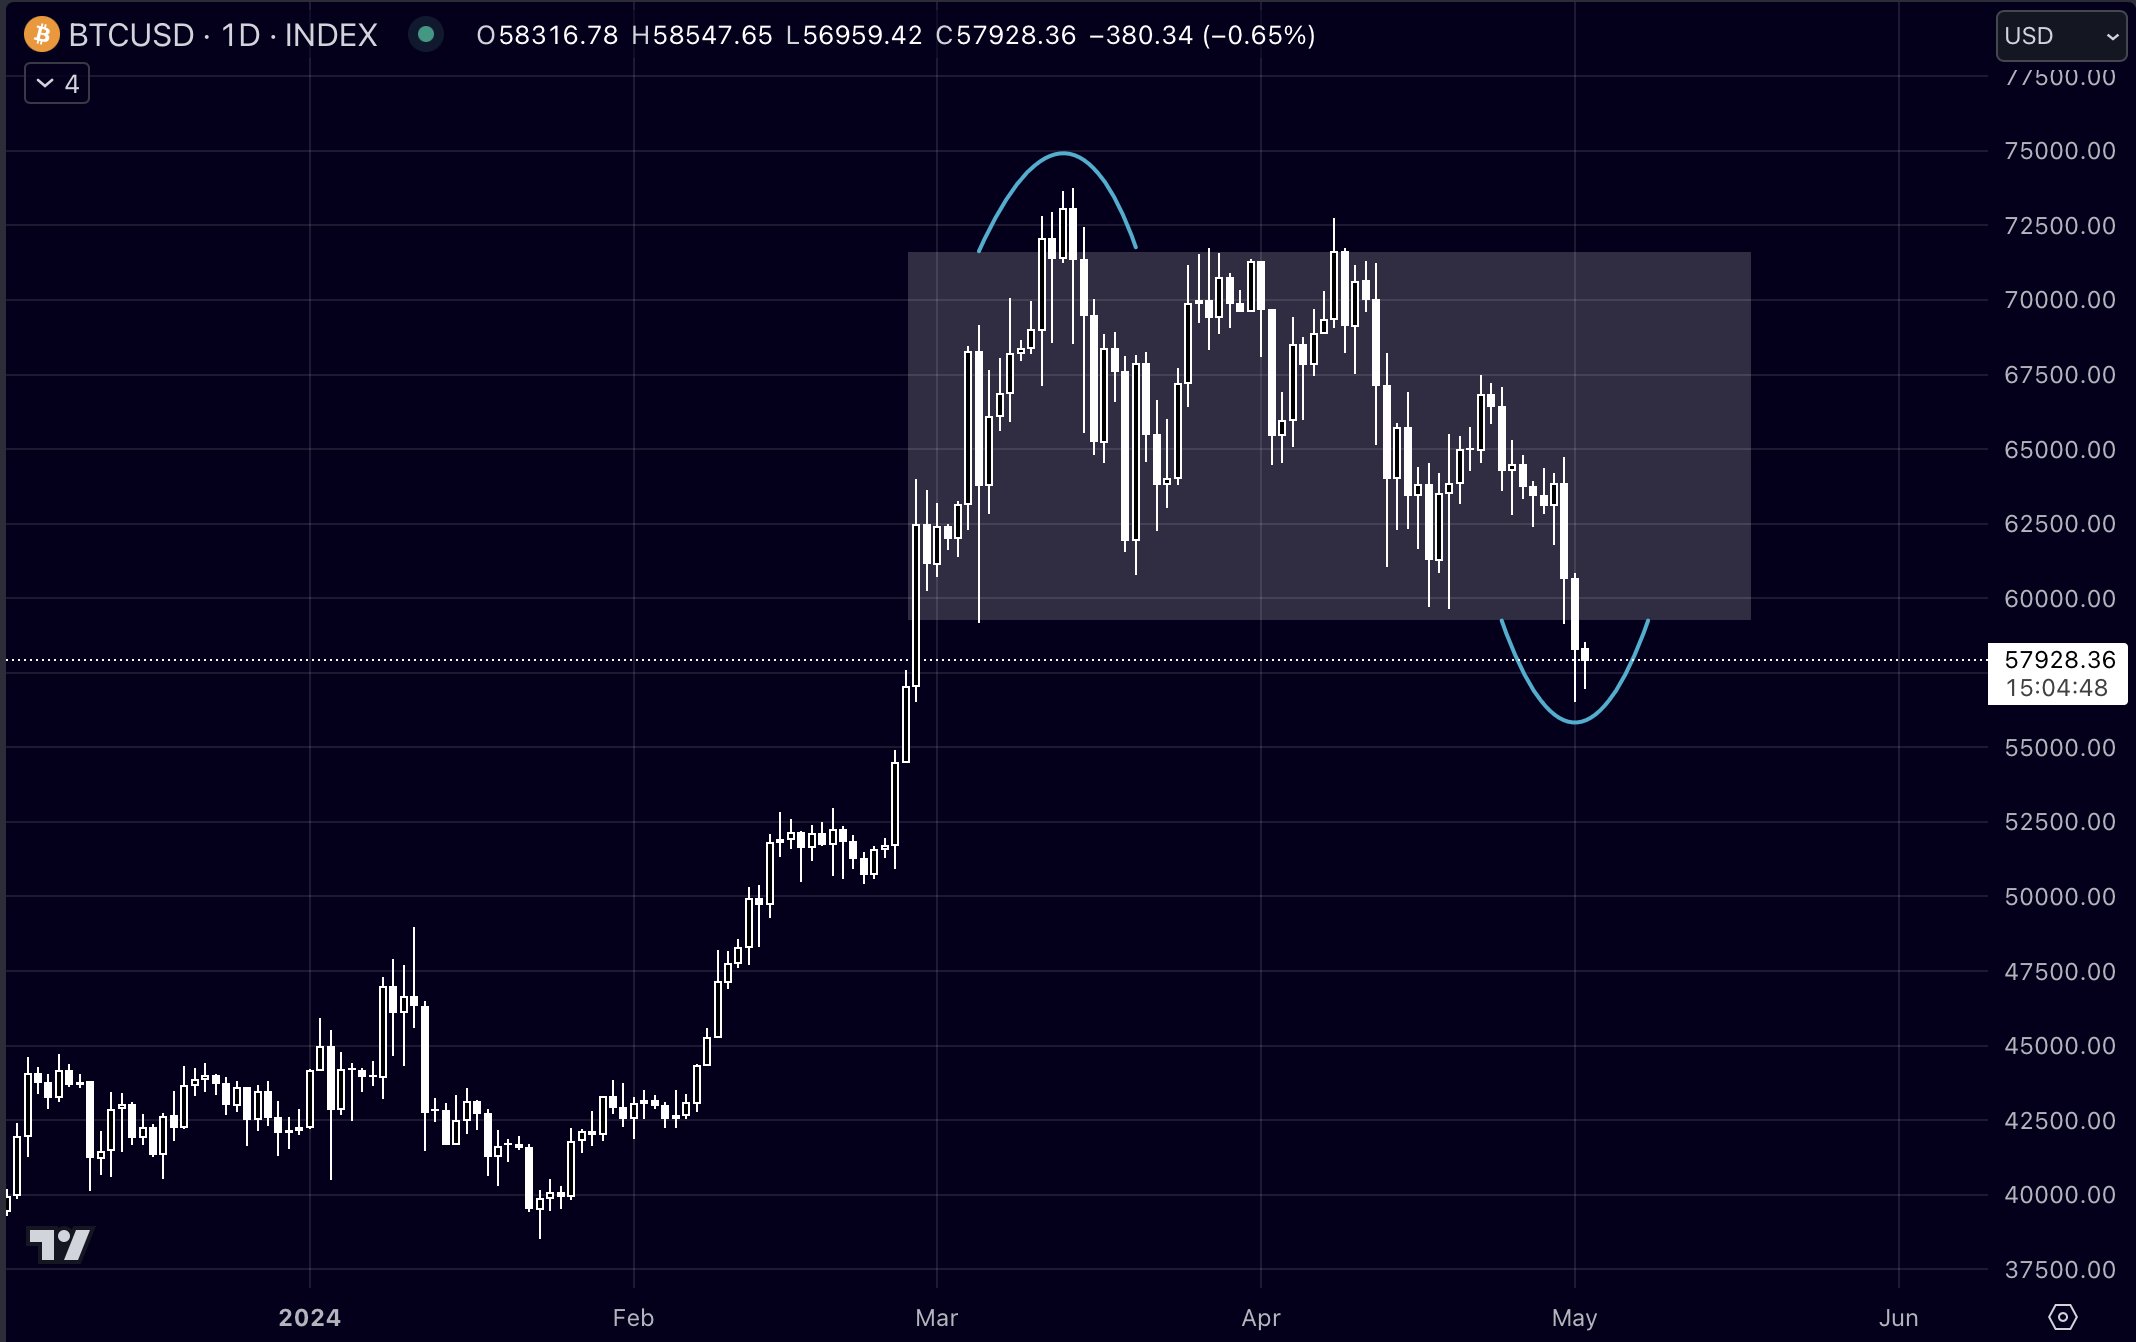
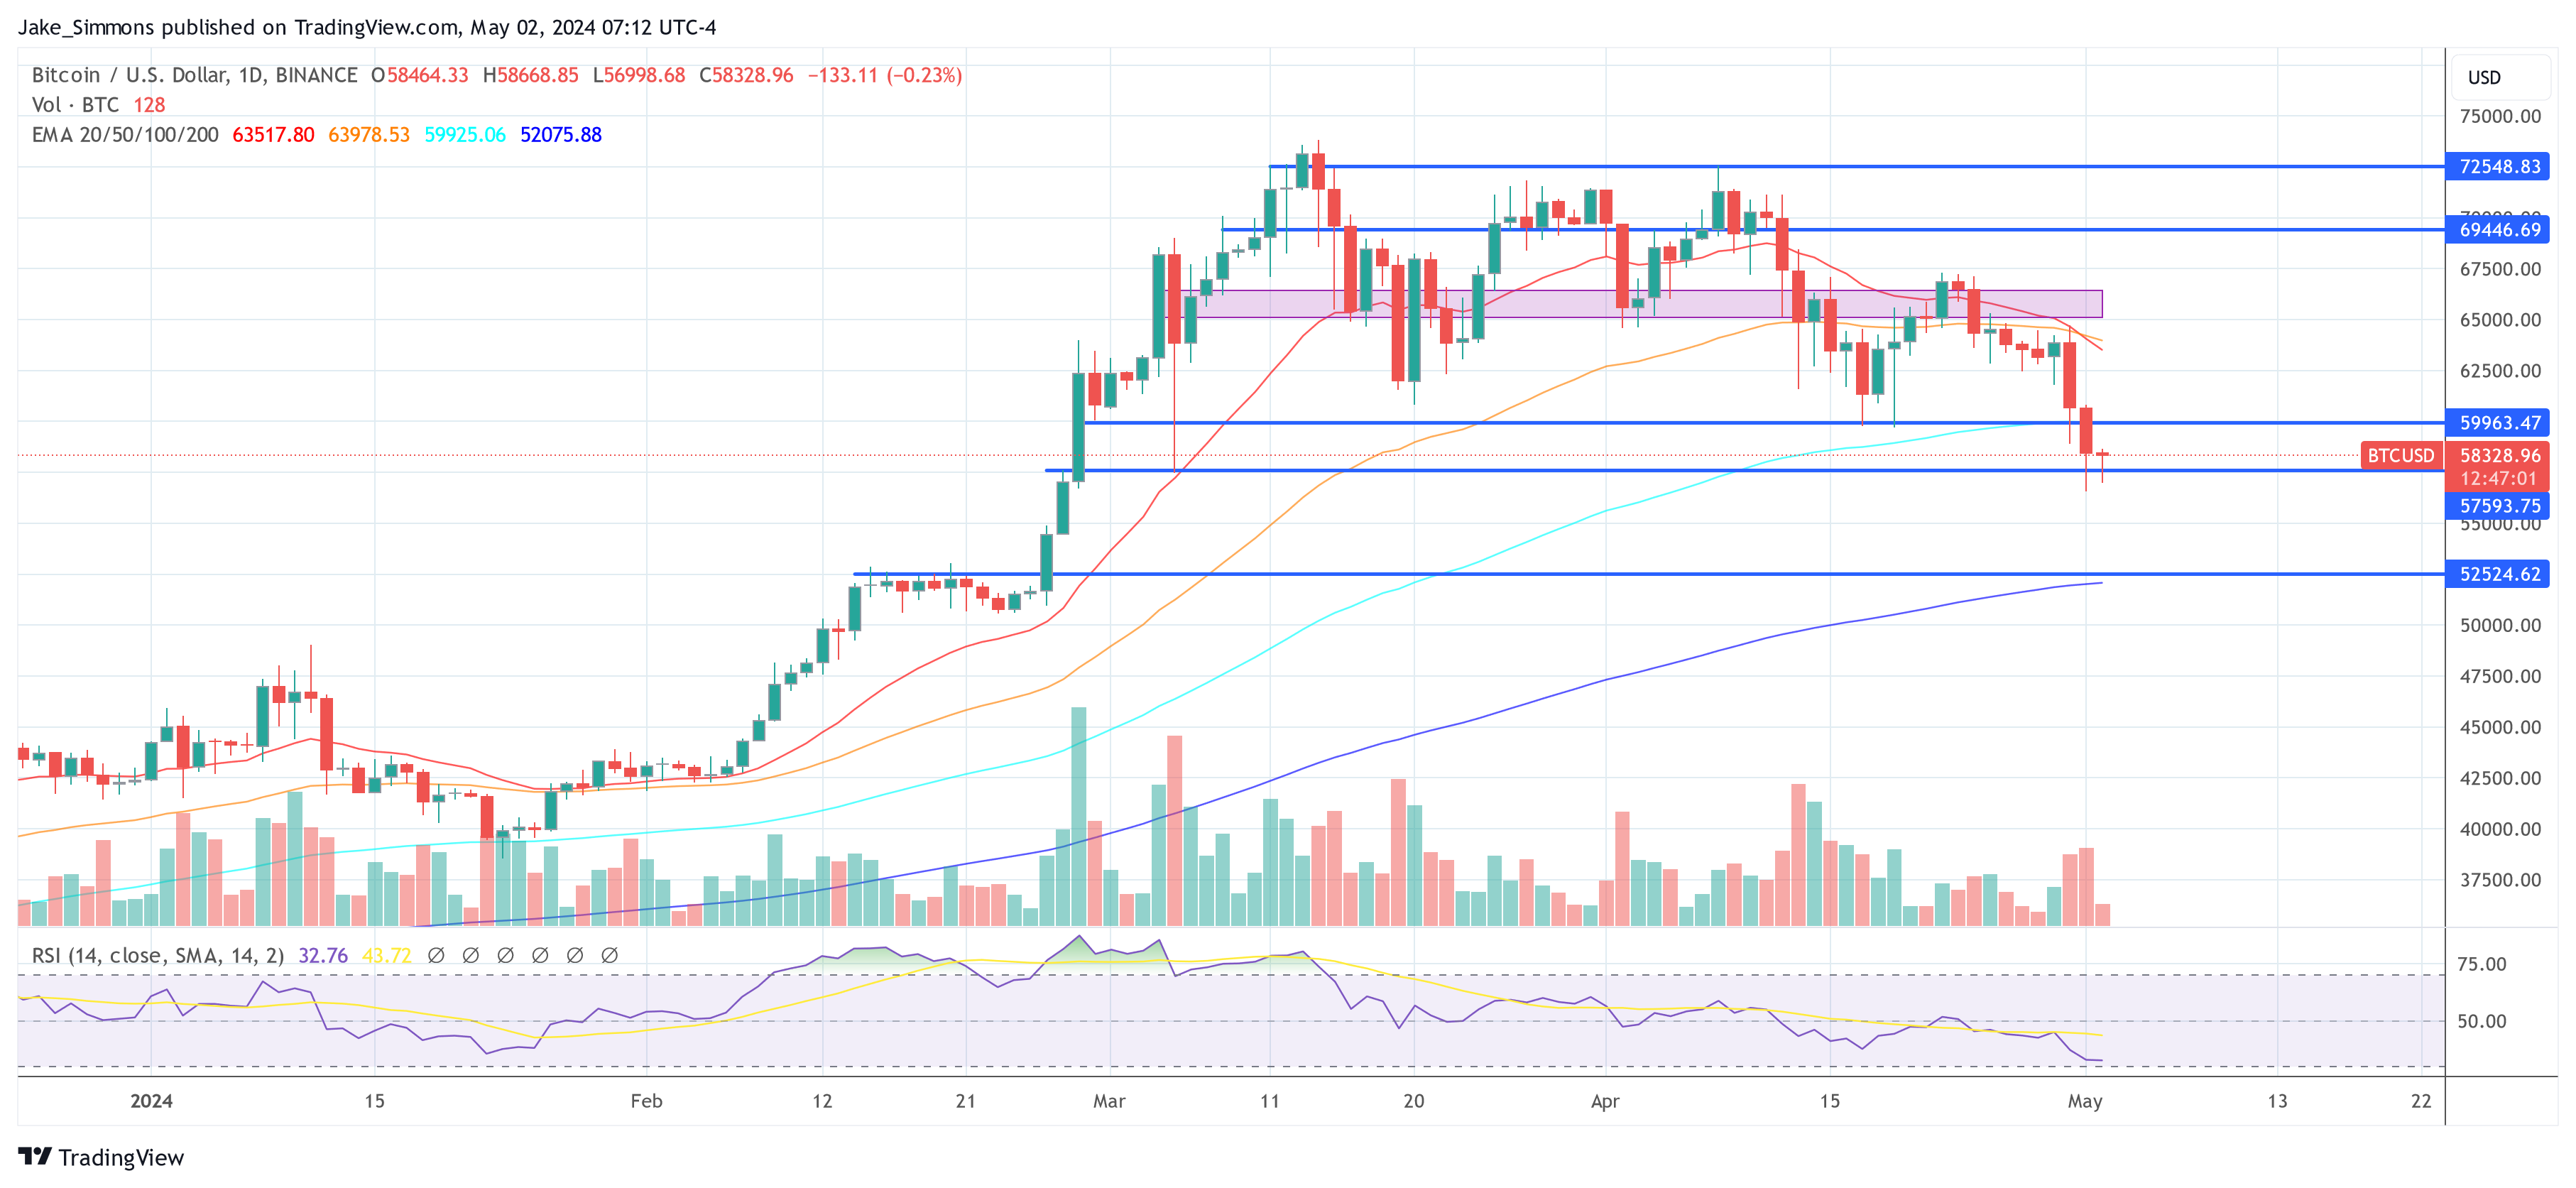
At press time, BTC traded at $63,835.

Bitcoin price

Bitcoin To Reach Escape Velocity? Analyst Makes The Case

An analyst has explained how Bitcoin seems to be showing a good setup to reach escape velocity based on the trend in this indicator.

Bitcoin VWAP Oscillator Has Been Showing A Bullish Divergence

As explained by analyst Willy Woo in a new post on X, a bullish divergence has appeared to be forming in the Volume-Weighted Average Price (VWAP) oscillator of the cryptocurrency.

The VWAP is an indicator that calculates an average price for any given asset, taking into account not only the price but also the volume. More formally, it’s calculated as the cumulative price sum multiplied by the volume divided by the cumulative volume.

This metric puts a higher weight on the price at which more volume is traded. Usually, the exchange-reported volume is used to find the metric, but for a cryptocurrency like Bitcoin, the entire transaction history is visible to the public thanks to blockchain data. Woo has used on-chain volume instead to calculate the VWAP for BTC.

The VWAP oscillator, the actual indicator of interest here, is a ratio between the asset’s spot price and VWAP. Here is the chart shared by the analyst that shows the trend in this metric over the past couple of years:

Bitcoin VWAP Oscillator

As displayed in the above graph, the Bitcoin VWAP oscillator has been in the negative territory for the past month but has recently shown a turnaround.

Although the metric is heading up, it’s still very much contained inside the red zone. At the same time as this rise, the cryptocurrency’s price has been heading down instead.

According to Woo, this is a bullish divergence forming for the asset and it’s also one that has a “lot of room to run,” since tops in the coin have generally occurred when the oscillator has reached a point of reversal at relatively high levels inside the positive zone, which should still be quite far away.

“Seems like a good setup for BTC to reach escape velocity,” notes the analyst. It remains to be seen whether the bullish divergence will end up bearing fruits for the asset.

In some other news, the Bitcoin whales (investors carrying 1,000 BTC or more) participated in buying around the recent lows of the asset. Still, market intelligence platform IntoTheBlock has revealed that the accumulation sprees from these large investors have been displaying an overall downtrend.

Bitcoin Whale Accumulation

From the chart, it’s visible that the Bitcoin whales have been buying at each of the dips in the last few months, but it’s also visible that the scale of this buying has been diminishing with each one.

This could be a sign that the appetite for buying among these investors, although still present, is getting smaller with each dip.

BTC Price

When writing, Bitcoin is trading at around $63,500, up over 1% in the last seven days.

Bitcoin Price Chart

Bitcoin Relative Open Interest Lowest Since Feb, Analyst Says “Hard To Be Bearish”

Data shows the Bitcoin Open Interest as a percentage of its market cap has been at lows recently, a sign the derivatives side has been healthy.

Bitcoin Open Interest Is Now Less Than 2% Of The Market Cap

As explained by analyst James Van Straten in a new post on X, the derivatives side of the market has looked “extremely healthy” while BTC’s latest recovery has occurred.

The metric of interest here is the “Open Interest,” which keeps track of the total amount of derivatives-based Bitcoin positions that are currently open on all centralized exchanges.

When the value of this indicator goes up, it means that the investors are opening up more positions on the market right now. Generally, the total leverage in the market rises when such a trend takes place, so the price of the asset could end up turning more volatile following it.

On the other hand, a decline in the metric suggests users are either closing up their positions of their own volition or getting forcibly liquidated by their platform. The cryptocurrency may behave in a more stable manner following such a decrease.

Now, here here is a chart that shows the trend in the Bitcoin Open Interest over the past few years:

Image

In the graph, the Open Interest is displayed as a percentage of the asset’s market cap (that is, the total valuation of the entire BTC circulating supply at the current spot price).

It would appear that the indicator has registered a drawdown recently and has slipped under the 2% mark. This would suggest that the positions on the derivatives market now make up for less than 2% of the market cap.

From the chart, it’s visible that the metric had earlier spiked to a high as the coin’s rally towards a new all-time high had taken place. Interestingly, the market cap was rapidly going up in this rally, but this ratio was still trending up, implying that speculation had been growing at a rate faster than the price.

This may have been a sign that the derivatives side was starting to become overheated. In the drawdown that had followed the price top, the investors had started getting liquidated, leading to the ratio registering a decline.

The most recent price drop had helped reset the market further, bringing the ratio down to levels not seen since February. Bitcoin has been mounting a recovery effort in the past few days, but so far, the derivatives market has remained cool. “Hard to be bearish here,” says the analyst.

It now remains to be seen if the health of the market would continue to look optimistic in the coming days, thus potentially allowing for the recovery to go a step further.

BTC Price

Bitcoin had returned back above $65,500 earlier, but the asset has since seen a small pullback as it’s now down to $64,100.

Bitcoin Price Chart

Here’s Why This Crypto Analyst Believes Bitcoin Is At A ‘Prime Buy Zone’

Crypto analyst Ali Martinez has revealed that it may still be an excellent time to accumulate Bitcoin. This comes amidst the flagship crypto’s recent price recovery, with the crypto token skyrocketing above $64,000. 

Bitcoin Is Still In A “Prime Buy Zone”

Martinez mentioned in an X (formerly Twitter) post that Bitcoin’s Market Value to Realized Value (MVRV) 90-day ratio indicates that it is still in a “prime buy zone” despite its recent price surge from $57,000 to $64,000. The MVRV is a metric used to determine whether a crypto token is undervalued or overvalued. 

 Bitcoin

Based on Martinez’s findings, Bitcoin looks to be currently undervalued, which presents a good opportunity to accumulate the crypto token. The analyst’s revelation undoubtedly provides reassurance for those who failed to buy the dip and are looking for a perfect entry to invest in Bitcoin. 

Interestingly, Bitcoin whales didn’t waste time accumulating during Bitcoin’s recent decline, as Bitcoinist reported that these investors bought 47,500 BTC ($2.8 billion) between May 2 and 3. However, the MVRV ratio being at that level suggests that many of these whales are investors adding to their positions, meaning that significant buying pressure shouldn’t be expected anytime soon. 

Crypto analyst Michaël van de Poppe also recently suggested that Bitcoin is still undervalued. He noted that the crypto token is back above $60,000, and retail isn’t here yet. He mentioned in another X post that these retail investors won’t return until the summer, which means that everyone currently positioning themselves is still early. 

BTC Almost Ready For Next Leg Up

Crypto analyst Mikybull Crypto recently hinted that Bitcoin is almost ready for another parabolic rally. He stated that Bitcoin’s local bottom is in considering that the “next liquidity grab interest is above.” He added that Bitcoin will first “clear out the $67,000 level and consolidate in preparation for the $73,000 level. 

Related Reading: Fantom Revival: Crypto Analyst Predicts A Jump To $1.2 For FTM Price

Bitcoin 2

Meanwhile, the analyst revealed in another X post that Bitcoin has “finally experienced a MACD (Moving Average Convergence/Divergence) bullish cross” on the daily chart, just like it did in January 2024, which led to the crypto token rising to as high as $73,000 in March. According to Mikybull Crypto, Bitcoin reclaiming above the 50-day Moving Average will “further confirm the bullish continuation.”

For those looking to long Bitcoin, Mikybull Crypto remarked that the $64,000 range is an “ideal zone” to do so. He predicts that Bitcoin might clear out the CME gap between $62,580 and $64,105 before consolidating at around $64,000. 

At the time of writing, Bitcoin is trading at around $65,300, up over 2% in the last 24 hours, according to data from CoinMarketCap. 

Bitcoin price chart from Tradingview.com

Here’s When Bitcoin Could Peak In This Accelerated Bull Run: Analyst

The current Bitcoin price behavior and its deviations from expected cyclical patterns remain a central theme of analysis. Crypto analyst Rekt Capital (@rektcapital) recently shared new insights on X concerning Bitcoin’s potential peak during the ongoing bull run, which is progressing at an atypical pace compared to historical data.

When Will Bitcoin Peak This Cycle?

In a detailed post, Rekt Capital pointed out that as of mid-March 2024, Bitcoin had not only reached new all-time highs but had done so approximately 260 days ahead of its traditional halving-induced cycles. This marked a significant acceleration. “When Bitcoin rallied to new All Time Highs in mid-March 2024, Bitcoin was accelerating in its cycle by 260 days compared to traditional Halving Cycles,” stated Rekt Capital.

However, this rapid pace has not been sustained. Over the past two months, Bitcoin has been in a phase of consolidation, which has altered its trajectory. The acceleration advantage has decreased to about 210 days compared to previous cycles. This deceleration is a critical factor, as it could lead to a re-synchronization with the typical halving cycle. Typically, BTC peaks 518-546 days after a halving event.

The analyst suggests shifting the predictive focus from just halving events to the periods after Bitcoin surpasses its previous all-time highs. Historically, BTC price tends to reach a bull market top within 266 to 315 days after breaking these thresholds. Given that this milestone was achieved again in mid-March 2024, the projected window for the next bull market peak could be set between late November 2024 and late January 2025.

Nevertheless, a notable trend is the increasing duration for which Bitcoin maintains levels beyond its old highs. In 2013, this period lasted 268 days, in 2017 it extended to 280 days, and by 2021, it had increased to 315 days.
This pattern suggests an incremental extension of approximately 14 to 35 days per cycle. “Historically, the amount of days that Bitcoin has spent beyond old All Time Highs has increased by approximately 14 days to 35 days,” explained Rekt Capital.

Adding these increments to the initial range of 266 to 315 days post-old highs, the peak could potentially extend to between 280 and 350 days post-breakout. This adjustment shifts the expected peak time frame to between mid-December 2024 and early March 2025.

Bitcoin cycle analysis
Potential Synchronization With Halving Cycles

Despite the current accelerated cycle, there remains a possibility that further deceleration could align Bitcoin more closely with its halving cycle. In past cycles, such as those between 2015-2017 and 2019-2021, Bitcoin peaked at 518 and 546 days post-halving, respectively. If Bitcoin’s rate of acceleration continues to decrease, the cycle may eventually resynchronize, potentially delaying the peak to between mid-September and mid-October 2025.

Rekt Capital elaborates, “But if Bitcoin continues to reduce its current acceleration in the cycle, it would resynchronize with traditional Halving cycles.” This could result in a peak more aligned with historical patterns, diverging from the current accelerated timeline.

At press time, BTC traded at $64,262.

Bitcoin price

Bitcoin Relative Strength Jumps To 40%: 10x Research Reveals Next Steps From Here

Crypto research platform 10x Research recently noted that the Bitcoin Relative Strength has jumped to 40%. In line with this, they provided insights into what major moves the flagship crypto might make soon enough. 

What Next For Bitcoin?

In their newsletter titled “Fake Dip?” 10x Research drew the crypto community’s attention to the fact that Bitcoin has historically experienced potential rallies whenever its relative strength index (RSI) drops to 40%. As such, there is the possibility that BTC could again rally following its recent decline. 

The research platform warned that a “line in the sand” at the $62,000 mark could keep the flagship crypto from rallying. However, Bitcoin has already broken above that level, which could mean there is still a bullish sentiment around the crypto token. 

Meanwhile, the research hinted that BTC would need a catalyst to enjoy a sustained rally. They highlighted four bullish events that helped Bitcoin enjoy a parabolic run soon after breaking a vital support level. These events included Treasury Secretary Janet Yellen’s bid for uncapped deposit insurance, BlackRock’s application for a Spot Bitcoin ETF, Franklin Templeton also filing for a Spot Bitcoin ETF, and when US Core PCE dropped below 3.0%.

This echoes the sentiment of Andrey Stoychev, Head of Prime Brokerage at Nexo, who previously mentioned that Bitcoin would need a catalyst to make a significant move to the upside. He predicts that Bitcoin will only continue to trade around the $67,000 range without this catalyst. 

10x Research didn’t sound optimistic about BTC enjoying a sustained rally, as their trend model indicates that the flagship crypto is in a downtrend. Despite that, they are not ruling out the possibility of BTC experiencing a bullish reversal. The research firm also revealed that they would look to buy the dip if Bitcoin drops significantly or rallies from here. 

BTC Still Destined To Hit New Highs

Crypto analyst Mikybull Crypto recently suggested that Bitcoin will still hit new highs. He stated that Bitcoin’s current price action is meant to create “more fear across the market and then bottom for upward continuation.” Crypto analyst Ali Martinez also recently suggested that the bull run was far from over, bearing in mind that Bitcoin consolidated around this period in the last two bull runs. 

He claimed that BTC might be over 500 days away from hitting its market top for this cycle. As to how BTC could rise, Martinez mentioned that it could hit a new all-time high (ATH) of $92,190 if it breaches the resistance level of $69,150. It is also worth noting that crypto analyst PlanB stated that Bitcoin hitting $100,000 this year is “inevitable.”

At the time of writing, BTC is trading at around at around $63,500, up over 7% in the last 24 hours, according to data from CoinMarketCap.

Bitcoin price chart from Tradingview.com

Analyst Says Bitcoin Price Is Headed To $90,000, Here’s Why

Bitcoin is now at a critical junction, which many determine its price trajectory for the rest of the year. The crypto has managed to return into $60,000 territory after dropping down to $56,000 for the first time since April. Some analysts are of the notion that the Bitcoin bulls haven’t actually started on their momentum yet, with many expecting a surge above $74,000 in the coming weeks. 

According to a crypto analyst, impulse waves formed by Bitcoin over the past 1.5 years are indicating that the price of Bitcoin will soon jump to between $90,000 and $100,000. 

Bitcoin To $90,000

A crypto analyst known pseudonymously as TechDev recently shared a Bitcoin price outlook on social media platform X with over 448,000 followers. Interestingly, his analysis is based on Elliot impulse waves, a technical analysis tool that has become extremely popular among crypto analysts when forecasting Bitcoin’s price. 

According to the BTC/US Dollar 2D timeframe shared by the analyst, Bitcoin has been forming impulse waves on an uptrend since May 2023. The chart indicated that the recent correction since Bitcoin reached an all-time high of $73,780 is the fourth impulse wave formation, which is generally known to be a corrective wave. Interestingly, the asset is now at a critical junction after bouncing up at $56,800. 

As noted by the analyst, Bitcoin is set to form its fifth (bullish) impulse wave and go parabolic in the coming months. The first price target is around $90,000 to $100,000 in the short term. The second price target is around the projected peak of the fifth impulse wave, which sits just below $150,000.

TechDev’s analysis is based on a similar five-impulse wave formation in the 2020 to 2021 bull market cycle. A similar fourth impulse wave correction during this period saw Bitcoin falling from $41,000 to $29,000 in early 2021. However, a rebound led to the formation of a fifth (bullish) impulse wave, pushing the price of Bitcoin to its former all-time high. 

What’s Next For Bitcoin Price?

At the time of writing, Bitcoin is trading at $63,275 and up by 6% in the past 24 hours. Since the launch of Spot Bitcoin ETFs in the US, Grayscale’s GBTC recorded its first day of inflow, totaling $63 million on May 3. Investors are hopeful and speculating how this might kickstart a new bull run for the cryptocurrency.

According to an analyst, Bitcoin has successfully defended a correction below the 21-day exponential moving average (EMA). The next step is crossing above resistance around $63,488. 

Bitcoin price chart from Tradingview.com

Bitcoin Price Surges Towards $61,000, Eyeing Potential Breakout To $67-$68k Range

Bitcoin (BTC), the largest cryptocurrency in the market, has experienced a notable resurgence in its bullish momentum, with the Bitcoin price reclaiming the crucial $61,000 threshold. 

This recovery follows a week-long downtrend that led to a 20% drop to $56,000 on Wednesday. As the bullish momentum returns, the possibility of further testing upper resistance levels and reclaiming previously lost price levels grows stronger.

Bitcoin Bulls Eye $68,000

According to market expert Justin Bennett, a recovery of the $61,000 resistance level would open up potential areas such as $67,000 to $68,000. However, at the present moment, this level continues to pose a significant resistance.

Analyzing the recent correction in the Bitcoin price, analyst Crypto Con suggests that the market correction was necessary for the long-term price trajectory. 

The full retest of the 20-week Exponential Moving Average (EMA) support at $56,700 and the return to indicator support zones, such as the Directional Movement Index, indicate a healthy price consolidation.

In addition to the technical indicators, on-chain and market data analytics firm CryptoQuant’s founder and CEO, Ki Young Ju, highlights the current bullish sentiment. 

Bitcoin price

According to their data, whales accumulated a significant amount of Bitcoin, totaling 47,000 BTC, within the past 24 hours. This increased accumulation by large investors further bolsters the positive outlook for Bitcoin’s price.

Bitcoin Price Poised For Bullish Surge

Crypto analyst Titan of Crypto has provided further bullish predictions for the Bitcoin price, suggesting that recent corrections have resulted in the grabbing of leverage longs liquidity. In addition, the Stochastic Relative Strength Index (RSI)on the 5-day chart is on the verge of crossing into bullish territory. 

This occurrence has historically been followed by an upward price movement in Bitcoin, leading to higher highs. Such a pattern has the potential to fuel renewed investor confidence and attract further buying pressure.

Another positive signal highlighted by Titan of Crypto is the recent buy signal generated by the Supertrend indicator, as seen in the chart below. This technical tool helps identify trends in an asset’s price movement. 

Bitcoin Price

The buy signal, which occurred just three months ago, implies that Bitcoin may still have significant room for growth before reaching its cycle top. According to the analyst, historical data suggests that the average duration from the buy signal to the cycle top is approximately 19 months, indicating the potential for a sustained upward trend.

Bitcoin price

Currently trading at $61,600, Bitcoin has seen a significant increase of 4.7% in the last 24 hours alone. It remains to be seen if BTC will successfully break above resistance levels, while also challenging the ability of previously retested support levels to withstand potential future downtrends.

Featured image from Shutterstock, chart from TradingView.com

Crypto Expert Turns Bullish On Bitcoin, Predicts Quantitative Easing Will Begin Soon

Crypto expert Michaël van de Poppe has made a bullish case for Bitcoin as he alluded to macroeconomic factors that could soon play out in the flagship crypto’s favor. In line with this, he urged Bitcoin investors to take action with a parabolic surge on the horizon. 

An Imminent Quantitative Easing Would Be Good For Bitcoin

Van de Poppe suggested in an X (formerly Twitter) post that Bitcoin will rise on the back of a Quantitative Easing (QE), which he anticipates is “close.” He noted that the Fed has already started to “unwind Treasury buybacks and is reducing QT [Quantitative Tightening].” He claims this is happening because the economic data has worsened, which puts the US at risk of a recession. 

Therefore, the Fed seeks to avoid this recession by buying back long-term government bonds and injecting liquidity into the financial system. As the crypto expert predicts, this could be good since it will force the Fed to take a more dovish stance and possibly lower interest rates, boosting investors’ confidence to go all in on risk assets like Bitcoin. 

Van de Popper further predicts that this Quantitative Easing will become evident in the data released in the coming months. In line with this, he advised investors to long Bitcoin. It is worth noting that Bitcoin dropped to as low as $57,000 ahead of the latest FOMC meeting, with many investors seeming to have anticipated a hawkish stance from the Fed. 

However, as the crypto expert noted, the rates remain unchanged, and Fed Chair Jerome Powell raised the possibility of a rate cut as early as June. Given Bitcoin’s price recovery since then, this development looks to have already revived a bullish sentiment among investors. 

What To Expect Going Forward

In another X post, Van de Popper revealed his expectations for the crypto market going forward. He stated that Bitcoin will consolidate and go sideways (possibly ahead of the QE which will boost its price in the coming months. Meanwhile, he also expects Altcoins to “heavily outperform and rotation kicks in.”

The crypto expert had previously echoed a similar sentiment when he stated that he expects altcoins to bounce in their Bitcoin pairs while Bitcoin faces a period of consolidation that he doesn’t expect to change in the “coming months.” 

Back then, he also mentioned that there would be a narrative shift to Ethereum, and he reaffirmed this belief in a more recent X post, stating that he expects a lot from the second-largest crypto token by market cap.  

At the time of writing, Bitcoin is trading at around $59,100, up over 2% in the last 24 hours, according to data from CoinMarketCap. 

Bitcoin price chart from Tradingview.com

Bitcoin Bottom In? Retracement From $73,800 Is Deeper And Took Longer To Form

Some analysts were frightened by the recent drop in Bitcoin prices. Though the coin is showing signs of strength, multiple leveraged longs were liquidated early this week.

In a post on X, one analyst thinks Bitcoin might have just found support, bottoming up after the contraction this week, pushing it lower from the multi-week range established in mid-March through to the better part of April.

 Bitcoin Retracement Is Deeper And Took Longer: Bottom In?

Expressing confidence, the analyst cited a historical pattern. Based on a price action assessment in the weekly chart, the analyst notes that whenever Bitcoin posts a deep retracement, there is usually a higher probability of the coin bottoming up and shaking off weakness.

At the same time, prices tend to recover after a retracement that takes longer than expected. 

BTC retracements over time | Source: Analyst on X

Building on their historical pattern observation, the analyst applied it to the current BTC situation. The trader said up to the current level, the retracement from an all-time high is deeper and also took longer than usual, spanning several weeks. As a result, the analyst projected a high likelihood that Bitcoin prices might have found a bottom. 

While confidence abounds, it is still challenging to pick bottoms. Bitcoin and crypto assets are volatile, with prices moving quickly in either direction. At spot rates, Bitcoin is trading above $60,000, reversing losses of May 1.

Even though this might cement the analyst’s position, BTC remains within a bear breakout formation, defined by the wide-ranging, high-volume bear bar of April 30.

Bitcoin price trending upward on the daily chart | Source: BTCUSDT on Binance, TradingView

Moreover, the coin is still boxed away from the April trade range, suggesting that weakness remains. Should there be a conclusive close above $62,000, the trend will likely shift in favor of bulls, reversing the losses of April 30.

Before then, aggressive traders might be unloading at higher prices, aligning with the current bearish formation.

Market Forces Will Shape BTC Prices

Despite the bearish outlook, most analysts are bullish, expecting a sharp price recovery. One of them took to X, suggesting that buyers will likely take charge if prices recover from spot rates and return to the horizontal range of March to April.

BTC must move back to range for uptrend continuation | Source: Analyst on X

The pace and direction at which prices move going forward lean on market factors. So far, spot Bitcoin exchange-traded fund (ETF) issuers are decreasing their holdings.

At the same time, the United States Federal Reserve is tracking inflation and other metrics as they tune monetary policy. If inflation drops, the USD will likely strengthen, heaping more pressure on the world’s most valuable crypto.

Standard Chartered Bank Analysts Sound Warning Alarm: Bitcoin Price Can Still Drop To $50,000

Leading international cross border bank, Standard Chartered has predicted steep price declines for Bitcoin, foreseeing a pessimistic future outlook for the pioneer cryptocurrency amidst broader market downturn.

Bitcoin Could Plummet To $50,000

As of writing the price of Bitcoin is trading above $59,000, according to CoinMarketCap. The cryptocurrency has been experiencing massive price drops after the Bitcoin halving on April 20, 2024, further exacerbated by the Federal Reserve’s (FED) decision to keep interest rates unchanged during the Federal Open Market Committee (FOMC) meeting On Wednesday, May 1.

Standard Chartered bank has cautioned investors of more price drops in the future, predicting that Bitcoin’s price could settle between $50,000 and $52,000, recording more than $20,000 loss from it’s all time high of over $73,000 in March, 2024. This new forecast follows the bank’s previous projection which anticipated Bitcoin rise to $150,000 by the end of 2024.

The head of Standard Chatered’s forex and digital assets research, Geoffery Kendrick revealed a combination of factors that could drive Bitcoin’s decline in a statement to The Block on Wednesday. Kendrick highlighted broader macroeconomic influences and crypto-specific factors impacting the price of Bitcoin, particularly challenges like the reduction of liquidity measures within the United States since mid-April.

“Liquidity matters when it matters, but with a backdrop of strong US inflation data and less likelihood of Fed rate cuts, it matters at the moment,” Kendrick stated.

Standard Chartered also cited the series of massive outflows witnessed by Spot Bitcoin ETfs in the US, as well as the lackluster performance of Ethereum Spot ETFs in Hong Kong, China. 

On May 1, approximately 10 US Spot Bitcoin ETFs recorded staggering outflows, collectively totaling $563.7 million. Kendrick also disclosed that “more than half of the Spot ETF positions are underwater.” He suggests that the risk of liquidity should be considered, especially as investor sentiment may be shifting away from these digital assets.

BTC Price Jumps Over $1,000 Amidst Market Downturn

At some point on May 2, Bitcoin had witnessed significant price decreases that pushed its value below $58,000. However, currently the cryptocurrency has recorded more than 1.56% increase, spiking by more than $1,000 in just a day. 

Various analysts have predicted more plunges for the cryptocurrency, expecting Bitcoin to reach its bottom during this bearish period. Analysts like Ali Martinez and Michael van de Poppe anticipate a few more price corrections before the broader market settles, paving the way for Bitcoin to prepare for a potential bullish rebound.

Bitcoin price chart from Tradingview.com

Bitcoin’s Make-Or-Break Moment: Trading Guru Predicts Rally Amid Market Uncertainty

Seasoned trader Peter Brandt has reignited discussions with a bullish Bitcoin forecast that could see the premier cryptocurrency soar to new heights.

Amid skepticism and divergent market opinions, Brandt’s projection places Bitcoin on a potential path to reclaim its all-time high near $74,000.

Brandt’s Bullish Bitcoin Vision

Peter Brandt, synonymous with market foresight, recently outlined a scenario where Bitcoin could experience a significant rally.

His analysis, shared via a social media post on X with a BTC analyzed chart, suggests Bitcoin’s recent price movements align with patterns historically indicative of a bull market’s continuation.

Despite the market’s recent downturns, Brandt’s projection points towards a potential surge to $74,000, a figure mirroring Bitcoin’s peak valuation.

While Brandt’s optimistic outlook for Bitcoin has garnered attention, it also faces scrutiny from parts of the crypto community. Critics point to his past predictions, including significant downturns and peak valuations, as a reason for caution.

In response, Brandt emphasizes the critical role of adaptability in trading, noting:

I can tell you know that you will end up losing all your capital. I’ve supported myself by trading for 50 years and know that successful traders have and execute the ability to be flexible. I’ll welcome your money.

Split On Market Forecast

Meanwhile, the broader crypto analyst community remains divided. Some echo Brandt’s sentiments, seeing the market’s current state as a temporary correction before a bullish reversal.

Others, like analyst Scott Melker, suggest more bearish outcomes. They note the absence of key support levels that could lead to further declines if not held. Melker’s analysis indicates that, without these supports, Bitcoin could freefall to as low as $52,000.

Further complicating the landscape are indicators like the Relative Strength Index (RSI), which Melker points out has not reached oversold levels — typically a sign of a potential rebound.

This absence suggests a tepid confidence among investors, potentially paving the way for further price drops.

Despite the debates and technical analyses, the sentiment among some traders remains buoyantly optimistic. Traders like Marco Johanning argue that the structural market dynamics still favor a bull market scenario. This suggests that Bitcoin’s current price adjustments are part of a broader upward trend that will resume soon.

Bitcoin (BTC) price chart on TradingView

Featured image from Unsplash, Chart from TradingView

Bitcoin Loses Historical Level, Analyst Says “Reclaim And Bounce, Or Die”

An analyst has pointed out how Bitcoin recently closed below a historically important on-chain level, a failure to reclaim which could spell trouble for BTC.

Bitcoin Fell Below Short-Term Holder Cost Basis In Latest Crash

In a new post on X, Maartunn discussed BTC’s recent close below the realized price of the short-term holders and stressed its importance in reclamation.

The “realized price” here refers to an on-chain indicator that tracks the price at which the average investor on the Bitcoin network acquired their coins. In other words, it measures the average cost basis in the BTC market.

When the spot value of a cryptocurrency is below this metric, it means that the average investor in the market is carrying their coins at a loss right now. On the other hand, being above the indicator suggests that the holders as a whole are in the green currently.

In the current topic, the realized price of the entire Bitcoin market isn’t of interest but rather of only a subsection: the short-term holders (STH).

The STHs are the BTC investors who bought their coins within the past 155 days. These holders represent the inconsistent side of the market, who easily show a reaction whenever a change like a crash or rally occurs in the sector.

Now, here is a chart that shows the trend in the realized price specifically for these investors over the past year:

Bitcoin STH Realized Price

The realized price of the Bitcoin STHs is floating around $58,500. During the latest crash, Bitcoin went as low as below $57,000, meaning that the plunge has put these investors under pressure.

Historically, the average cost basis of the STHs has been significant for the cryptocurrency, as it has taken turns acting as support and resistance, depending on the market’s phase.

During bullish trends, this metric often acts as a point of support. The chart shows that when Bitcoin had declined near this level earlier in the year, it had found a rebound.

The metric acts as resistance during bear markets, keeping the price below it. These patterns may be related to how investor psychology works.

In bullish periods, the STHs might view their cost basis as a profitable buying opportunity, so they accumulate during dips in it, thus helping the price turn around. In bear markets, these investors could look at the level as a point of exit, as they may not believe the price will go up any further.

After closing below the STH realized price earlier, Bitcoin is now fighting to reclaim this historical level. It now remains to be seen if support will once again be found or if the level will truly become lost.

BTC Price

Bitcoin has climbed back above the STH realized price, trading above $59,300. This is certainly a sign in the positive direction, but it’s hard to say whether this recovery will last.

Bitcoin Price Chart

Bitcoin Slump Pushes New Whales Underwater: A Rare Opportunity To Buy?

As Bitcoin slumps, on-chain data by Ki Young Ju, the founder of the blockchain analytics platform CryptoQuant, paints a stark picture: all new whales, including holders of spot exchange-traded funds (ETFs), are now underwater. 

New Whales And Spot ETF Investors Are In Red

Taking to X, Ju said that more losses would be incoming, predicting that HODLers will find “max pain” at around $51,000. The dip is less than $10,000 from spot rates, suggesting that although there are cracks, the correction might not be deep.

This overview is welcomed, considering the recent sell-off. Even so, predicting price bottoms in a fast-moving market influenced by multiple forces is tough.

New BTC whales are underwater | Source: Ki Young Ju on X

As price action stands, Ju says believers may take the opportunity to double down on the coin. The founder adds that the current price discount presents an opportunity for savvy investors to outperform traditional finance whales, including institutions with BTC exposure via spot ETFs in the United States. 

Bitcoin price trending downward on the daily chart | Source: BTCUSDT on Binance, TradingView

Bitcoin is under immense liquidation pressure at the time of this writing. Though bulls soaked up the sell-off earlier today, the coin remains within a bearish breakout. Prices are trading below the support zone of between $60,000 and $61,000 and below April 2024.

Inflow To Spot Bitcoin ETFs Decline As Sentiment Deteriorate

This formation suggests that though bulls are optimistic, the path of least resistance remains southwards for now. BTC dropped after posting impressive returns from October 2023 to March 2024, when prices peaked. Some analysts think the current cool-off is inevitable following sharp gains in the last six months.

The fact that whales are underwater was unexpected, considering the state of affairs in the last week of April. Then, the inflow from new whales nearly doubled the cumulative holdings of older whales. Analysts said this influx of fresh capital pointed to growing institutional interest.

However, looking at the current price action, new whales are now in the red territory, and their excitement seems to wane. 

According to Lookonchain data, inflow into the eight-spot Bitcoin ETFs, including BlackRock, has stalled. On May 1, all issuers, including Grayscale via GBTC, decreased by 1,950 BTC. Of note is that BlackRock’s IBIT has not seen inflows for five straight days.

Spot Bitcoin ETF tracker | Source: Lookonchain via X

Still, confidence abounds. Inflows into spot Bitcoin ETFs are highly influenced by sentiment, which rests on how prices perform. If BTC shakes off the current weakness and tears higher in the expected post-Halving rally, spot ETF issuers will begin receiving new inflows. 

Crypto Analyst Says Bitcoin Must Hold Above $51,800 As ETF Outflows Trigger Crash

The Bitcoin price continues to trend below $60,000 as a 20% decline triggered a brutal market-wide crash. This has exposed multiple critical support points for the cryptocurrency, some of which the price has already fallen below. In light of this, a crypto analyst known as Norok has revealed the level the BTC price must not fall below to maintain its bullish trend.

Bitcoin Price Must Hold Above $51,800

In an analysis posted on the TradingView website, crypto analyst Norok revealed that $51,800 is now the most important support level for Bitcoin. Norok pointed out that Bitcoin has since returned to its last support level which was last seen in December 2023, making this a crucial support.

In the meantime, the support that had been built up by bulls at the $62,000 level has since been broken by bears and has now been turned into resistance. Nevertheless, the crypto analyst does not believe that the Bitcoin price has turned bearish, despite the crash that has rocked the crypto market.

For Norok to turn bearish, he stated that the BTC price would have to break down below support at $51,800. According to him, such a move will invalidate whatever bullish thesis is in play for Bitcoin, ending the bullish trend of 2023-2024.

Bitcoin price chart from Tradingview.com

In the short term, Norok identifies $56,900 as a level that bulls must hold. He explains that this could help to reinforce the current bullish trend. “Price must hold here at this Support and then it can recapture the cloud to resume to Bullish Trend,” the crypto analyst said. “This is a highly decisive moment in Price action today.”

BTC Suffers As A Result Of ETF Outflows

One major driver of the Bitcoin price decline in the last few weeks has been a turn from inflows to outflows in Spot Bitcoin ETFs. Since these ETFs require the issuers to hold BTC to support the assets they are selling to investors, inflows are incredibly bullish as these issuers have taken to buying BTC to fulfill this requirement.

However, with investors beginning to withdraw their funds, the reverse has been the case, leading to a high selling pressure in the market. Spot Bitcoin ETFs have now recorded six consecutive trading days of outflows, reaching an all-time high outflow record $563.7 million on Wednesday, according to data from Coinglass.

Spot Bitcoin ETFs outflows

If these outflows continue, then the BTC price could continue to decline, and at the current rate, the pioneer cryptocurrency might be testing Norok’s $51,800 soon enough. However, a turn toward inflows would mean issuers have to buy BTC and this can translate to a price recover.

Bitcoin price chart from Tradingview.com

Bitcoin On Track For $1 Million Per BTC “Fair Value”, Analyst Says

An analyst has explained how the “fair value” of Bitcoin appears to be on track to achieve the $1 million milestone by 2035.

Bitcoin Total User Count Could Forecast Fair Value Path Forward

In a new post on X, analyst Willy Woo has discussed about how the fair value of Bitcoin could look like in the future based on the growth curve in the total user count on the network.

The “total user count” here refers to the total number of investors present in the BTC space. Often, this metric is equated with the total number of addresses on the network carrying a balance, but in reality, it’s not the most accurate method as a lot of investors own multiple wallets.

To make an estimation of an adoption curve, Woo has referred to all past studies done on the user count. The analyst shared the below chart in an X post a few days back.

Bitcoin Total User Count

The early part of the chart here is based on Glassnode’s on-chain clustering of addresses into “entities.” An entity is a collection of Bitcoin wallets that Glassnode has determined to belong to the same investor.

For the next part of the curve, Woo has added the Cambridge and Crypto.com data on verified exchange users. Finally, the analyst has projected the resulting growth rate forward.

According to this curve, there are a total of 426 million Bitcoin investors at the moment, with the number estimated to hit the 0.5 billion milestone by October of this year. Interestingly, the price of the cryptocurrency has been oscillating around this total user count growth curve throughout the years, as the below chart depicts.

Bitcoin Price Vs Adoption

More specifically, this oscillation in the price around the adoption curve of the cryptocurrency has existed since 2012. This means that in the pre-2012 period (the shaded region in the graph), this pattern doesn’t quite hold.

“In the early days price was slow to catch up to user count, BTC didn’t even have a price until the 1000th user came in,” notes Woo. “Price discovery started with early markets like New Liberty Standard and MtGox. By Aug 2011 Bitstamp launched and we had multiple global exchanges to properly price the asset.”

Now, if the growth curve of Bitcoin is taken as a guide for its future value as well, then the analyst projects a $1 million per BTC fair value by the year 2035. “Fair value” here is based on the line around which the asset has been oscillating.

From the chart, it’s visible that BTC has historically gained distance over this line during bull markets, so the peak value in future rallies can be significantly more than this fair value.

It now remains to be seen how the price of the cryptocurrency will develop in the coming years and whether this relationship between it and the total user count will continue to hold or not.

BTC Price

Bitcoin has observed a plunge of more than 8% over the past week, which has brought its price down to $58,600.

Bitcoin Price Chart

Bitcoin Bull Run Over? Analyst Predicts What To Expect Now

The recent plummet in Bitcoin’s value below the $60,000 mark has sparked widespread speculation within the crypto community, raising questions among investors and market watchers about the future direction of its price. Marco Johanning, a well-known crypto analyst and founder of The Summit Club, took to X (formerly Twitter) to provide his insights on the current market conditions and what might be expected next.

According to Johanning, the recent price action does not signify a market downturn but rather a correction within an ongoing bull market. He emphasizes, “Bitcoin lost the range. What now? First and foremost, a reminder: we are in a bull market, and this is a correction. This is not a rally in a bear market. Or in other words, the high time frame trend is up no matter what.”

He supported this assertion with several indicators of a continued bullish trend. First, Bitcoin reached its bear market bottom in November 2022 and subsequently broke above the 200-day moving average, a critical indicator of long-term market trends. Following a drop below the 200-day moving average, there was a significant breakout above this level and THE major high time frame resistance in October 2023.

Moreover, Bitcoin achieved a new all-time high in March 2024. Over the last 18 months, Bitcoin has consistently recorded higher highs and higher lows, which are typical characteristics of a bullish market.

“This can’t be a bear market,” Johanning explained. “These elements underscore a fundamental bias crucial for assuming that the current drop is part of a broader bull market trend. Therefore, Bitcoin will eventually find a local bottom and ascend higher.”

Bitcoin Price Analysis: What To Expect Next?

Johanning provided a detailed breakdown of possible future scenarios based on technical analysis. His first scenario is based on the monthly chart where the most crucial level is at $48,000-$49,000. This level is key because it was a major hurdle overcome in February 2024. Now, it might serve as the perfect point for a bullish retest.

Furthermore, there’s a significant market imbalance down to the $48,000-$49,000 range, coinciding with the 0.5 Fibonacci retracement level from the last monthly swing low. This setup suggests a strong potential for price stabilization and reversal at this level, according to Johanning.

Bitcoin price analysis

The second scenario grounds on the weekly chart where the important level is at $52,000. This level acts as a major high time frame support/resistance, marked by a weekly imbalance that extends up to $52,000, and it matches the 0.382 Fibonacci retracement from the bottom to the top of the last major rally, and the 0.618 level from the last swing low to the top.

Bitcoin price analysis

The third scenario is based on the lower timeframes. Here, the most significant level is at $57,000. This mark is critical as it represents the 0.5 Fibonacci level from the last swing low and was a key area during the February climb. This level might serve as the stage for a potential deviation or price trap.

Bitcoin price analysis

“The recent bearish engulfing pattern breaking the monthly levels, followed by a bearish retest, signals significant market shifts,” noted Johanning. “If Bitcoin swiftly reclaims these key levels, particularly the $57,000 mark, we could see a deviation scenario unfold. Otherwise, the $52,000 or $48,000-$49,000 levels will likely be tested, each representing a higher low in the ongoing uptrend.”

Impact on Altcoins And Market Strategy

Altcoins have displayed remarkable resilience in the face of Bitcoin’s volatility, which Johanning finds particularly promising. “Usually, a significant drop in Bitcoin accompanied by a loss of a higher time frame range would lead to severe declines in altcoins. However, their strength yesterday is a good indicator that the worst may be over for altcoins,” he commented.

Johanning concluded his analysis with an optimistic outlook for both Bitcoin and altcoins, expressing confidence in the continuation of the bull market. He is actively accumulating more at current prices, anticipating substantial returns: “No matter which scenario plays out, I am committed to this trend until proven otherwise. I’m investing heavily, and if we truly remain in a bull market, the potential for profit is tremendous.”

At press time, BTC traded at $58,328.

Bitcoin price

Bitcoin Hits ‘Danger Zone’: Peter Schiff Warns Of ‘Do or Die’ Scenario

Bitcoin is facing a critical juncture as it has entered a ‘danger zone,’ according to prominent gold advocate Peter Schiff. This investor, known for his skepticism toward Bitcoin, suggests that the cryptocurrency is entering a “do or die” phase, potentially marking the end of its bullish run if current trends continue.

Breaking Points And Bearish Signals

Peter Schiff has often voiced his bearish outlook on Bitcoin, and his latest comments come as Bitcoin has just slipped below the crucial $60,000 mark.

This level had previously served as strong support during the short-term bull run, and its breach has intensified the bearish sentiment among investors. Schiff warns that staying below this threshold could spell doom for the bullish fervor, potentially derailing Bitcoin’s momentum.

At the time of writing, Bitcoin is trading at approximately $57,054, teetering close to its 100-day Exponential Moving Average (EMA). Schiff points out that remaining below this EMA could confirm a bearish trend, signaling an end to the rally.

Amidst these developments, the market has seen an increase in trading volume, coupled with the price drop, indicating strong selling pressure.

Over the last 24 hours, Bitcoin’s trading volume has dropped from $45 billion to $48 billion, coinciding with a 6.3% price dip during the same period. This heightened activity is a traditional bearish indicator, lending weight to Schiff’s prediction of a downturn.

Moreover, investor sentiment is treading thin ice with significant outflows from Bitcoin spot ETFs, hitting a weekly high of $162 million. This departure of funds is particularly poignant as it unfolds just before the FOMC meeting, where potential interest rate hikes are on the agenda.

These outflows reflect a broader market trend, with the Grayscale Bitcoin Trust (GBTC) experiencing a substantial daily outflow of $93.23 million.

The Bitcoin ETF Conundrum And Market Forecasts

It is worth noting that last month was quite challenging for US Bitcoin ETFs. After a promising start with positive inflows in the initial months following their launch, April witnessed collective outflows amounting to $182 million across all active spot Bitcoin ETFs in the US.

This pullback is attributed to macroeconomic concerns and geopolitical tensions, which have clouded the investment landscape.

Bitcoin (BTC) price chart on TradingView

As the market braces for further turbulence, analysts such as Micheal Van de Poppe are forecasting an additional correction, potentially pushing Bitcoin’s price down to $55,000 before any sign of recovery.

Featured image from Unsplash, Chart from TradingView

Finance Expert Raoul Pal Says 20% Bitcoin Correction Only Temporary As Euphoria Will Return

Co-founder and Chief Executive Officer (CEO) of Real Vision, Raoul Pal has shed light on the current market state and the future outlook of Bitcoin, the world’s largest cryptocurrency. Despite the cryptocurrency witnessing declines of more than 15%, the financial expert has uncovered a significant pattern that indicates a potential bull flag following Bitcoin’s price correction. 

Crypto Expert Unveils “Banana Zone” Rally For Bitcoin

In an X (formerly Twitter) post published on Tuesday, April 28, Pal shared a yearly chart depicting Bitcoin’s price movements from October 2023 to April 2024. At the time of writing, Bitcoin’s price is trading below the $60,000 mark, at $59,185, marking monthly declines of 15.12% and weekly lows of 11.31%, according to CoinMarketCap. 

The crypto analyst has suggested that Bitcoin’s recent price correction was a temporary setback. He predicts that once the market fully refreshes, what he calls “the Banana zone” will kick in. He also described Bitcoin’s recent price declines as a “pause that refreshes.” 

The pause emphasizes the final days of the crypto spring, a period marked by renewed optimism after bearish markets. A prime illustration of this phase occurred when Bitcoin surged to new all-time highs, surpassing $73,000 in March, following its decline from 2022 to 2023. 

On the other hand, the Banana zone represents a phase characterized by intense market excitement and the possibility of significant price increases. However, Pal has described this distinctive period as “when the market begins to anoint the new big L1 or L2, which explodes even vs SOL.”

The financial expert noted that once the Banana zone commences, it may pick up momentum towards the end of the year and continue well into 2025, potentially reaching peak mania. He also shared a historical pictorial analysis illustrating his Bitcoin predictions. 

In the chart, the price of Bitcoin witnessed a Banana zone rally from $1,000 to $5,000 between 2014 and 2016 and from $10,000 to $60,000 between 2019 and 2020. Basing his predictions on this unique historical pattern, Pal suggested that Bitcoin’s price action from 2022 to 2024, starting at $50,000 could potentially skyrocket to a new all-time high of $300,000. 

Crypto Summer Is The Start Of Altcoin Season

Pal has predicted that after the crypto spring, a new season for cryptocurrencies will occur, termed “the crypto summer.” The financial expert has confirmed that this period will be the start of the altcoin season, highlighting that it is typically marked by an intense bubble in the crypto fall. 

During the crypto summer, Pal projects that Ethereum would begin to outperform Bitcoin while Solana would accelerate its outperformance of both Bitcoin and Ethereum. The financial CEO disclosed that the crypto summer and fall are often confusing, as cryptocurrencies tend to adopt a narrative and may get caught up in the prevailing euphoria. 

He predicts another two or more “nasty corrections” triggered by excessive leverage before the onset of the Banana zone. Additionally, Pal has indicated that three or four cryptocurrencies are set to lead the altcoin season, with one particular cryptocurrency emerging as the “Big new entrant,” much like Solana did during the previous cycle alongside Avalanche and Polygon.

Bitcoin price chart from Tradingview.com

Bitcoin Bottom Out? Analyst Signal Turnaround Amid Market Slump

Bitcoin has recently concluded April, marking its most significant monthly decline. Despite the bearish momentum, leading market analysts, including Michael van de Poppe, believe that the worst may soon be over, suggesting that Bitcoin is nearing the end of its current correction phase.

Bitcoin At The End Of Correction?

April was challenging for Bitcoin, as its value plunged nearly 20%, dipping below $57,000, the lowest level traded since late February.

This drop is part of an intense market sell-off that has slashed the combined cryptocurrency market cap by nearly 10%, bringing it down to $2.2 trillion. Amid these declines, Michael van de Poppe, a revered figure in the crypto analysis space, provided hope.

In his recent statements on the social platform X, Van de Poppe suggested that Bitcoin’s current price levels might be nearing the bottom of this correction cycle.

Bitcoin (BTC) price chart on TradingView

He highlighted the critical price range of $56,000 to $58,000 as pivotal for Bitcoin’s short-term trajectory, indicating potential areas for a rebound.

A Closer Look At Predictions And Market Sentiments

Van de Poppe isn’t alone in his optimistic outlook. Other analysts, like Checkmate, an on-chain expert, have analyzed Bitcoin’s historical data to predict future movements.

Checkmate introduced the term “chopsolidation,” describing it as a phase of stagnant yet volatile market conditions that could precede a significant bullish run.

He expects this phase to last about six months, followed by a potential 6 to 12 months of explosive growth reminiscent of past cycles. Furthermore, historical data from Bitcoin’s Halving years support the theory that after a halving event, the market tends to perform strongly towards the end of the year.

However, there are not all optimistic forecasts in the crypto realm. The spot Bitcoin ETF market witnessed over $300 million in net outflows in April, breaking a three-month streak of inflows, reflecting a broader sentiment of caution among investors.

Moreover, Charles Edwards, founder of Capriole Investments, has voiced concerns over the market’s extraordinary bullishness, warning of the necessity for corrections within such a volatile asset class.

Featured image from Unsplash, Chart from TradingView