No Santa For Cryptos This Year: Large Cap Coins Touch December Lows

As Bitcoin hits new lows at year-end, other large-cap altcoins have followed suit. There seems to be no love for crypto this year-end, as Santa has refused to show up.

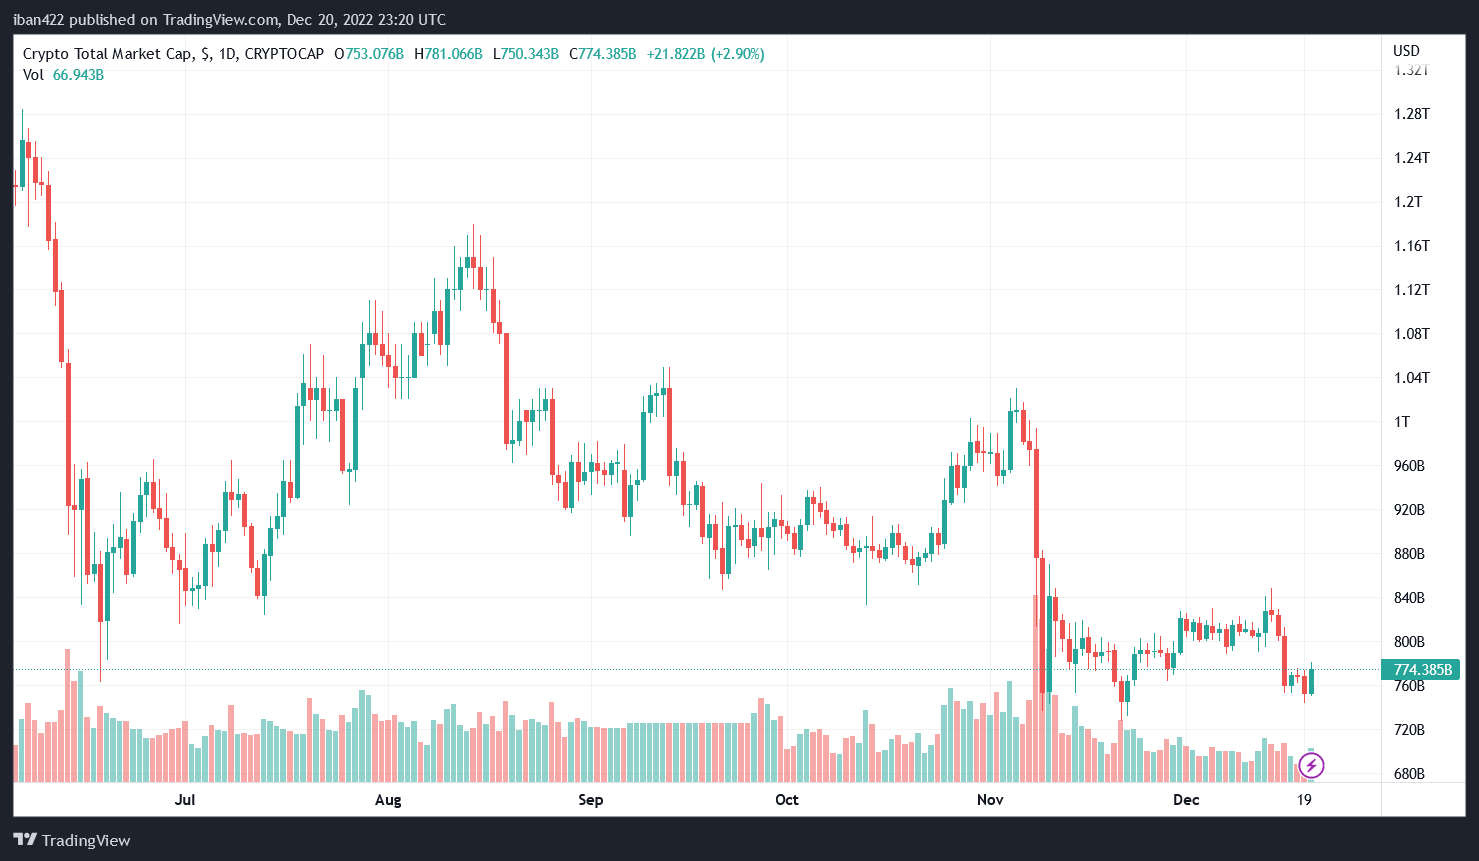
General Crypto Market Cap Plunges

As it stands, crypto traders and investors seemed to have their hands up in resignation. Trading volume across major exchanges has been highly compressed. The general market capitalization across all digital assets is down around 2.6% monthly, at $774 billion.

Crypto

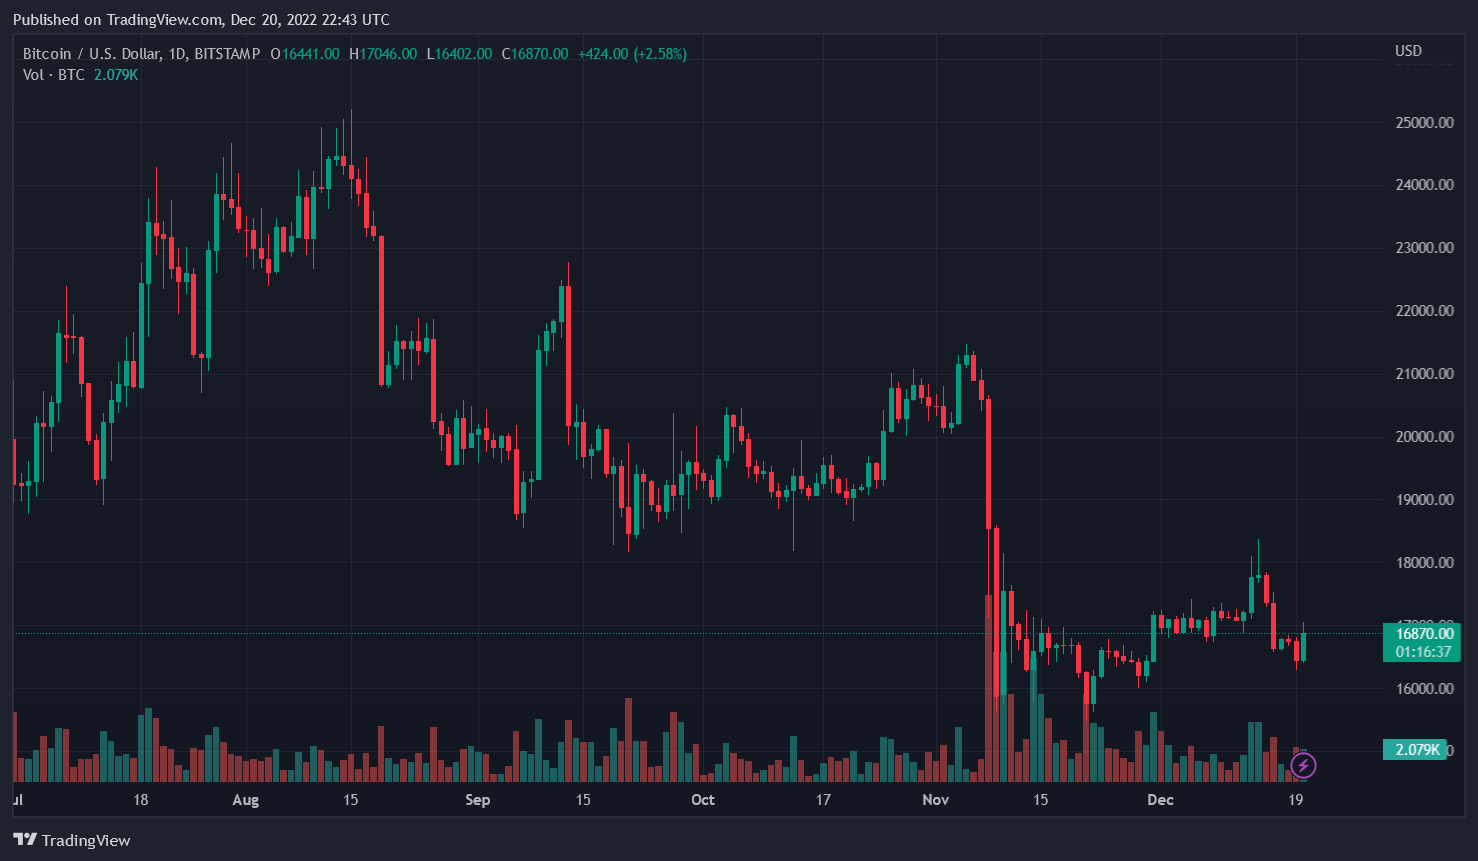
The Bitcoin jump to $16,800 was a faint attempt at a bullish rally. The cryptocurrency continues to experience more downside, falling to its lowest in 3 weeks.

Ethereum added 3.5% on Tuesday, having closed 130 basis points (bps) lower on Monday. The second largest crypto by market cap rose into the $1,200 region.

ETH seems to collide with higher resistance at the $1,230 level. This could be challenging with the 14-day RSI now hovering directly below a ceiling of 47,000.

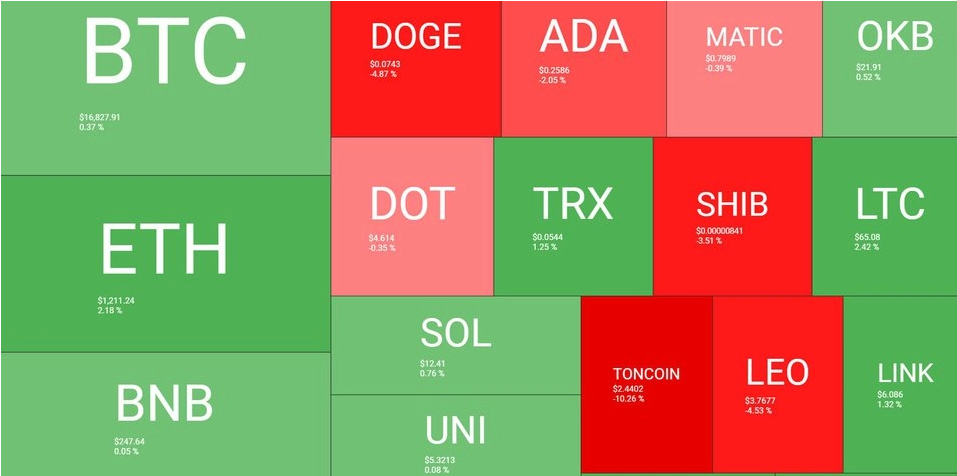
The prices for Solana and Polkadot are currently trading at $12.36 (up 0.5%), $4.59 (down 0.8%), respectively. On the weekly chart, Polka Dot has decreased by 11.1% while Solana has decreased by 7.2%. During the past week, Polygon has lost 12.2%.
Talking about some of the prominent stablecoins, Tether, USD Coin, and Binance USD are trading at $1 (flat), $1 (down 0.1%), and $0.99 (flat), respectively. Terra Classic is listed at $0.00011 (down 3.78%).

Binance’s BNB soared 0.2% over the last 24 hours while meme coins Shiba Inu and Dogecoin took a beating, 3.5% and 4.8% respectively.

Ripple’s XRP and Litecoin (LTC) are also in the green, while Polygon (MATIC) has remained virtually unchanged

Michaël van de Poppe said that markets have been in bear territory for 19 months already. The trader pointed out that altcoins have been crashing since May 2021 despite the Solana and Polygon cycle.

“The first HF [high low] confirmed on HTF [higher-time frame] will be a massive trigger for a relief run,” said Van de Poppe on Twitter.

Altcoins Seem Indecisive

Despite the plunge in Bitcoin value, altcoins have failed to flip BTC’s dominance. Over the past few days, many altcoins have gradually recovered while others have continued to suffer loss. For example, the Open Network’s TON lost a whopping 10.6% and gave up a lot of the gains from the past few days, when it was the market’s leader in terms of price performance.

crypto

Trust wallet token (TWT) led the way, rallying by 10.81%, with Flow (FLOW) and Axie Infinity (AXS) seeing gains of 6.53% and 6.18%, respectively.

Related Reading: Bitcoin Bearish Signal: ‘Mid-Term’ Holders Show Signs Of Dumping

The developments come on the back of news that Binance US will be buying out the assets of Voyager in a deal worth upwards of $1 billion. The exchange has even agreed to send $10 million in advance as a good-faith transfer.

According to the press release,

The Binance.US bid aims to return crypto to customers in kind, in accordance with court-approved disbursements and platform capabilities.

Also, the Bank of Japan’s announcement to lower its target range for 10-year rates to 50 basis points early in the session caused the Asian equity markets and the NASDAQ mini to decline. Prior to this, the 10-year yield range was 25 basis points away from its aim of 0%.

The S&P 500 rose by 0.10%, while the NASDAQ Index concluded the day with a 0.01% gain. Through the afternoon session, the rebound provided support for the cryptocurrency market.

Bitcoin Drops To Monthly Low As Year-End Approaches, More Impulsive Decline?

Bitcoin moved closer to the $17,000 level on Tuesday. The digital currency dropped to $16,400, its lowest level in the last three weeks. As year-end approaches, BTC could face high volatility and low liquidity.

Bitcoin Hit A Brief Surge

Bitcoin surged to a short-lived peak of $16,837 in today’s session, barely 24 hours after hitting $16,398. The cryptocurrency saw an impulsive decline after experiencing significant rejection at the resistance level.

The sharp fall has been associated with a straight daily decline for the S&P 500 and general nervousness about the Federal Reserve’s potential to hike interest rates.

Bitcoin

BTC could witness more decline as the year closes given the decline in trading volume and liquidity. This would lead to a spike in the volatility of the asset.

Katie Stockton, the founder of Fairlead Strategies LLC, has predicted that BTC could retest November lows, dropping “near $15,600, in the coming weeks.”

BTC hit an all-time high of $68,997 on Nov. 8, 2021. But the big crypto produced a major shift in market structure by producing a lower low on the weekly timeframe at $32,995 on January 24. This move confirmed the start of a bear market.

Possible Rally For BTC

While the dust settles from the FTX crash and FUD surrounding Binance, the bitcoin price could begin to see a gradual recovery over the next few months. According to Jim Wyckoff, “Neither the bulls nor the bears have any near-term technical advantage.”

This suggests that traders will continue to see “more choppy and sideways trading on the daily chart into the end of the year – barring any major fundamental shock to the marketplace,” Wyckoff concluded.

However, a tweet by Crypto Trader, PlanB shows that the next Bitcoin halving is set to take place in 15 months. The build-up in price will not happen for at least 5 months as the U.S. FED will continue to tighten up monetary policy. BTC price will have room to breathe as macroeconomic conditions soften.

Schroders, a global asset management firm, made the case that risky assets like Bitcoin have a nearly 80% chance of closing the year with positive returns.

Related Reading: Bitcoin Still “Overvalued” According To NVT Ratio

The investment firm noted that December was the best-performing month after collecting data on U.S. large-cap stocks since 1926. Schroders estimates that there is a 77.9% likelihood that large-cap stocks will end December with a net gain. The company divides all percentage gains vs. all percentage losses over the course of a month to arrive at these metrics.

Investors should keep in mind that this year, the correlation between Bitcoin and the stock market has been over 90%. It may be argued that until the end of the year, the peer-to-peer digital currency will continue to reflect price changes on the stock market.

Bitcoin is down 2% from December’s opening price of $17,167. Thus, following Schroders’ analysis, Bitcoin may rise by 3.5% to reach $17,550 by Jan. 1, 2023.

Grayscale May Liquidate 600,000 BTC Holdings Following SEC Opposition To ETF

Grayscale Investments may offer to buy up to 20% of Grayscale Bitcoin Trust  (GBTC) shares. This is a move the company hopes will close the gap between the GBTC share price and the company’s underlying Bitcoin holdings.

Grayscale Can’t Act Independent Of Investors

The Wall Street Journal released a letter by Grayscale CEO Michael Sonnenshein urging that Grayscale would consider issuing a tender offer should the Security and Exchange Commission (SEC) and shareholders give their approval. Being a close-ended fund, GBTC shareholders can only liquidate their holdings on the open market.

Under the Williams Act (part of the Securities Exchange Act of 1934) that governs tender offers in the US, an investor tendering for a security must disclose their source of funds, legal agreements related to the offer, and reasons for the offer.

Grayscale

If the company cannot return GBTC shareholders funds, it will continue to offer the tender until it’s converted to an ETF.

Sonnenshein wrote to investors:

In the event we are unsuccessful in pursuing options for returning a portion of the capital to shareholders, we do not currently intend to dissolve GBTC, but would instead continue to operate GBTC without an ongoing redemption program until we are successful in converting it to a spot bitcoin ETF.

Grayscale is currently embroiled in a lawsuit with the SEC after its application to convert GBTC to a spot Bitcoin ETF on June 29, 2022.

The letter by the CEO was an attempt to ease shareholder concerns after a turbulent few months across the crypto market.

ETF Conversion Seems To Be Only Option

As it stands, Grayscale doesn’t have a specific timeline for when it may explore other options apart from the ETF conversion.

The lawsuit seems to be a long-drawn battle. Grayscale filed its opening brief against the SEC on Oct. 11, 2022. In response, SEC filed a brief on Dec. 13, 2022 denying Grayscale’s accusations that its rejection was discriminatory and arbitrary.

The firm has until Jan. 13, 2023 to respond. Afterwards, a three-judge panel will be selected to listen to oral arguments and rule on the case.

Grayscale’s Bitcoin Trust has roughly $10.78 billion or 633,000 BTC in assets under management. The fund has failed to meet its goal, and it’s currently changing hands at a 48.8% discount to Bitcoin.

Source: YCharts

Sonnenshein didn’t clarify if the business may later sell off its Bitcoin holdings. However, a market dump like Grayscale could see Bitcoin crashin to a fresh yearly low.

Grayscale selling off its Bitcoin stash could also drive down confidence in crypto as significant liquidations for those engaged in Bitcoin derivatives markets. This would hurt crypto volumes, and send a bearish crypto market further down.

Bitcoin Slumps Below Key Support Level. How Low Can It Get?

Bitcoin have retreated to a crucial area of support that served as the upper limit of the negative movement in late June at the 18,000 range.

Bitcoin Breaks Crucial Level

After falling below the bear flag at the middle of August, prices were able to fall further on a break of 20,000 before reaching a crucial area of support at around 19,600. Although it has just returned to action, this level has also served as a critical source of resistance for the leading cryptocurrency since 2017.

BTC/USD falls below $20k. Source: TradingView

This places a strong downward pressure on Bitcoin as it moves into September. Additionally, according to cryptocurrency expert Ali Martinez, Bitcoin’s market share has fallen below 39% for the first time since 2018.

For Bitcoin maximalists, this is troubling news as alternative cryptocurrencies continue to overtake the cryptocurrency monarch.

Popular cryptocurrency analysts have also drawn attention to a concerning trend in Bitcoin’s prior September performance.

For instance, according to one expert, Bitcoin has experienced a losing month-end in nine of the last twelve Septembers. On September 7th, Glassnode reported that 19.29 million BTC addresses had losses.

Source: Glassnode

When BTC/USD hit an all-time high of $19,666 on December 17, 2017, it reached its pinnacle. Since then, a breach of this zone in December 2020 has driven an upswing that has helped the major cryptocurrency increase before reaching a new record high of $69,000 in November of last year.

Selling pressure has returned prices below the late-June low of $18,595, following a fall below previous support that had turned into resistance.

Price May Crash Further

In the event that prices drop further, a break of the $18,000 psychological level could lead to a retest of the $17,792 level, which represents the 78.6% retracement of the move from 2020 to 2021, with the December 2020 low of $17,569 serving as the next level of support.

The four-hour chart shows how these historical levels have created zones of confluence that continue to keep both bulls and bears at bay as short-term price movement oscillates between $18,500 and $19,000. Retests of $19,666 and the subsequent layer of resistance at $20,418 are likely on the upside if the price rises above $19,000 and $19,500.

In a recent report, the Glassnode also mentioned a potential negative market movement from Bitcoin. It claimed that around 12.589 million BTC, or over 65.77% of the total amount of BTC in circulation, have been dormant for at least a year.

Source: Glassnode

In the past, “Bitcoin bear markets” have been characterized by an expanding inactive supply. The pain felt by maximalists who have been patiently waiting for a price breakout is increased by this.

Short-term volatility was predicted by BaroVirtual, a CryptoQuant-based author. The analyst studied the Net Unrealized Profits (NUP) trending pattern, which exhibits short-term periods of volatility.

Featured image from Shutterstock, charts from Glassnode and TradingView.com

Bitcoin Investment ETFs And Trusts Have Slowed Since May

Many investors are uneasy since Bitcoin value has fallen by around 70% since its peak in November 2021. In the meantime, market sentiment is at an all-time low due to analysts’ expectations of a major recession. This is especially clear from the decline in the equity markets as measured by the S&P 500 and Nasdaq 100 indices, which has a big impact on how people invest in BTC on regulated markets.

Bitcoin Investment Vehicles Have Taken A Beating

When taking a look at the Grayscale Bitcoin Trust, the share price has significantly decreased from its peak of roughly $56 to $11.94. At the same time, the share values of 3iQ CoinShares Bitcoin ETF and Purpose Bitcoin Canadian ETF both fell sharply.


The Grayscale Bitcoin Trust (GBTC) has fallen deeply to $11.94 since its peak. Source: TradingView

Despite the shares’ significant discount, GBTC’s daily trading volume has drastically decreased to 3.075M. It suggests that institutional investors might be skeptical about Bitcoin-related financial products on the regulated market or they might just believe that the bear market is not yet over.

The daily trading volume of GBTC has sharply dropped to 3.075M despite the generous discount of the shares. Source: YCharts

Additionally, given the current market conditions, certain trusts and ETFs are gradually selling off their holdings. For instance, since reaching its high in February 2022, the total amount of BTC held by the Grayscale Bitcoin Trust has decreased.Moreover, since the market peaked in May 2021, the total number of Bitcoins held by various trusts and ETFs has sharply decreased.

The Sharpe ratio indicates that GBTC is a bad asset with a very low risk-adjusted performance in terms of return on investment. In fact, the Sharpe ratio has recently dropped to 0.453 after declining over time. It implies that while GBTC’s volatility is fairly high, the projected return on investment is rather modest.

Loss After Loss

The current pioneer crypto investment vehicles in regulated markets, including trusts and ETFs, have to some extent displayed the pessimistic signal. Despite the significant discount at which GBTC has been sold, the daily trading volume is steadily declining, and several trusts and ETFs, such as Grayscale Bitcoin Trust, have been urged to sell their BTC holdings.

The total number of BTC held by trusts & ETFs has plummeted since May 2021. Source: CryptoQuant

The current Bitcoin investment tools in regulated markets such as trusts and ETFs have shown the bearish signal to a certain extent. Although GBTC has been traded at a substantial loss, the daily trading volume keeps decreasing and some trusts and ETFs including Grayscale Bitcoin Trust have been encouraged to divest their Bitcoin holdings.

Sharpe ratio tells us that GBTC is a poor asset with a very low risk-adjusted performance. Source: YCharts

Because the shares of GBTC sold or bought by institutional investors are reported quarterly, many recent trades may have not been listed yet. However, these above figures could give us some clues of what may be actually happening with Bitcoin behind the scenes.

Retailers can only be aware that a local bottom has been reached after it has already occurred, like in the case of institutional investors who purchased GBTC in late June just prior to the July rise.

Most notably, the Sharpe ratio shows that GBTC’s return on investment is rather low and that this asset appears to be quite risky. Therefore, at this time, investors would be ready to begin hedging against the rising negative downside risk of bitcoin.

Featured image from Unsplash, charts from TradingView.com, Ycharts, and Cryptoquant

Bitcoin Mining Revenue Surged 10% In August

The first monthly gain since March, bitcoin mining revenue increased 10% in August.

Bitcoin Mining Revenue Soars

Approximately $657 million was earned by miners last month, according to statistics gathered by The Block Research.

In the most recent update published on Wednesday, the difficulty of mining bitcoin increased by 9.26% while the hash rate increased by more than 13%.

According to Kevin Zhang, senior vice president of mining strategy at Foundry, which manages the Foundry USA mining pool, the increase in hash rate is caused by “a combination of heat waves finally subsiding (on a global level) and facilities slowly coming online,” “There’s also the added kicker of the higher efficiency Bitmain S19 XP’s finally hitting the market as well!”

Source: The Block Crypto Data.

Only a minor fraction of the pioneer crypto mining profits ($9.24 million) came from transaction fees, with the majority ($647.72 million) coming from the block reward subsidies. Transaction costs for bitcoin decreased to 1.4% of overall revenue.

Ethereum miners generated $725 million in income in August, which is 1.1 times more than bitcoin miners.

Mining Difficulty Surges

The difficulty of mining bitcoin is rising. According to data from BTC.com, the mining difficulty for the largest cryptocurrency in the world increased by 9.26% during the previous two weeks.

The website’s analysis reveals that the network’s mining difficulty is at its highest point since January, reaching 30.97 trillion, with the hashrate currently averaging around 230 exahashes per second (EH/s).

Last month, Texas miners stopped working in order to support the electrical system and save energy during a heat wave. This action probably made Bitcoin easier to mine.

Weeks later, they turned back on, and as the level of difficulty rises, miners may see their income decline as more computer power (and energy) is required, but the price of Bitcoin has remained stable.

BTC/USD trades at $20k. Source: TradingView

According to TradingView data, the price of BTC was $20,060 at the time of writing. It has been struggling for months to surpass the $25,000 level and is down more than 70% from the record high of $69,044 it reached in November.

Featured image from FT and chart from TradingView.com and The Block

Bitcoin Slumps Below $20,000. Market Fear Springs

For the longest stretch of days since the cryptocurrency market was shaken by unrest in July, Bitcoin has dropped below US$20,000 for a sixth straight trading session.

On Thursday, the value of the biggest cryptocurrency dropped as much as 3.1% to $19,577.

Bitcoin In Free Fall

The largest cryptocurrency by market capitalization has been in free fall for the previous ten days as concerns over Wednesday’s FOMC minutes drove its price below $20,000. Despite the recent decline, investors seem to be increasing their Bitcoin purchases, and certain key on-chain data indicate that the price may be getting ready to emerge from its most recent low.

Market Analyst Jim Wyckoff foresaw the increase in volatility and cautioned in his morning Bitcoin brief that “quieter sideways trading continues, but probably not for much longer. History demonstrates that the financial markets can experience volatility in September.

BTC/USD trades at $20k. Source: TradingView

Wyckoff predicted that it might last for some time as long as bears continue to outnumber bullish traders.

“In the immediate future, expect increased cryptocurrency volatility. To break the price decline that is still visible on the daily chart for bitcoin, albeit narrowly, bulls need to demonstrate greater strength, according to Wyckoff.

Bitcoin average funding rates. Source: Santiment

The cryptocurrency analytics company Santiment, which published the following chart displaying the increase in BTC average funding rates, revealed that the sentiment against Bitcoin is still unfavorable.

Fear Overtakes Hope

Less than US$1 trillion, or roughly a third of its peak market value reached in November, is now the size of the cryptocurrency industry. Coin values were shaken midyear by the collapse of the Terra ecosystem, the demise of Three Arrows Capital, the bankruptcy of broker Voyager, and the failure of lender Celsius after coming off the highs amid a general increase in risk aversion.

Stephane Ouellette, chief executive of FRNT Financial Inc. said:

“There is a lot of fear that if we make new lows on BTC (as a proxy for the market), there will be another wave of crypto company defaults.”

Source: Bloomberg

The fall on September’s first day is unfavorable for the bellwether currency. Since 2017, every September has seen a decline in the price of Bitcoin, making it traditionally one of the worst months of the year. According to Bespoke Investment Group, over the past five years, the monthly decline in the value of Bitcoin has averaged 8.5%.

The overall cryptocurrency market cap now stands at $967 billion, and Bitcoin’s dominance rate is 39%.

Featured image from UnSplash and chart from TradingView.com, Bloomberg, and Santiment

Ethereum L2 TVL Enjoys 284% Growth In The Past Month Ahead Of Goerli Merge

Total value locked (TVL) on Optimism, a layer-2 scaling solution for the Ethereum blockchain, has increased 284% in the last month, according to data from DefiLlama. Users lending and borrowing assets on Aave through Optimism’s layer-2 chain make up the vast majority of TVL.

Ethereum Optimism TVL Surges

In anticipation of The Merge update, which will see the blockchain switch from a proof-of-work network to one based on proof-of-stake, investors have been bidding up digital assets tied to the Ethereum ecosystem.

The merge will be tested by Ethereum developers on the Goerli testnet on Thursday, August 11. If everything goes according to plan, the mainnet merging will be approved on September 19. The mainnet merge would probably be delayed if there are issues with the Goerli merge.

The Merge’s anticipated launch date has been set for September 19, according to a recent Ethereum developer call. With Rollups, or off-chain computations, Optimism, an Ethereum layer-2 blockchain, aims to extend the ecosystem and expedite transactions. On Optimism, transactions are entered, and on Ethereum, they are completed.

ETH/USD trades at $1,853. Source: TradingView

The project is home to 35 protocols, including automated market maker Velodrome, decentralized exchange Uniswap, and derivatives exchange Synthetix. The Ethereum blockchain’s current capacity of 30 transactions per second is inadequate to manage the enormous amount of user trade orders on exchanges (including cancellations). Nevertheless, according to some analysts, the network might scale to 100,000 transactions per second with The Merge upgrade, with layer-2 solutions improving this capacity even further.

Optimism blocks are constructed and executed on layer-2 while user transactions are batched up and submitted to the Ethereum layer-1. On layer-2, transactions are immediately accepted or rejected with no mempool, enabling a fast user experience. Correspondingly to the TVL development, the project’s namesake tokens have also rallied by 300% during the same period.

Dai on Optimism

From 30 million to 140 million in 5 days. pic.twitter.com/AQlNWvX6c9

— Maker (@MakerDAO) August 9, 2022

Goerli Testnet: A Brief

The Ethereum network will be one step closer to its biggest update yet in less than 24 hours. The second-largest cryptocurrency by market capitalization has been preparing to switch from Proof-of-Work (PoW) to the significantly less energy-intensive and, in some people’s opinions, more decentralized Proof-of-Stake for years (PoS).

Senior Ethereum developers stated last month that the so-called “Merge” to “Ethereum 2.0” will occur on September 19. However, there is still a challenge for developers to overcome before the “Merge” can be implemented on Ethereum’s mainnet.

Developers want to implement the merging on one last testnet after completing the switch from PoW to PoS on two of Ethereum’s main testnets (Ropsten and Sepolia) in June and July.

From its mid-July lows under $1,000, Ethereum has increased by more than 80%, and at last check, it was trading in the mid-1,800s. While most of this has coincided with a larger cryptocurrency market rebound amid an uptick in macro mood (Bitcoin is up over 25% from its mid-July lows), analysts have indicated that anticipation ahead of the merger has been a key tailwind driving ETH higher.

Featured image from iStock Photo, chart from TradingView.com

Bitcoin Surge Towards $24k As CPI Report Show Inflation Cooling

Bitcoin surged after July’s CPI data showed that inflation has started to decline after several months of record-breaking rates.

Similar to earlier instances, the price of bitcoin climbed close to $24,000.

CPI Report Boost Bitcoin Price

According to the Consumer Price Index report (CPI) that the U.S. Bureau of Labor and Statistics released on Wednesday, consumer costs remained unchanged, putting inflation at 8.5%.

Prior to this, analysts anticipated that the index, which analyzes price changes across a wide range of products and services, would increase by 0.2% to reveal inflation to be 8.7% on an annual basis.

After the U.S. Bureau of Labor Statistics released its data on inflation for July, the value of the Dow Jones Industrial Average, Nasdaq, S&P 500, and NYSE indexes all sharply increased. Moreover, the value of precious metals and cryptocurrencies rose on Wednesday. The value of bitcoin surged by nearly 4%, that of gold by 0.35%, and that of silver by 1.43% in relation to the dollar.

BTC/USD trades close to $24k. Source: TradingView


Inflation as measured by headline CPI increased 0.0 percent month-over-month in July, well below its elevated June monthly rate of 1.3 percent. Monthly core inflation in July fell to 0.3 percent. 1/ pic.twitter.com/6bVTZq7m1W

— Council of Economic Advisers (@WhiteHouseCEA) August 10, 2022

According to the Consumer Price Index (CPI) report for July 2022, the Consumer Price Index for All Urban Consumers (CPI-U) increased by 1.3 percent in June but remained steady in July. Before seasonal adjustment, the all items index rose 8.5 percent over the previous 12 months. The report on inflation adds:

“The gasoline index fell 7.7 percent in July and offset increases in the food and shelter indexes, resulting in the all items index being unchanged over the month.”

President of the United States Joe Biden talked about the CPI figures as well and said that new legislation and domestic semiconductor production had increased the nation’s economic activity. According to Biden, the lack of semiconductors resulted in high pricing for autos last year, which accounted for one-third of core inflation. “America is back leading the way with the CHIPS and Science Law boosting our efforts to make semiconductors right here at home.”

Focus Turns To FOMC Meeting In September

Analysts anticipate that core inflation will rise from 5.9% to 6.1%, pushing the Fed to raise interest rates further in September. The CPI data, however, indicates that recent rate hikes are having a cooling effect on the economy.

Nevertheless, Citigroup economists predicted another 75 basis point increase, fueled by strong job data and faster pay growth than anticipated. But if core inflation comes in higher than anticipated, there is also a chance for a 100 basis point rise.

Federal Funds Effective Rate (Source: FRED)

The current CPI rate is 9%, and investor Stanley Druckenmiller said that “Inflation has never come down from above 5% without Fed funds rising above CPI.”

The Fed won’t need to raise rates as much as they have thus far this year if inflation has peaked.

In response to rising interest rates that slow growth, institutional investors have moved away from more speculative assets like tech stocks and cryptocurrencies and toward investments that are more comparatively stable, such corporate bonds and U.S. Treasuries.

Featured image from Getty Image, charts from FRED and TradingView.com

Ethereum Retests $1,500 Region, Shadow Fork Deployed Ahead Of Merge

Over the past 24 hours, the market has seen gains. Ethereum, increased by 8.13% while the market king, Bitcoin, has increased by 3.25%. The performance of the remaining top cryptocurrencies has been comparable to that of the two majors.

With a price range of $1,362.95 to $1,602.61, ETH/USD has experienced significant volatility over the past 24 hours. While the overall market capitalization trades around $181.33 billion, trading volume has decreased by 14.18% to reach $17.13 billion, giving the market a dominance of 18.3%.

Ethereum Suffer Setback Ahead Of Merge

Even after the recent confirmation of the “Ethereum merge” shift to a proof-of-stake (PoS) consensus network in September, Ether (ETH) is down 11.5% in the last seven days.

Tim Beiko, an Ethereum core developer, suggested Sept. 19 as a possible goal date at the Ethereum core developers’ conference call on July 14.

Years have passed since the move away from energy-intensive mining, and a date has not yet been set for the shift to scalability using sharding technology, which allows for parallel processing. However, other analysts predict that the network’s monetary policy will increase Ether’s value.

ETH/USD trades at $1,600. Source: TradingView

The “supply shock” effect was noted by Ethereum researcher Vivek Raman. According to the analyst, the “merge” will “reduce ETH’s total supply by 90% ,” even if there is now no reduction in transaction fees.

Related reading | TA: Ethereum Recovery Faces Major Hurdle, Risk of Fresh Decline Exits

The recent dramatic decrease in Ether’s price could be largely attributed to regulatory uncertainty. Yuga Labs is the target of a class-action lawsuit for “inappropriately inducing” the public to purchase nonfungible tokens (NFTs) and the ApeCoin (APE) token. The law firm further asserts that Yuga Labs “inflate the price” of the BAYC NFTs and the APE tokens by using celebrity endorsers and promoters.

Shadow Fork Deployed

Another minor but significant step has been made by Ethereum toward the merger and the blockchain’s much-anticipated switch to proof of stake.

The 10th shadow split of Ethereum, which was supposed to go live today, went online early yesterday, more than 26 hours ahead of time. Shadow forks are a focused test run of the merge’s components; they simulate making one or two particular modifications to the blockchain that will take place in the future.

This is distinct from complete testnet hard forks, like the Sepolia testnet that happened earlier this month. The merging, which switches the whole Ethereum mainnet over to a test environment network, is fully rehearsed on testnets.

Related reading | Why Ethereum Classic (ETC) Leads Crypto Market In Latest Week With 16% Surge

This week’s shadow fork served as a rehearsal run for the releases that will take place on Ethereum’s last testnet, Goerli, on August 11. This test will be the third and last of its kind needed before the merge is prepared to go into effect.

Featured image from iStock Photo, charts from TradingView.com

Bitcoin Slips To 1-Week Low Ahead Of Fed Hike Rate Decision

On July 26, the price of Bitcoin (BTC) fell to a level not seen in more than a week as investor anxiety grew in anticipation of the Federal Reserve raising interest rates.

Bitcoin Slumps

According to TradingView, the leading cryptocurrency is currently trading below $21,000 at $20,955, down 4.26 percent today and a further 7.17 percent over the past week.

As a result, the total market value of the digital asset is currently $400.13 billion. More than a week ago, on July 18, BTC had a market cap of this amount.

Hopes for a long-lasting Bitcoin recovery have been dashed by the dip, which has brought the coin’s trading range back to $19,000 to $22,000.

Related Reading | On-Chain Data: Bitcoin Whales With 10k+ BTC Have Been Growing

It’s interesting to note that cryptocurrency consulting firm Eight Global has a more upbeat outlook for the Federal Open Market Committee (FOMC) meeting on July 27. The website stated that the federal funds rate is significant for cryptocurrency because:

“Crypto is correlated to the stock market, and the stock market is impacted by the federal funds rate. Rising rates hurt the performance of stocks while lowering rates make stocks more interesting as investment.”

The majority and most likely outcome, according to Eight Global, is a hike of 75 basis points, although the market has already factored this in.

What to expect tomorrow:

An increase of 75 bps is expected by the majority and is the most likely outcome. A 75 bps hike will either have a neutral or bullish outcome for stocks and crypto, as this has been priced in during the past weeks. pic.twitter.com/MH3Hx8oQ9k

— Eight (@eight_global) July 26, 2022

BTC/USD trades at $22k. Source: TradingView

With the markets correcting, cryptocurrency trading guru Michal van de Poppe stated that he is “looking at a $20.5K-20.7K area to hold for Bitcoin going into FOMC tomorrow.”

Related Reading | Bitcoin Puell Multiple Lifts Off From Buy Zone, Bull Momentum To Follow?

Featured image from Shutterstock, charts from TradingView.com

Arcane Research: Stablecoins Supply Drops Almost 19% In Q2 2022

The total supply of stablecoins decreased globally by 18.8% at the end of the second quarter of 2022 as the equities markets and risky assets experience volatile times due to rising inflation and other macro reasons.

Stabelcoins Supply Falls In The Second Quarter

Digital tokens called stablecoins are anchored to fiat money like the dollar. These currencies are supported by a combination of cash reserves, commercial holdings, and other physical assets and make use of blockchain technology.

This week, Arcane Research released a paper that detailed the supply pattern. In their analysis, Arcane looked at supply information for popular tokens like USDT, USDC, BUSD, DAI, MIM, and USTC.

Data indicated that the overall supply was above $180 billion in May 2022. By the end of the second quarter, that amount had dropped to $151.3 billion, indicating an 18.8% decline in worldwide supply.

The report claims that the significant reduction, which is estimated to be worth $35.1 billion, is the greatest quarterly supply drop in stablecoins history. This occurs at a time when the cryptocurrency market is struggling and the prices of market leaders like Bitcoin have fallen dramatically.

The crypto ecosystem entered the seven seas in 2022, and stablecoins were not left unphased.

To understand how stablecoins navigated the stormy market conditions and whether Arcane’s stablecoin predictions for 2022 stand the test of time, click below:https://t.co/uL5tTWFQlT

— Arcane Research (@ArcaneResearch) July 26, 2022

Suggested Reading | TRON Bulls Are Back To Pump Some Energy Into TRX Coin

USDC To The Top

In particular, Arcane’s report anticipates a rise of USDC to the top. In fact, the analysis predicted that somewhere in October 2022, the market value of USDC will increase by around USDT.

According to Arcane, Tether (USDT) has been the market’s largest stablecoin, fully utilizing the first mover advantage. However, in November 2021, it decreased by 50%. As the market capitalization of USDT fell from $78 billion to $66.3 billion in 2022, the fall continued.

USDC market cap at $54 Billion. Source: TradingView

The top two stablecoins in cryptocurrency at the time of publication are USDT and USDC. The market capitalization of both tokens is over $50 billion. Binance USD (BUSD), the nearest rival, comes in third with a market worth of roughly $17.83 billion.

Related Reading | Ethereum Merge: How ETHBTC Could Hint At A Return Of Risk Appetite

Featured image from iStock Photo, charts from TradingView.com, Arane research

Ethereum Prints Modest Losses, Consolidation Before Next Big Breakout?

The future of the second-largest cryptocurrency is hampered by the US dollar index’s recovery. On Thursday, the price of Ethereum (ETH) showed just slight decreases.

Ethereum Consolidates

On July 21, price movement in the cryptocurrency market as a whole was mostly muted as traders took a day to digest recent gains and book profits after the strongest relief bounce since early June.

The Ethereum Merge has remained at the top of the list despite rumors regarding what sparked the recent spike. After a preliminary date of Sept. 19 was chosen for the mainnet Merge, the market rally accelerated.

The price of Ether (ETH), which reached a high of $1,620 on July 20, retraced to a low of $1,463 in the early trading hours of July 21, according to TradingView data, and has since recovered back above support at $1,500.

ethereETH/USD back around $1,500. Source: TradingView

Following the initial price spike caused by the Merge news, here is what various analysts anticipate will happen as Ether’s mainnet switch to proof-of-stake draws near.

Market analyst Rekt Capital posted the following chart showing the significance of Ether’s weekly finish over $1,300 and subsequent rise higher, describing the retreat on July 21 as a good development.

Rekt Captial said:

“Though #ETH could just continue higher to reach the upper orange region, it would be healthier for ETH to dip. Such a retest of the lower orange area would only increase probability of continuation.”

With this outlook in mind, the pullback on July 21 raises the prospect of a rise to $1,700 soon.

Related Reading | Ethereum Merge: How ETHBTC Could Hint At A Return Of Risk Appetite

Vitalik Hints At Future Of ETH

The co-founder of Ethereum detailed his plans for future developments on Thursday at the Ethereum Community Conference in France that go far beyond the network’s switch to proof of stake. The upgrade—often referred to as “the merge” since it will integrate the Ethereum mainnet with the proof-of-stake beacon chain—is actually the first in a series of modifications that are being planned.

Ethereum will then go through additional improvements that Buterin refers to as the “surge,” “verge,” “purge,” and “splurge” after the merging, which he believes is extremely close because “the only thing left to do is do a merge on Ropsten [test network],” he said during the conference. Buterin mentioned a goal to strengthen the Ethereum network being the reason behind the network continuous updates.

Ethereum will only be about 55% complete after the integration, which is anticipated to be finished this September.

The surge is due to the addition of Ethereum sharding, a scaling solution that, according to the Ethereum Foundation, will make layer-2 blockchains even more affordable, reduce the cost of rollups or bundled transactions, and make it simpler for users to run nodes that protect the Ethereum network. Buterin added that following the spike

Related reading | Ethereum Cruised Past $1500, Is There A Possibility To Retrace To $1200?

Featured image from Shutterstock, chart from TradingView.com

Bitcoin Shoots Up Above $24,000 As Index Show Investors Are Focusing On A Breakout

On Wednesday, Bitcoin surpassed $24,000 amid a broader recovery in the cryptocurrency sector, which has seen the global market valuation reach $1 trillion. Over the last seven days, the leading cryptocurrency has surged by more than 23%.

Bitcoin Pumps Past $24k Threshold

The bull run barely got started. For the first time in more than a month, Bitcoin exceeded the $24,000 threshold. Investors can exhale with relief after nearly three months of “extreme fear.” On Wednesday, BTC reached a record high of $24,120, increasing by 8% in only one day and trading at levels not seen since mid-June.

TradingView reports that the price of one bitcoin is currently $24,120.30. The trading volume over a 24-hour period is $49.929,803,913. The value of Bitcoin has climbed by 7.97% over the previous day.

BTC/USD trades above $24k. Source: TradingView

Bitcoin investors hope that the Fed will adopt a more accommodating approach at its following policy meeting. Risky assets like stocks and cryptocurrencies have been considerably impacted by the US central bank’s tightening monetary policy. Since the beginning of 2022, the price of bitcoin has decreased steadily by about 50%.

After an incredible 73 days, BTC finally left the “extreme fear” zone on Wednesday. The increase is related to BTC’s weekly gain of 19%. As bulls get back into the market, the trend restarts. The level of “extreme fear” on the Fear and Greed Index has soared to just “fearful.” In comparison to the existing index score of 31, it has drastically increased.

Related Reading | The Worst May Be Over As Crypto Market Adds More Than $100 Billion

On a scale of 0 to 100, the Fear and Greed Gauge, a sentiment index, rates the general crypto market’s present frame of mind. This Index is derived in part from statistics on volume and dominance from the main Bitcoin exchange.

According to data source Santiment on Twitter, traders are shifting their strategies and many are now concentrating on a long-term breakout of the cryptocurrency. The current pattern can be a sign of FOMO (FOMO).

FED May Raise Rates

The Federal Reserve is anticipated to hike rates at its upcoming meeting, although this time the rate increase will be modest, at 75 basis points as opposed to 100.

When the price of a cryptocurrency rises above $22,700, it has regained its 200-week moving average and laid the technical foundation for a “trend reversal.” In the meantime, traders are betting that the worst of a severe market panic caused by issues with liquidity at several significant crypto businesses has passed.

Matt Weller, global head of market research at Forex.com wrote:

“Like many risk assets, the crypto market is benefitting from investors ratcheting down their expectations for the Fed’s peak interest rate this cycle to around 3.75% around the end of the year.”

The current bear market, however, may last for another 250 days, according to Grayscale’s “Bear Markets in Perspective” report. After Bitcoin recorded a daily close above its current range, traders expect the price of BTC to rise into the $27,000 to $32,000 region.

Related Reading | Bitcoin Dominance Dives As Ethereum Takes Up More Space

Featured image from iStock Photo, charts from TradingView.com

Dogecoin Emerges A Top Gainer Despite Musk Vs. Twitter Legal Tussle

The price of Dogecoin (DOGE) has been yipping higher across cryptocurrency exchanges, nibbling at an intraday high of $0.07657 for an increase of 11% over the previous day and a 23% spike over the previous week. This unexpectedly favorable price movement underscores the fact that DOGE appears to be fully untouched by complicated legal proceedings and ambiguity surrounding the potential $44 billion acquisition of Twitter by Elon Musk earlier this year.

Dogecoin Surges

The top meme tokens registered the majority of the gains as the whole cryptocurrency market saw green readings. Dogecoin (DOGE) was among the top gainers.

The majority of altcoins saw significant increases in their market capitalisation in July, according to Santiment. It stated that there has been a significant increase in whale trades valued at $100K. The tracker stated that one of the tokens seeing these huge network transactions is DOGE.

Over the course of the previous day, more than 80K Dogecoin transactions were registered, according to MyDoge wallet. The DOGE founder had already noted a significant increase in transactions that reached 70,000. This was said to have increased by 59.49% in the previous week.

Dogecoin Whale Alert, however, pointed out that Robinhood may have transferred about 3.2 billion DOGE (worth about $218 million) to its cold storage.

Source: Santiment

Over 13% more money has been spent on Dogecoin in the last day. As of the time of publication, it is trading for an average of $0.0745. The 24-hour trading volume for DOGE, however, has increased by more than 62% to $904 million. During 22% more has been added to DOGE prices over the past 30 days. Its current market capitalization is $9.89 billion.

DOGE/USD on bullish run. Source: TradingView

In the meantime, the whale tracker reported that DOGE had ranked among the top 1000 BSC whales in terms of smart contracts used over the previous 24 hours. However, just $10.6 million worth of Dogecoin is included among the top 100 whales.

Related reading | Dogecoin (DOGE) Seen Jumping This Month, Despite Twitter-Musk Deal Collapse

Musk Vs. Twitter Tussle Isn’t Affecting Price

This unexpectedly favorable price movement underscores the fact that DOGE appears to be fully untouched by complicated legal proceedings and ambiguity surrounding the potential $44 billion acquisition of Twitter by Elon Musk earlier this year.

The CEO of Tesla/SpaceX stated his desire to withdraw from the agreement two weeks ago. Musk countersued Twitter, which had filed a lawsuit to try and enforce the agreement. Following months of public debate between the parties, a Delaware judge yesterday decided that a five-day trial will be scheduled for October to resolve the issue.

Following the release of that information, Twitter’s stock price fell 2% this morning to $38.85 per share at the time of publication, according to Yahoo! Finance. According to the first release, the agreed upon price per share of Twitter stock under the definitive agreement to become a wholly-owned subsidiary of Elon Musk was $54.20, representing a 38 percent premium over the Twitter stock price on April 1, 2022.

Related reading | Dogecoin Shows Signs Of Vigor – DOGE Target Of $0.075 Within Range

Featured image from iStock Photo, charts from TradingView.com and Santiment

Ethereum Soars 41% In A Seven Day Run. Is the Upcoming Merge A Catalyst?

The second-largest cryptocurrency by market cap, Ethereum, has soared 45 percent during the past week, outperforming the majority of other betable assets. There could be a simple explanation for this:

As Ethereum’s team of developers approaches the conclusion of a multiyear, extremely difficult upgrade, traders are shifting positive.

Ethereum Surge

The second-largest cryptocurrency by market cap, Ethereum, has surged by about 45% over the past week, outperforming the majority of the top 100 crypto assets. While there are many theories surrounding ETH’s bullish trend, one of the main drivers of price movements is the impending Ethereum merger.

Trading in ETH has changed from bearish to bullish as developers get closer to finishing a multi-year, extremely difficult upgrade. The entire ETH supply in profit has now risen to 56% with the intense social expectation of the Merge, from lows of 41% just prior to the current price spike.

ETH/USD trades in new bullish momentum.

According to statistics from Glassnode, a significant clearing out of short positions in the futures market was the reason for Ethereum’s 22 percent gain this week.

Glassnode tweeted:

“Over $98M in short futures positions were liquidated in one hour, pushing $ETH prices up by 12.5%.”

The Number of ETH Addresses in Loss (7d MA) reached a 1-month low of 39,112,029 at press time, further demonstrating ETH’s recent bullish trend.

Source: Glassnode

Since the last actions that will really transfer Ethereum activity to the Beacon Chain are scheduled for September, there is still plenty of time for The Merge. Superphiz.eth, an Ethereum educator, added in a Tweet that Goerli would undergo the merging transfer as the last public testnet around August 11.

The mainnet merge is anticipated to float during the week of September 19 if everything with Goerli goes according to plan.

Related Reading | Ethereum Classic (ETC) Reclaims $3 Billion Market Cap, More Upside To Follow?

Experts Opinion

Youwei Yang, director of financial analytics at StoneX, says that two “certainties” are the cause of this upward rise for EthereumThe first is the recently announced time for the Ethereum “merge” update, which should make the network significantly more energy-efficient. Yang claims that the “calming” of macroeconomic anxieties is the second.

“Actually if you see the price movement tick by tick, this time it’s more like ETH leading BTC [or Bitcoin] instead of the other way around in usual times, so it’s a strong indication of ETH-led bear market rally with the confirmation and sentiment of ETH2.0,” said Yang, referring to post-merge Ethereum.

In his most recent episode of “The Breakdown,” famous podcaster and devoted industry watcher Nathaniel Whittemore made this assertion. There is a growing understanding that “the Merge” might influence markets on Twitter, Discord, and everywhere else people debate cryptocurrencies.

After months of low prices, the event suggests, as Whittemore put it, a “return of optimism” in the cryptocurrency markets. The Merge also fills a “narrative void,” allowing crypto enthusiasts to tell others stories about how this technology is changing the world.

Others believe that the Merge could be causing ETH price to spike due to structural reasons. The upgrade represents a fundamental change in the potential applications of Ethereum by rewarding investors who stake their assets in the network. Even Bitcoin-like deflationary forces that further benefit holders could result from the move. People who are purchasing ETH now in preparation may view it more as an investment than a transaction in this scenario.

Related Reading | Liquidations Cross $230 Million As Ethereum Barrels Past $1,400

Featured image from The Shutterstock, chart from TradingView.com

Bitcoin Barrels Towards $24k As Miners Move $300 Million From Wallets

Given that the price of Bitcoin has been lingering above the $17K–$20K range over the past few weeks, Bitcoin’s sharp downturn has come to an end. The price is currently retesting the $23K resistance level after being rejected three times from the $20K support area.

Bitcoin Advocates Rejoice

The market flashed its first significant relief rally in at least a month, and crypto enthusiasts rejoiced at the sight of green on July 19 as the months of “down only” price action finally came to a stop.

According to TradingView data, Bitcoin’s (BTC) breakthrough over resistance at $23,000 to reach a daily high of $23,447—its first appreciable move above the 200-week moving average—is largely responsible for the renewed optimism.

The $23K level is also experiencing extra opposition from the 50-day moving average. A further retest of the $20K support level and perhaps a deeper negative continuation are anticipated in this situation because it appears as though these two points are currently rejecting the price’s move downward. The bulls, though, seem keen to seize the level.

BTC/USD barrels towards $24k. Source: TradingView

In order to assess the likelihood of a negative reversal, the price action on the lower timeframes should be closely monitored throughout the course of the following few days. A rally into the $30K supply zone is the next move, especially if a bullish breakthrough happens above the $23K-$24K range.

While many have predicted a rise to the mid-$30,000 area, several analysts have expressed concern that it might just be another fakeout pump.

“Weekly Candle Close Above $22,800”

Rekt Capital, a cryptocurrency analyst, posted the following chart with the comment that “For the first time in weeks, BTC is putting in a decent effort to try to reclaim the 200-week MA as support.” The analyst has been paying close attention to the move back above the 200-week MA.

Related Reading | Mid Cap Crypto Coins Lead In July, Best Way To Weather The Winter?

In recent weeks, the 200-week MA has received a lot of attention since it has traditionally acted as a dependable bear market indicator that has given insight into when a bottom has been set.

As per Rekt Capital,

“BTC needs to Weekly Candle Close above $22800 to successfully confirm a reclaim of the 200-week MA as support.”

Miners Capitulate

Miners have entered the capitulation phase, who have started to slightly distribute their holdings. The hashrate of Bitcoin has been in a minor downturn following a new all-time high during the previous shakeout, exhibiting the same behavior.

Within a 24-hour period, cryptocurrency miners removed up to 14,000 bitcoin, each worth $300 million, from their wallets.

Due to the recent decline in the value of many digital currencies, miners sold their bitcoin holdings.

Source: CryptoQuant

This minor fall in the hashrate is expected given that Bitcoin’s price is currently approximately 74% off its all-time high and that mining may not be profitable for many miners and pools. But despite the current price correction’s size, the hashrate is still doing fairly well. In the past, the bear market’s ultimate phase has been identified by the capitulation of the miners. Therefore, there is a strong likelihood that Bitcoin will soon reach its long-term bottom and start a fresh uptrend toward higher price levels.

Related Reading | Bitcoin Marks One Month Of Negative Funding Rates, More Decline Incoming?

Featured image from iStock Photo, charts from TradingView.com and CryptoQuant

Has Ethereum Bottomed? Streak Of Green Candlesticks Indicate Recovery

Strong technical indicators for the price of ethereum suggest that the bull run might only be beginning.

Ethereum Has Bottomed?

Ethereum [ETH] has had a recovery over the previous five days from its month-long demand zone in the $1,049 range. As a result of the recent run of green candlesticks, ETH is now under bullish control for the immediate future.

At this time, the price of ethereum is $1,563. In response to the bear’s year-long suppression, the bulls are indicating a fierce retaliation. If the bears are unable to halt the bullish trend, ETH price will likely continue increasing towards $1,650. It has set a big objective mark at $1,450.

ETH/USD trades at $1,563. Source: TradingView

ETH lost more than half of its value in just nine days when it was in its previous downturn phase (from 10 June). As a result, on June 19, the alt drew closer to its 17-month low.

However, the bulls promptly confirmed the $1,049-zone demand zone and promoted an up-channel (yellow) resurrection in the 4-hour timeframe. As a result of the increased bullishness, the 20 EMA (red) moved above the 200 EMA (cyan).

The bears may attempt to test the $1,390 level again if they recover from the 61.8 percent level. A further breakdown from the up-channel could lead to a retest of the 20 EMA to the north before a likely recovery.

Investors who took part in the bullish knife-catching trading setup from last week are 35 percent in the black. At $1,304, bulls looking to join the market would be invalidated. The price of Ethereum might drop by 45 percent if the bears break through this barrier and proceed to tumble toward $970.

Related Reading | TA: Ethereum Outpaces Bitcoin, Why ETH Could Rise To $1,500

Is Merge Pushing Price?

Since the Merge schedule was made public, trading activity in the ETH market has increased. Podcaster Luke Martin claimed in a tweet that the price spike was prompted by the news of the ETH merger.

“The ETH merge trade begins: ever since the merge timeline update it has outperformed.”

Merge’s schedule might still be extended past the predetermined date, though. This mostly depends on how well the Goerli merging is implemented. Crypto VC expert Haseeb Qureshi predicted that the merge timeframe would be delayed.

Related Reading | Liquidations Cross $230 Million As Ethereum Barrels Past $1,400

Featured image from iStock Photo, charts from TradingView.com

Bitcoin Rally As Altcoins Turn Green, Pushes Market Above $1 Trillion Threshold

Following strong weekly double-digit gains from Bitcoin and a number of big-cap altcoins, the cryptocurrency market capitalization surpassed $1 trillion.

$1 Trillion Market Crossed Again

For the first time since June 13, a significant gain on Monday in both bitcoin and ether helped lift the market worth of cryptocurrencies back beyond the $1 trillion level.

The largest cryptocurrency has reached its highest prices since a selloff in mid-June brought the price of bitcoin down from $30,000 to as low as $18,000, rising 5% in the last 24 hours to $22,300.

During the late 2017 bull market surge for bitcoin, that same level served as a strong region of resistance, and in technical analysis, old resistance typically turns into new support (and vice versa).

Crypto market cap above $1 trillion threshold. Source: TradingView

For cryptocurrency investors, Monday’s profits should come as a relief after the preceding nine months have seen them endure a terrible bear market. As a result of the prolonged bear market in cryptocurrencies, $2 trillion in market value has been lost, and several crypto companies, including Celsius, Voyager Digital, and Three Arrows Capital, have gone bankrupt.

Despite analyst predictions that the Federal Reserve would increase interest rates by at least 75 basis points at the Federal Open Market Committee meeting on July 27, the traditional markets are mildly higher on the day that cryptocurrencies are generally in the black.

While traders may like the uptick in price on July 18, several analysts warn that it is merely a bear market pump.

Related Reading | Bitcoin Bearish Signal: Exchange Netflows Spike Up

Bitcoin Poised For Rebound

According to TradingView data, Bitcoin has made considerable gains over the past week. At the time of writing, BTC had risen by 16 percent from its most recent low of $18,907.

The most valuable cryptocurrency is currently bumping up into resistance at the 200-week moving average, which also happens to be the top of the trading range that BTC has been stuck in since the middle of June.

Over the past five weeks, attempts to break above this level have been repeatedly rejected, proving it to be a difficult nut to crack. It is yet unclear whether Bitcoin will be able to overcome this barrier and climb higher or if it will continue to fluctuate between $19,000 and $22,000.

The major distinction between the present bear market and previous cycles, according to Glassnode’s most recent newsletter, is “duration” and many on-chain measures are now comparable to these historical drawdowns.

Realized price, which is calculated as the value of all Bitcoin divided by the quantity of BTC in circulation, has shown to be a good indicator of bear market bottoms.

Number of days Bitcoin price traded below the realized price. Source: Glassnode

With the exception of the flash crash in March 2020, which is depicted on the above chart, Bitcoin has consistently traded below its realized price for a protracted period of time throughout bear markets.

Glassnode explained:

“The average time spent below the Realized Price is 197-days, compared to the current market with just 35-days on the clock.”

Related Reading | Bitcoin Breaks Above Realized Price Again, Bottom Finally In?

Featured image from Getty Images, charts from TradingView.com

Ethereum Merge Now Has A Date, Price Jumps 12%

A specific deadline for the transition to proof-of-stake has been been offered by Ethereum developers who are working on implementing the merging.

Ethereum Merge Now Has A Date

The Ethereum mainnet is now scheduled to launch the merging during the week of September 19, according to a recent developer teleconference. This will happen after switching the final testnet before the merge to PoS.

The adoption of the transition has been delayed on a number of occasions. The crucial transition of the Ethereum network from proof-of-work (PoW) mining consensus to proof-of-stake is almost complete (PoS). During a conference call on Thursday, members of the Ethereum development team declared a timetable for the permanent merger.

Tim Beiko, a core Ethereum developer who oversees protocol meetings, suggested September 19 as a viable date for the merger during the conference call. The core developers did not object to the planned goal date. These professionals are giving their all to make sure the combo is successful.

The Goerli testnet merge is anticipated to be live in the second week of August. The Bellatrix update will then be released on the blockchain in early September, followed by the merge two weeks later.

The new integration date roughly corresponds to the late-August schedule Vitalik Buterin suggested earlier this year.

Previously, a shadow fork on the mainnet resulted in the shutdown of 20% of nodes following its rollout, raising questions regarding merging stability. After the Beacon chain underwent a 7-block deep reorganization in May, the price of ethereum crashed. Superphiz.eth, an Ethereum developer, talked about the merger’s timeline and underlined that the proposed goal date should be viewed as a road map rather than a strict deadline.

The Sepolia testnet Beacon Chain launched in June, clearing the way for Merge dress rehearsal to offer technical insights to Ethereum network developers. This process culminated with the Sepolia being incorporated into the network on July 7.

It is anticipated that switching to Proof of Stake (PoS) technology will reduce energy consumption by 99%. The first quarter of 2023 is when sharding is expected to be implemented, greatly enhancing network scalability.

The PoS vs. PoW debate has been going on for a while, with supporters of PoS arguing that it is both equally secure and more ecologically friendly. Opponents of PoW, like Jack Dorsey, have criticized it as centralized and insecure.

Related reading | Upcoming ETH Merge Sees Institutional Investor Sentiment Turn Positive

News Result In 12% Price Jump

Despite the bear market’s persistence, investors have enormous faith in the Merge event, as seen by this morning’s increase of more than 10% in the second-largest cryptocurrency. According to TradingView, the current price of one Ethereum token is $1,216. On the previous day, it had a trading volume of $19 Billion. Ethereum’s value has increased by 12.86% during the last day.

ETH/USD jumps 12% following merger news. Source: TradingView

The merger’s success will still depend on how successfully it is executed, though. The switch to PoS will unquestionably be the blockchain’s biggest improvement since Ethereum’s hard fork in 2016 that gave rise to Ethereum Classic. The value of the token has decreased by about 70% as a result of rising inflation and interest rates.

Due to the fact that it would make investing in the token much more accessible, the merger is anticipated to have a good overall impact on Ethereum pricing. Additionally, ETH’s institutional appeal may increase by acting like a debt instrument thanks to staking benefits.

But only if the merge is carried out successfully. Since the hard fork in 2016 that led to the establishment of Ethereum Classic, the switch to PoS will likely represent the biggest change to the blockchain.

Recent market turbulence may have limited Ethereum’s ability to gain significant bullish traction. The token’s value has decreased by around 70% this year as a result of higher inflation and interest rates.

Related Reading | TA: Ethereum Holds Key Support, Why ETH Must Clear This Hurdle

Featured image from Shutterstock, chart from TradingView.com